

S&P 500
An upwards day fits expectations for the main short term Elliott wave count.
Summary: Assume that while price remains above 2,791.47 either a shallow consolidation may continue sideways for a few days or a brief pullback was over at the last low. A new high above 2,848.03 with support from volume would indicate the correction is over.
A new low below 2,791.47 would indicate a deeper pullback may continue. The target for it to end would then be about 2,752.
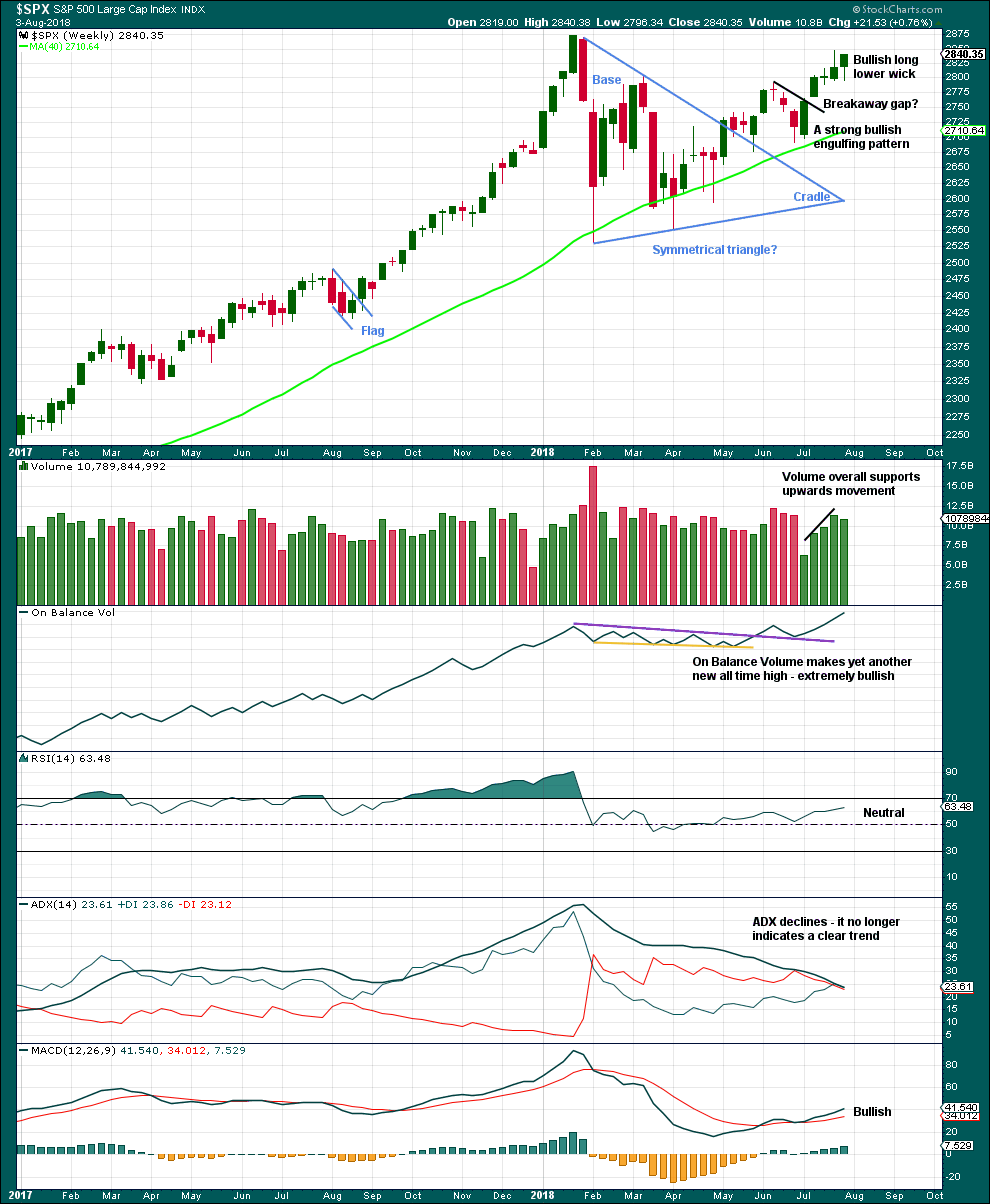
At the end of the week, the AD line is making new all time highs at the daily and weekly chart levels and On Balance Volume has a new all time high on the weekly chart. This is all very bullish.
If my expectations are wrong for another small pullback, then my error may be in expecting a pullback which may not come. Price may simply continue strongly higher.
The bigger picture remains extremely bullish.
The next target is about 2,915, where another consolidation to last about two weeks may be expected.
The invalidation point remains at 2,743.26.
The mid to longer term target is at 2,922 (Elliott wave) or 3,045 (classic analysis). Another multi week to multi month correction is expected at one of these targets.
The final target for this bull market to end remains at 3,616.
Always practice good risk management. Always trade with stops and invest only 1-5% of equity on any one trade.
The biggest picture, Grand Super Cycle analysis, is here.
Last historic analysis with monthly charts is here, video is here.
ELLIOTT WAVE COUNT
WEEKLY CHART
Click chart to enlarge.
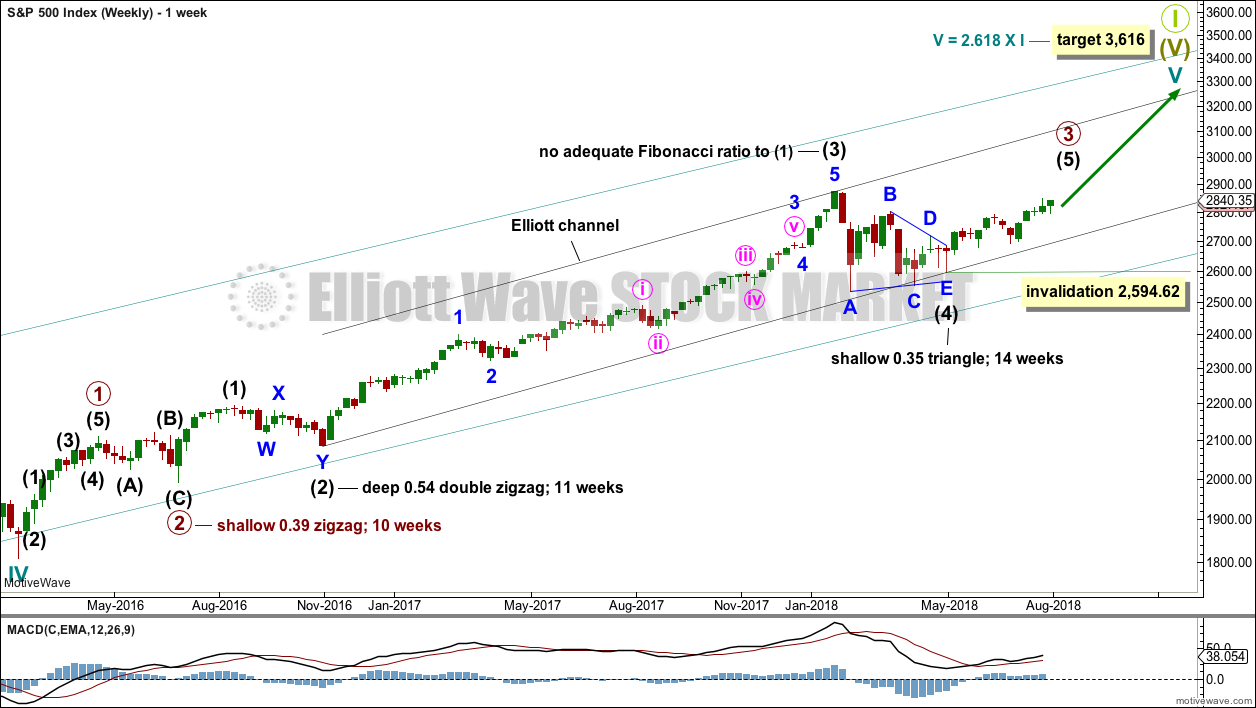
Cycle wave V must complete as a five structure, which should look clear at the weekly chart level and also now at the monthly chart level. It may only be an impulse or ending diagonal. At this stage, it is clear it is an impulse.
Within cycle wave V, the third waves at all degrees may only subdivide as impulses.
Intermediate wave (4) has breached an Elliott channel drawn using Elliott’s first technique. The channel is redrawn using Elliott’s second technique: the first trend line from the ends of intermediate waves (2) to (4), then a parallel copy on the end of intermediate wave (3). Intermediate wave (5) may end either midway within the channel, or about the upper edge.
Intermediate wave (4) may now be a complete regular contracting triangle lasting fourteen weeks, one longer than a Fibonacci thirteen. There is perfect alternation and excellent proportion between intermediate waves (2) and (4).
Within intermediate wave (5), no second wave correction may move beyond the start of its first wave below 2,594.62. However, the lower edge of the black Elliott channel drawn across the ends of intermediate degree waves should provide very strong support for any deeper pullbacks, holding price well above the invalidation point while intermediate wave (5) unfolds.
At this stage, the expectation is for the final target to me met in October 2019.
A multi week to multi month consolidation for primary wave 4 is expected on the way up to the final target.
The last bullish fifth wave of minor wave 5 to end intermediate wave (3) exhibited commodity like behaviour. It was strong and sustained. It is possible that the upcoming wave of minor wave 5 to end intermediate wave (5) to end primary wave 3 may exhibit similar behaviour, so we should be on the lookout for this possibility.
DAILY CHART
Click chart to enlarge.
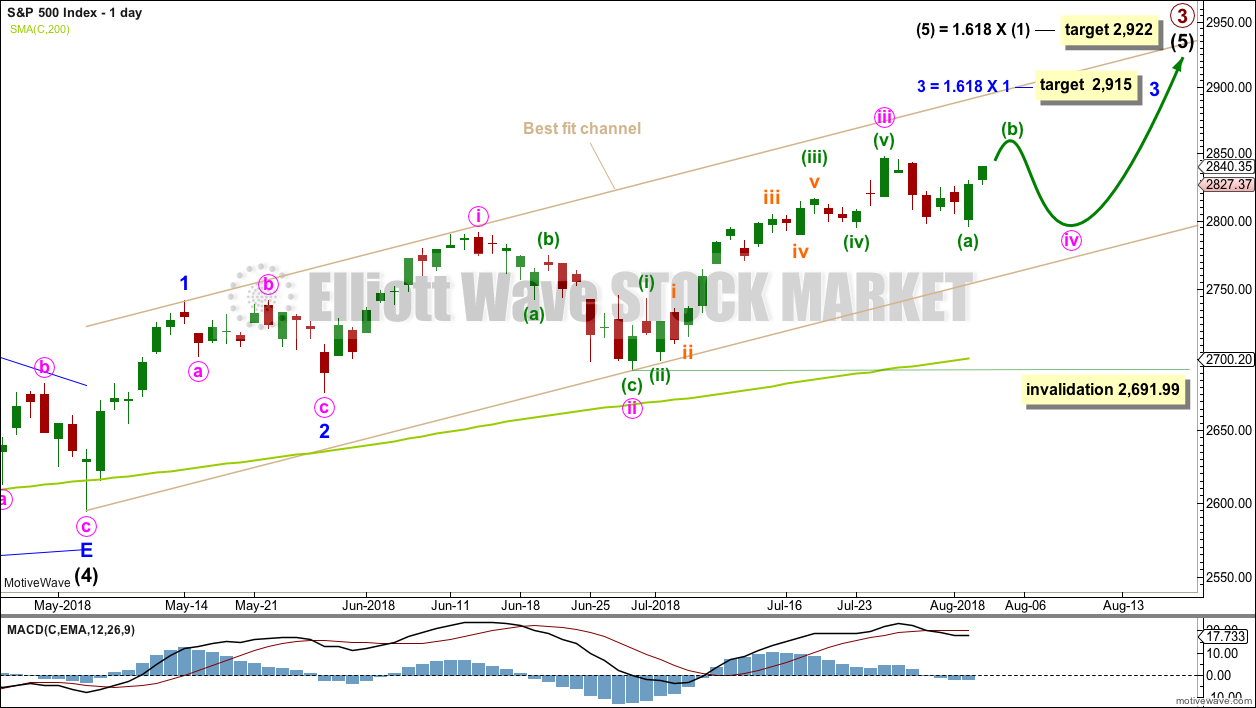
Intermediate wave (5) would be very likely to make at least a slight new high above the end of intermediate wave (3) at 2,872.87 to avoid a truncation.
Intermediate wave (3) exhibits no Fibonacci ratio to intermediate wave (1). It is more likely then that intermediate wave (5) may exhibit a Fibonacci ratio to either of intermediate waves (1) or (3). The most common Fibonacci ratio would be equality in length with intermediate wave (1), but in this instance that would expect a truncation. The next common Fibonacci ratio is used to calculate a target for intermediate wave (5) to end.
It is possible that minute wave iii could be over at last week’s high; if it is complete here, it would not exhibit a Fibonacci ratio to minute wave i. Minute wave iv must be very shallow to remain above minute wave i price territory at 2,791.47.
At this stage, it is possible that minute wave iv was over at this week’s low, or that it may continue sideways for a few days as a flat. A flat correction requires a new high to at least 2,842.86 and possibly above 2,848.03, followed by a short wave down to end below 2,796.34 but not below 2,791.47.
If downwards movement continues below 2,791.47, then the best alternate idea would be to move the degree of labelling within minute wave iii all down one degree and see only minuette wave (i) within minute wave iii complete at the last high. Downwards movement would then be labelled minuette wave (ii), which may not move beyond the start of minuette wave (i) below 2,691.99. However, downwards movement should find support reasonably above the invalidation point at support about the lower edge of the best fit channel.
A target is calculated for minor wave 3 to end, which expects to see the most common Fibonacci ratio to minor wave 1. Minor wave 3 may last several weeks in total and should look like an impulse at the daily chart level. When it is complete, then minor wave 4 may last about one to two weeks in order for it to exhibit reasonable proportion to minor wave 2. Minor wave 4 must remain above minor wave 1 price territory.
A best fit channel is added in taupe to this chart. It contains all of intermediate wave (5) so far. The lower edge may provide support for any deeper pullbacks. The upper edge may provide resistance.
TECHNICAL ANALYSIS
WEEKLY CHART
Click chart to enlarge. Chart courtesy of StockCharts.com.
Another new high for On Balance Volume remains very bullish indeed, but that does not preclude another small pullback within this developing upwards trend. It is still expected that price is very likely to make new all time highs, but it will not move in a straight line.
This week’s candlestick is bullish with a long lower wick. But it lacks support from volume, which may suggest a B wave.
DAILY CHART
Click chart to enlarge. Chart courtesy of StockCharts.com.
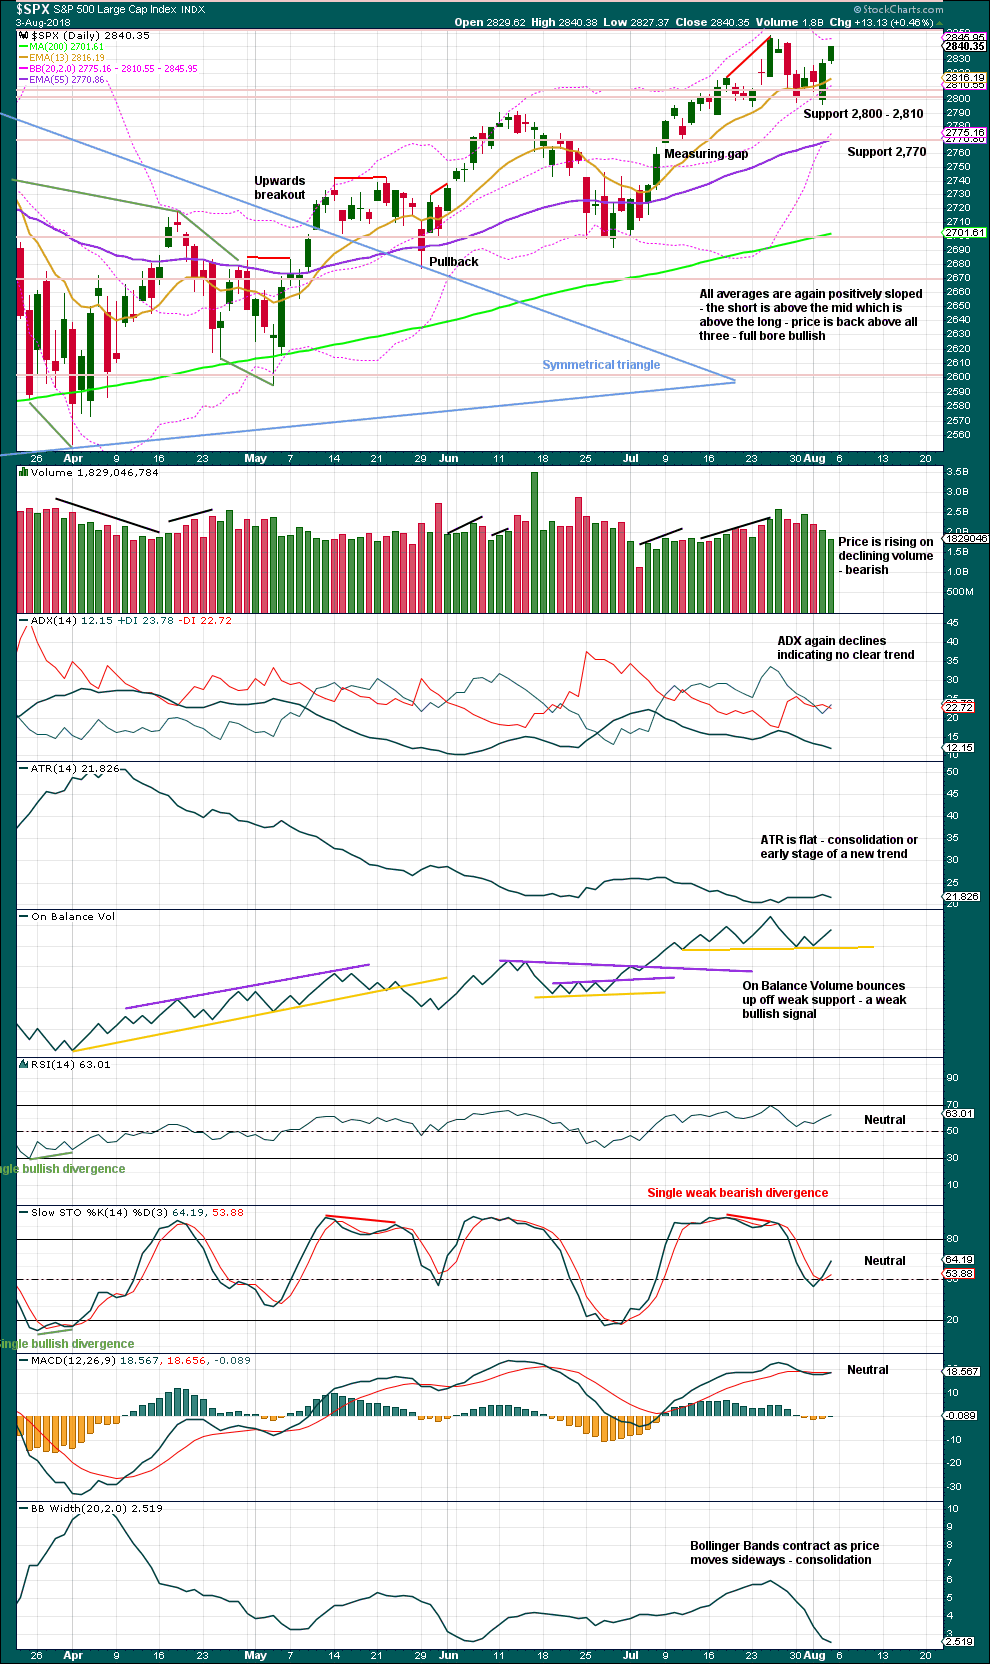
The symmetrical triangle may now be complete. The base distance is 340.18. Added to the breakout point of 2,704.54 this gives a target at 3,044.72. This is above the Elliott wave target at 2,922, so the Elliott wave target may be inadequate.
Since the low on the 2nd of April, 2018, price has made a series of higher highs and higher lows. This is the definition of an upwards trend. But trends do not move in perfectly straight lines; there are pullbacks and bounces along the way.
This bull run now has some support from volume and strong support from On Balance Volume making new all time highs.
Upwards movement of the last two days looks weak. On Balance Volume at the daily chart level has not made a new all time high, and volume does not support upwards movement. However, a close at highs for Friday strongly suggests at least a little upwards movement to begin next week.
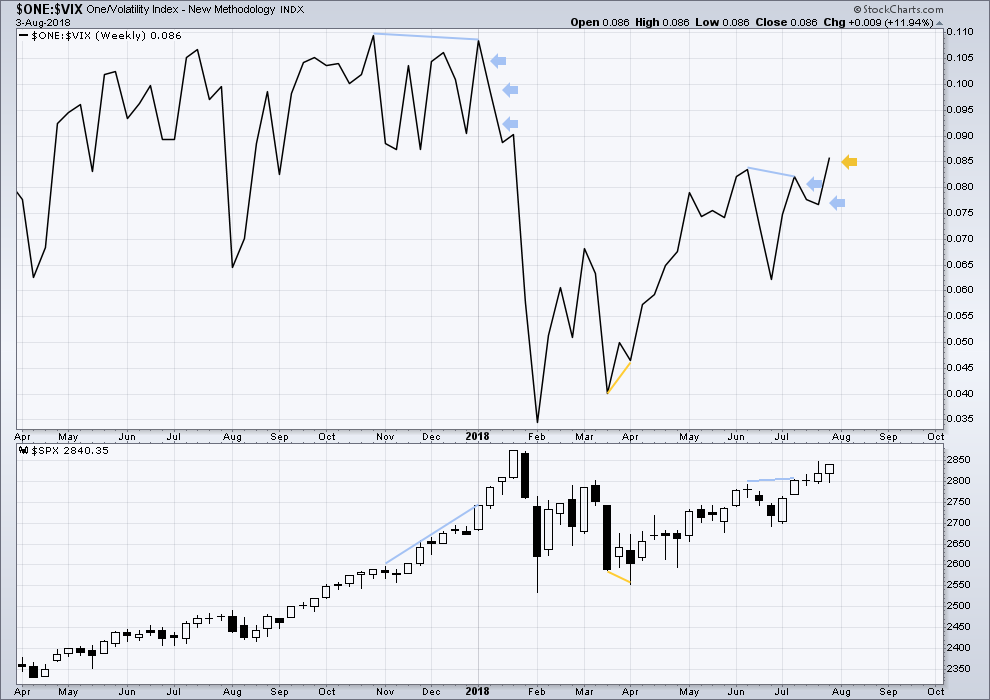
VOLATILITY – INVERTED VIX CHART
WEEKLY CHART
Click chart to enlarge. Chart courtesy of StockCharts.com. So that colour blind members are included, bearish signals
will be noted with blue and bullish signals with yellow.
To keep an eye on the all time high for inverted VIX a weekly chart is required at this time.
Notice how inverted VIX has very strong bearish signals four weeks in a row just before the start of the last large fall in price. At the weekly chart level, this indicator may be useful again in warning of the end of primary wave 3.
This week completes an inside week that closed green, and the balance of volume was upwards.
Upwards movement this week has support from declining market volatility. Inverted VIX has made a new short term high, but price has not yet; this short term divergence is bullish.
Inverted VIX is still some way off from making a new all time high.
DAILY CHART
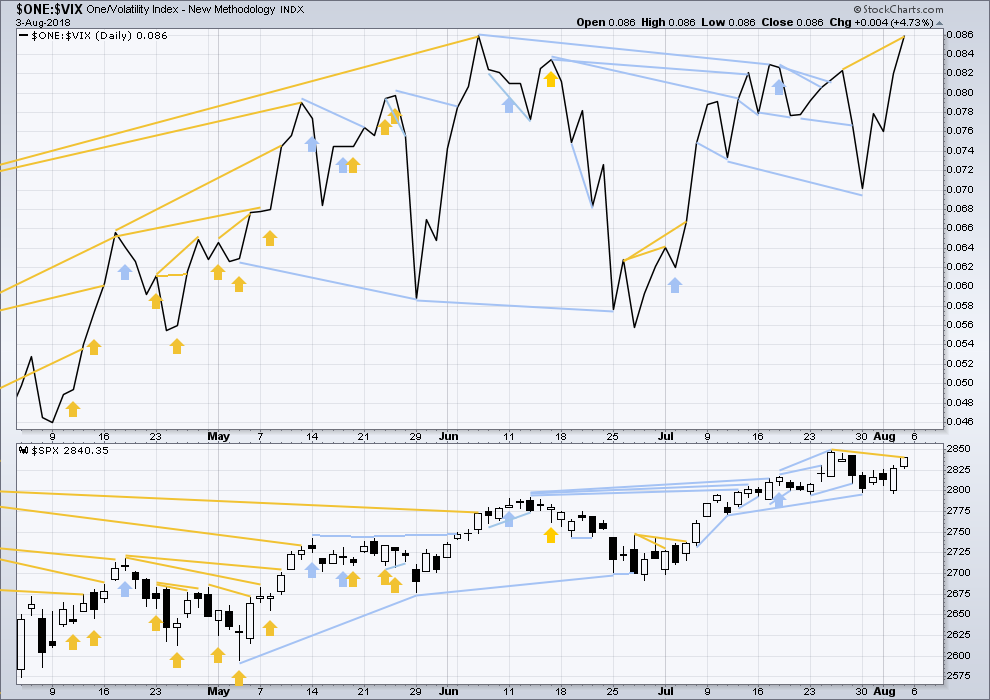
Click chart to enlarge. Chart courtesy of StockCharts.com. So that colour blind members are included, bearish signals
will be noted with blue and bullish signals with yellow.
Normally, volatility should decline as price moves higher and increase as price moves lower. This means that normally inverted VIX should move in the same direction as price.
Last noted mid term bearish divergence has not been followed yet by more downwards movement. It may still indicate downwards movement ahead as there is now a cluster of bearish signals from inverted VIX.
There is new bullish divergence at the weekly chart level for the short term. Inverted VIX moved strongly higher this week to make a new high above the prior swing high of seven sessions ago, but price has not yet quite made a new high above the equivalent point.
BREADTH – AD LINE
WEEKLY CHART
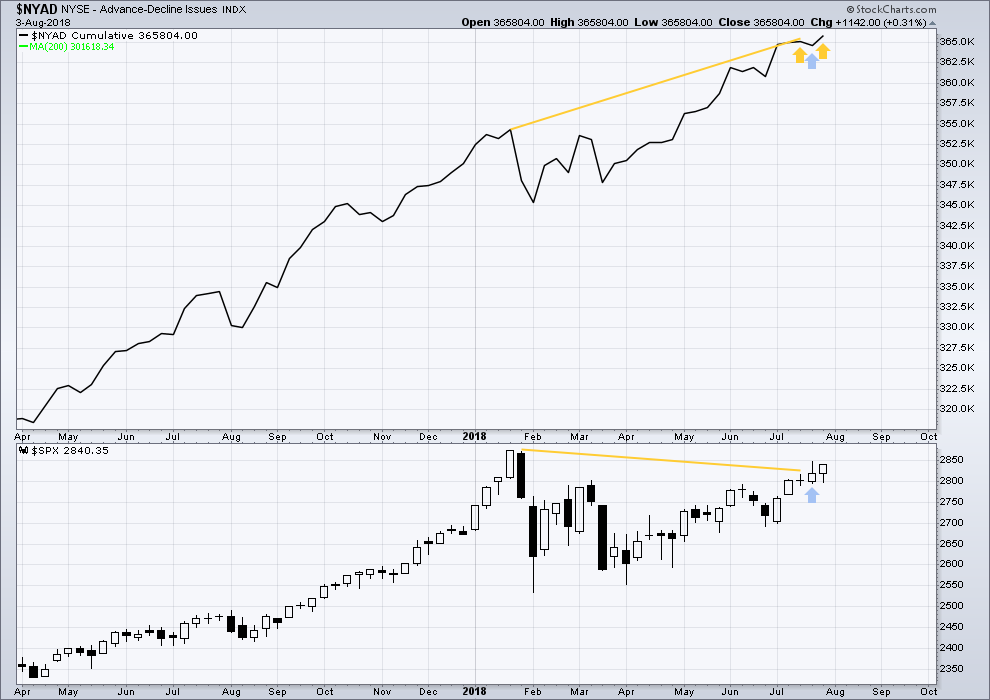
Click chart to enlarge. Chart courtesy of StockCharts.com.
When primary wave 3 comes to an end, it may be valuable to watch the AD line at the weekly time frame as well as the daily.
At this stage, there is very strong bullish divergence between price and the AD line at the weekly time frame. With the AD line making new all time highs, expect price to follow through with new all time highs in coming weeks.
Price this week completed an inside week with the balance of volume upwards. Upwards movement has support from rising market breadth. Another new all time high this week from the AD line is bullish.
DAILY CHART
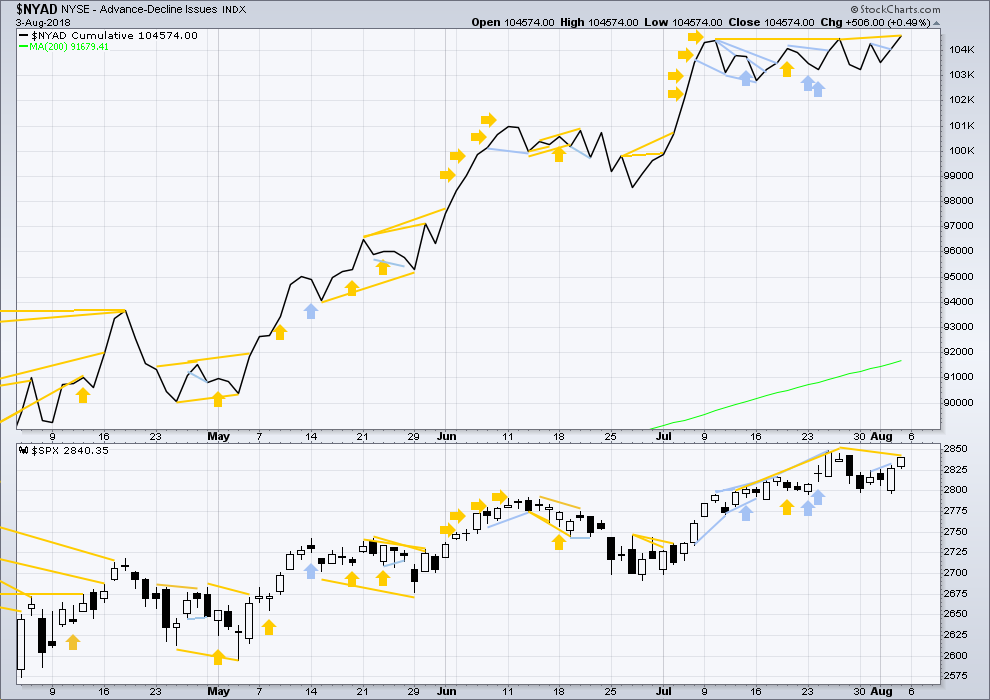
Click chart to enlarge. Chart courtesy of StockCharts.com.
There is normally 4-6 months divergence between price and market breadth prior to a full fledged bear market. This has been so for all major bear markets within the last 90 odd years. With no longer term divergence yet at this point, any decline in price should be expected to be a pullback within an ongoing bull market and not necessarily the start of a bear market. New all time highs from the AD line means that any bear market may now be an absolute minimum of 4 months away. It may of course be a lot longer than that. My next expectation for the end of this bull market may now be October 2019.
Breadth should be read as a leading indicator.
The last signal from the AD line was very bullish, with another new all time high last Thursday.
The AD line has made a new high above the prior high seven sessions ago, but price has not yet made an equivalent new high. This divergence is bullish.
Another new all time high from the AD line on the daily chart is very bullish.
Small caps have made another slight new all time on Friday. Mid caps made a new all time high on the 10th of July. Only large caps have to follow through; they do usually lag in the latter stages of a bull market.
DOW THEORY
The following lows need to be exceeded for Dow Theory to confirm the end of the bull market and a change to a bear market:
DJIA: 23,360.29.
DJT: 9,806.79.
S&P500: 2,532.69.
Nasdaq: 6,630.67.
Only Nasdaq at this stage is making new all time highs, with another new all time high on Friday of last week. DJIA and DJT need to make new all time highs for the ongoing bull market to be confirmed.
GOLD
Downwards movement continued a little further as the main Elliott wave count expected, but fell 8.69 short of the target.
Summary: A low may again be in place. Confidence may be had with a new high above 1,265.59.
A target for a strong bounce here is about 1,304, which may be reached in several weeks. Along the way up, there may be either a sharp pullback or a sideways time consuming consolidation.
Always trade with stops to protect your account. Risk only 1-5% of equity on any one trade.
Grand SuperCycle analysis is here.
Last historic analysis with monthly charts and several weekly alternates is here, video is here.
MAIN ELLIOTT WAVE COUNT
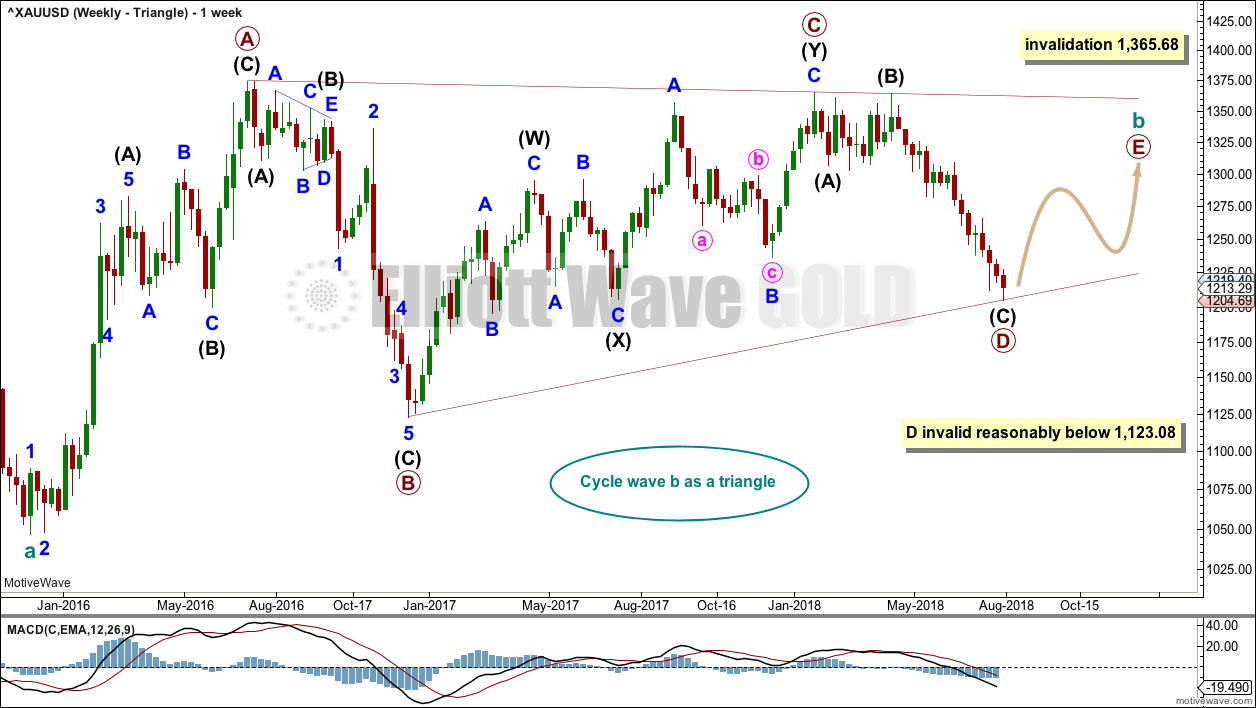
WEEKLY CHART – TRIANGLE
Click chart to enlarge.
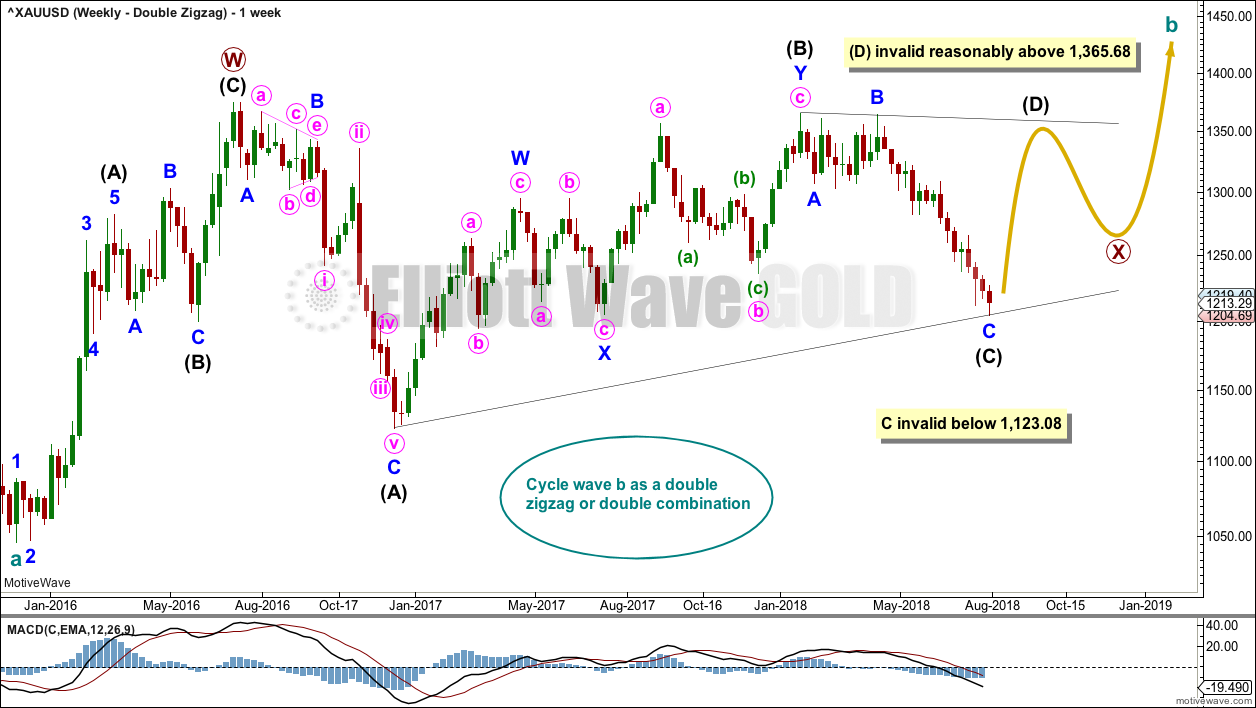
There are four remaining weekly wave counts at this time for cycle wave b: a triangle, flat, combination or double zigzag. All four weekly charts will be reviewed in this analysis.
While the direction does not diverge for these four weekly wave counts, only one weekly wave count shall be published on a daily basis, so that the analysis is manageable for me to publish and for members to digest. Note: This does not mean that the remaining three counts may not be correct.
The triangle so far has the best fit and look.
Cycle wave b may be an incomplete triangle. The triangle may be a contracting or barrier triangle, with a contracting triangle looking much more likely because the A-C trend line does not have a strong slope. A contracting triangle could see the B-D trend line have a stronger slope, so that the triangle trend lines converge at a reasonable rate. A barrier triangle would have a B-D trend line that would be essentially flat, and the triangle trend lines would barely converge.
Within a contracting triangle, primary wave D may not move beyond the end of primary wave B below 1,123.08. Within a barrier triangle, primary wave D may end about the same level as primary wave B at 1,123.08, so that the B-D trend line is essentially flat. Only a new low reasonably below 1,123.08 would invalidate the triangle.
Within both a contracting and barrier triangle, primary wave E may not move beyond the end of primary wave C above 1,365.68.
Four of the five sub-waves of a triangle must be zigzags, with only one sub-wave allowed to be a multiple zigzag. Primary wave C is the most common sub-wave to subdivide as a multiple, and this is how primary wave C for this example fits best.
Primary wave D must be a single structure, most likely a zigzag.
There are no problems in terms of subdivisions or rare structures for this wave count. It has an excellent fit and so far a typical look.
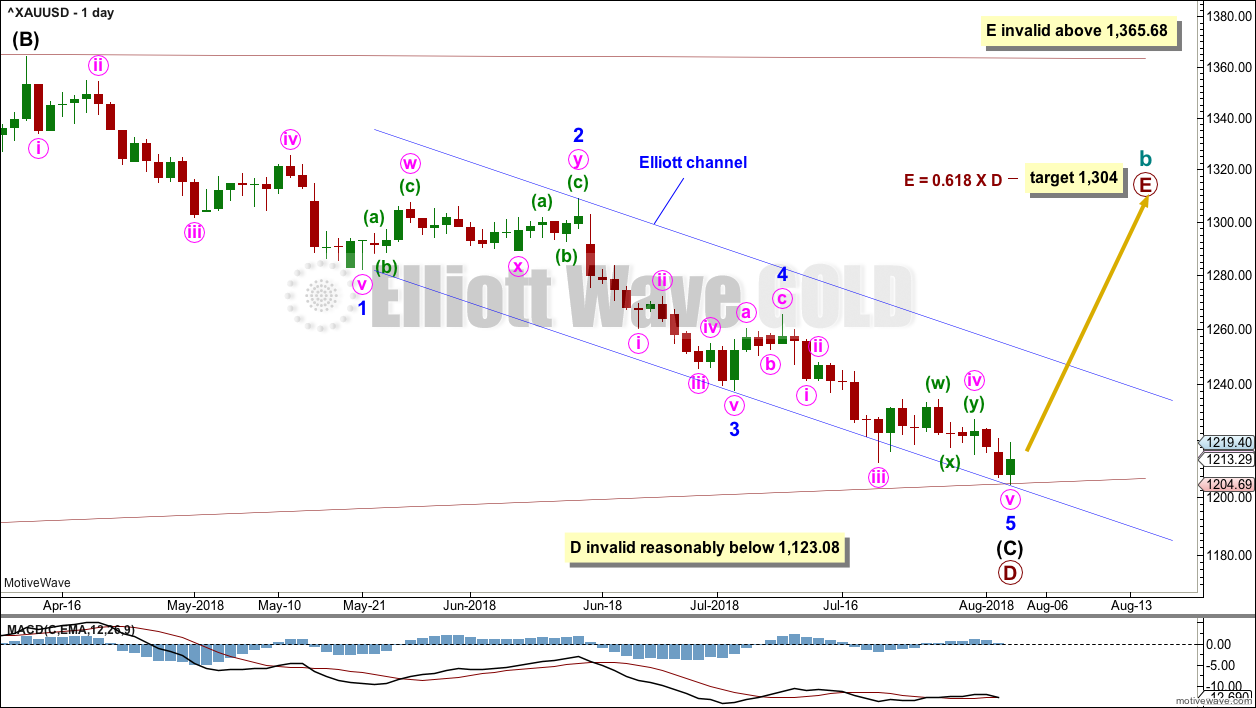
DAILY CHART – TRIANGLE
Click chart to enlarge.
Primary wave D may again be over at the end of this week. The structure may again be complete at all wave degrees.
Minor wave 5 may have ended almost exactly at the lower edge of the blue Elliott channel.
A target is calculated for primary wave E to end. Primary wave E must subdivide as a zigzag. It may last several weeks.
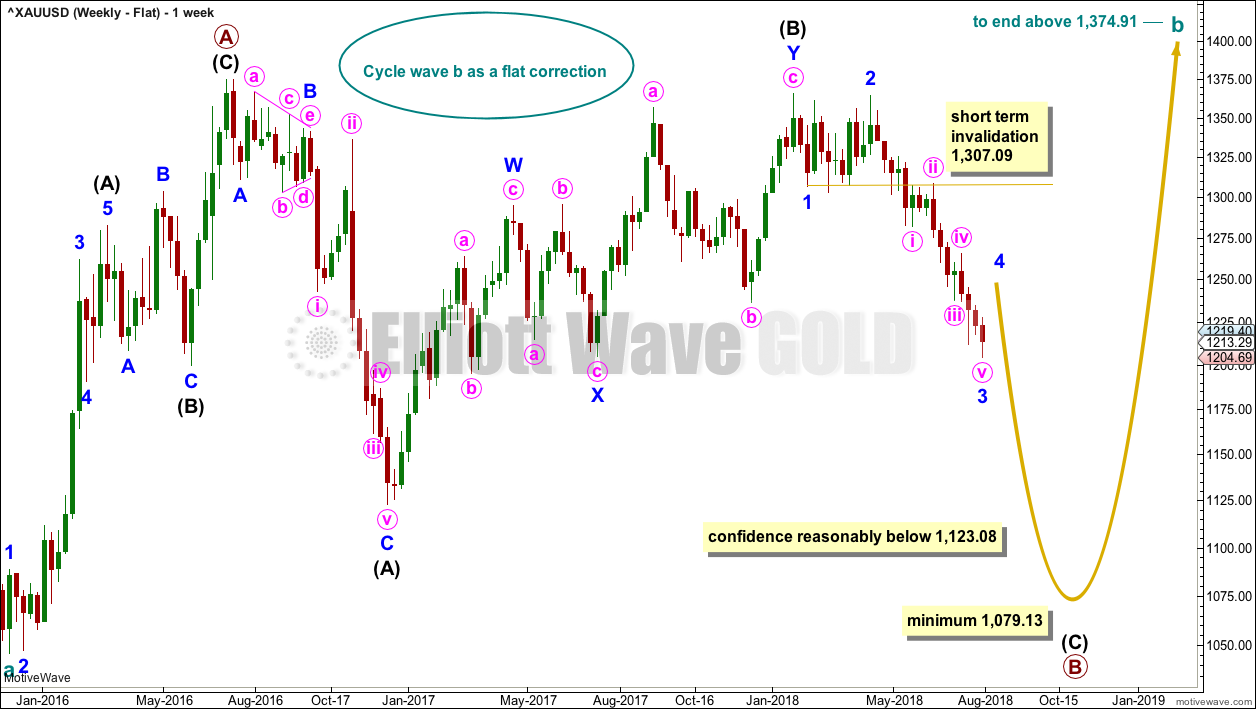
WEEKLY CHART – FLAT
Click chart to enlarge.
It is possible that cycle wave b may be a flat correction. Within a flat correction, primary wave B must retrace a minimum 0.9 length of primary wave A at 1,079.13 or below. Primary wave B may make a new low below the start of primary wave A at 1,046.27 as in an expanded flat correction.
Only a new low reasonably below 1,123.08 would provide reasonable confidence in this wave count.
Intermediate wave (C) must subdivide as a five wave structure; it may be unfolding as an impulse. Within the impulse, minor waves 1, 2 and now 3 may be complete and minor wave 4 may not move into minor wave 1 price territory above 1,307.09.
Minor wave 2 was a double zigzag lasting nine weeks. To exhibit alternation and reasonable proportion minor wave 4 may be a flat, combination or triangle and may last a little longer than nine weeks as these types of corrections tend to be longer lasting than zigzags or zigzag multiples.
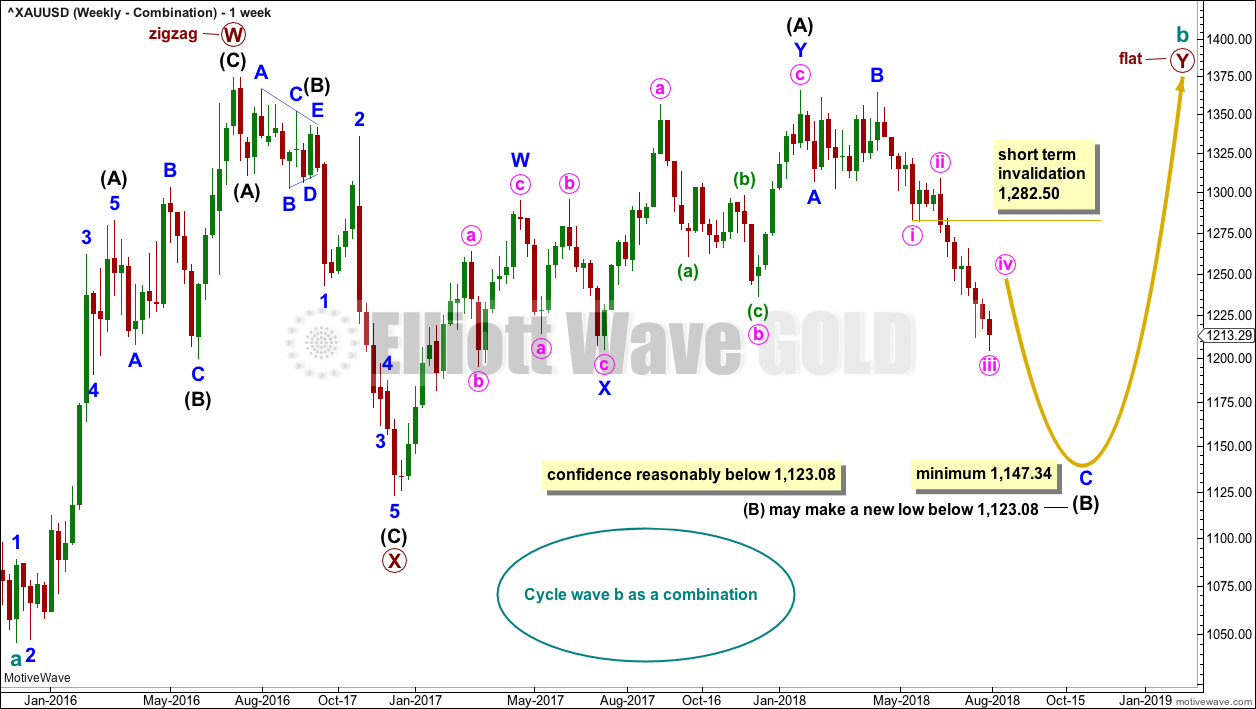
WEEKLY CHART – COMBINATION
Click chart to enlarge.
It is essential when a triangle is considered to always consider alternates. Too many times over the years I have labelled a triangle as unfolding or even complete, only for it to be invalidated and the structure turning out to be something else.
When a triangle is invalidated, then the most common structure the correction turns out to be is a combination.
If cycle wave b is a combination, then the first structure in a double may be a complete zigzag labelled primary wave W.
The double may be joined by a three in the opposite direction, a zigzag labelled primary wave X.
The second structure in the double may be a flat correction labelled primary wave Y. It may also be a triangle, but that would expect essentially the same movement as the weekly triangle chart and so shall not yet be considered while there is no divergence in the expected pathway for price.
Within a flat correction for primary wave Y, the current downwards wave of intermediate wave (B) may be a single or multiple zigzag; for now it shall be labelled as a single. Intermediate wave (B) must retrace a minimum 0.9 length of intermediate wave (A) at 1,147.34. Intermediate wave (B) may move beyond the start of intermediate wave (A) as in an expanded flat.
Within the zigzag of intermediate wave (B), minor waves A and B may be complete. Minor wave C must subdivide as a five wave structure; at this stage, it may be an incomplete impulse. Within minor wave C, minute waves i and ii and now iii may be complete. Minute wave iv may not move into minute wave i price territory above 1,282.50.
When intermediate wave (B) is complete, then intermediate wave (C) would be expected to make at least a slight new high above the end of intermediate wave (A) at 1,365.68 to avoid a truncation. Primary wave Y would be most likely to end about the same level as primary wave W at 1,374.91, so that the whole structure takes up time and moves price sideways, as that is the purpose of double combinations.
While double combinations are very common, triples are extremely rare. When the second structure in a double is complete, then it is extremely likely that the whole correction is over.
WEEKLY CHART – DOUBLE ZIGZAG
Click chart to enlarge.
Finally, it is also possible that cycle wave b may be a double zigzag or a double combination.
The first zigzag in the double is labelled primary wave W. This has a good fit.
The double may be joined by a corrective structure in the opposite direction, a triangle labelled primary wave X. The triangle would be only a little over halfway through.
Within the triangle of primary wave X, intermediate wave (C) may now be complete. If it continues any lower, then it may not move beyond the end of intermediate wave (A) below 1,123.08.
This wave count may now expect choppy overlapping movement in an ever decreasing range for several more months. After the triangle is complete, then an upwards breakout would be expected from it.
Primary wave Y would most likely be a zigzag because primary wave X would be shallow; double zigzags normally have relatively shallow X waves.
Primary wave Y may also be a flat correction if cycle wave b is a double combination, but combinations normally have deep X waves. This would be less likely.
This wave count has good proportions and no problems in terms of subdivisions.
TECHNICAL ANALYSIS
WEEKLY CHART
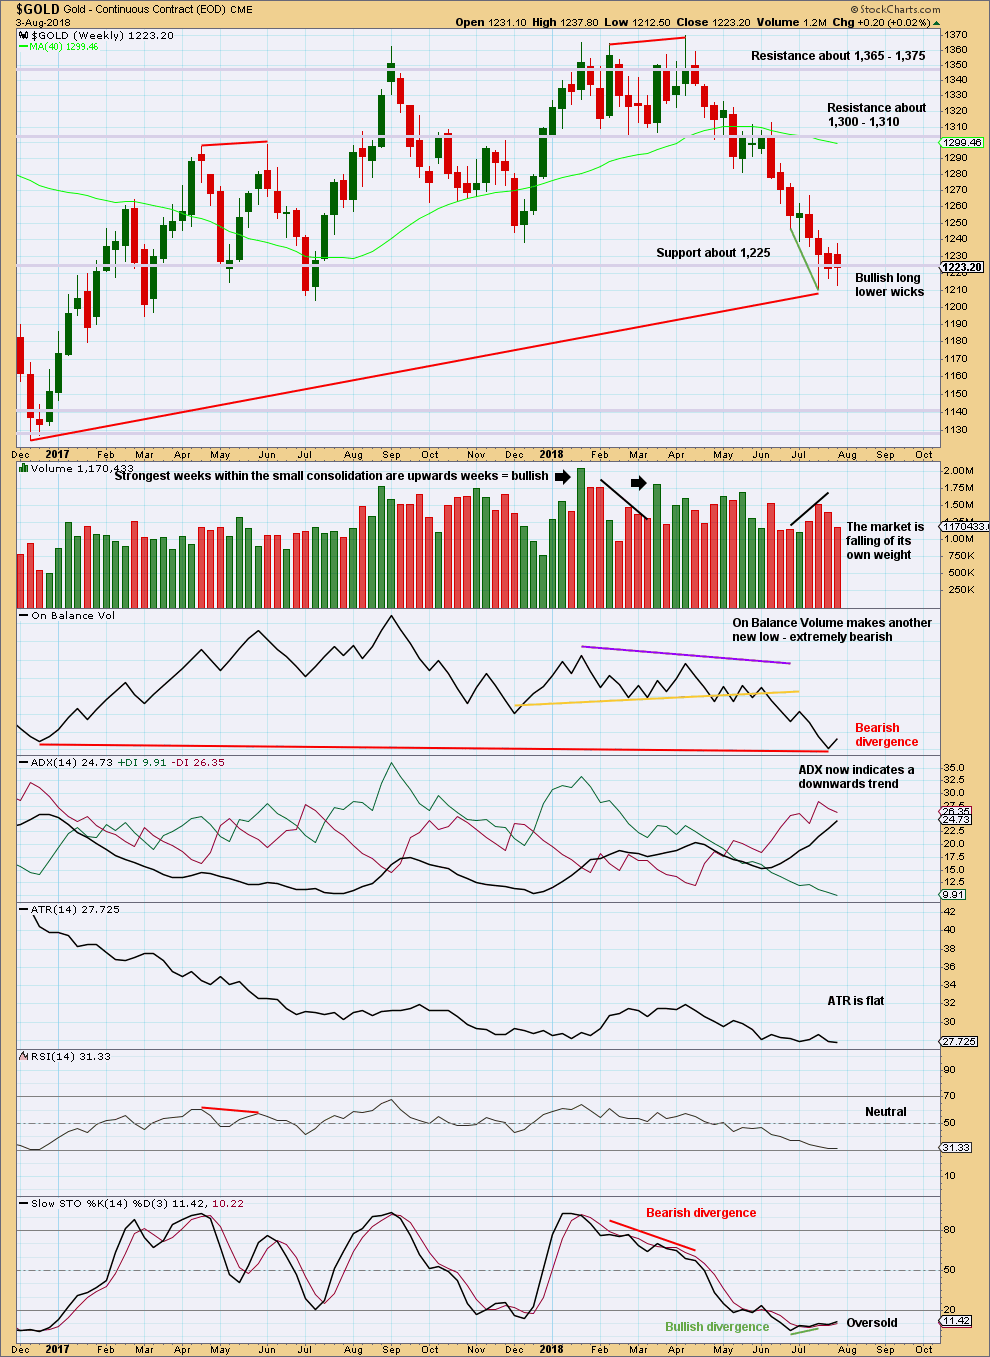
Click chart to enlarge. Chart courtesy of StockCharts.com.
At the end of this week, BarChart data has made a new low but StockCharts data has not.
The long term picture for this chart is bearish due to the long term bearish divergence between price and On Balance Volume. The short term is bullish due to long lower candlestick wicks and single short term divergence between price and Stochastics at last lows.
DAILY CHART
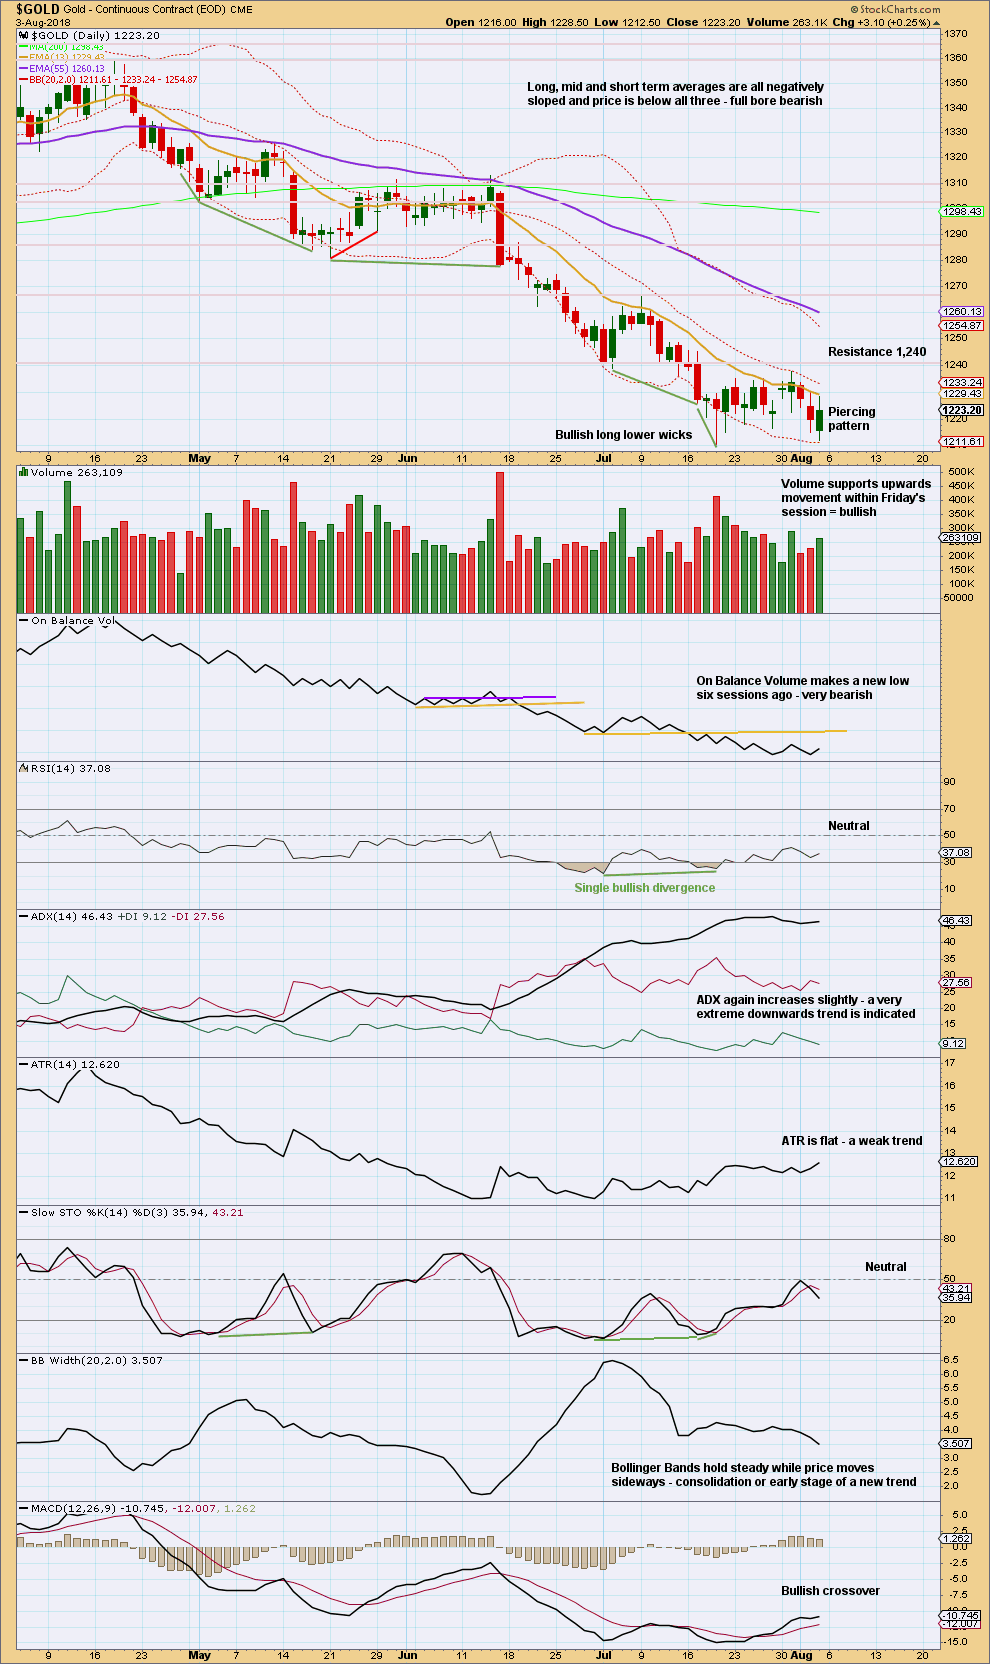
Click chart to enlarge. Chart courtesy of StockCharts.com.
While yesterday it looked like a downwards breakout from a flag pattern may have been underway, the flag pattern is today no longer evident and a downwards breakout has not happened. Friday’s session has closed back into what would be a flag pattern, finding no resistance at the lower edge. That does not look right for a downwards breakout.
Friday’s candlestick is fairly bullish.
GDX WEEKLY CHART
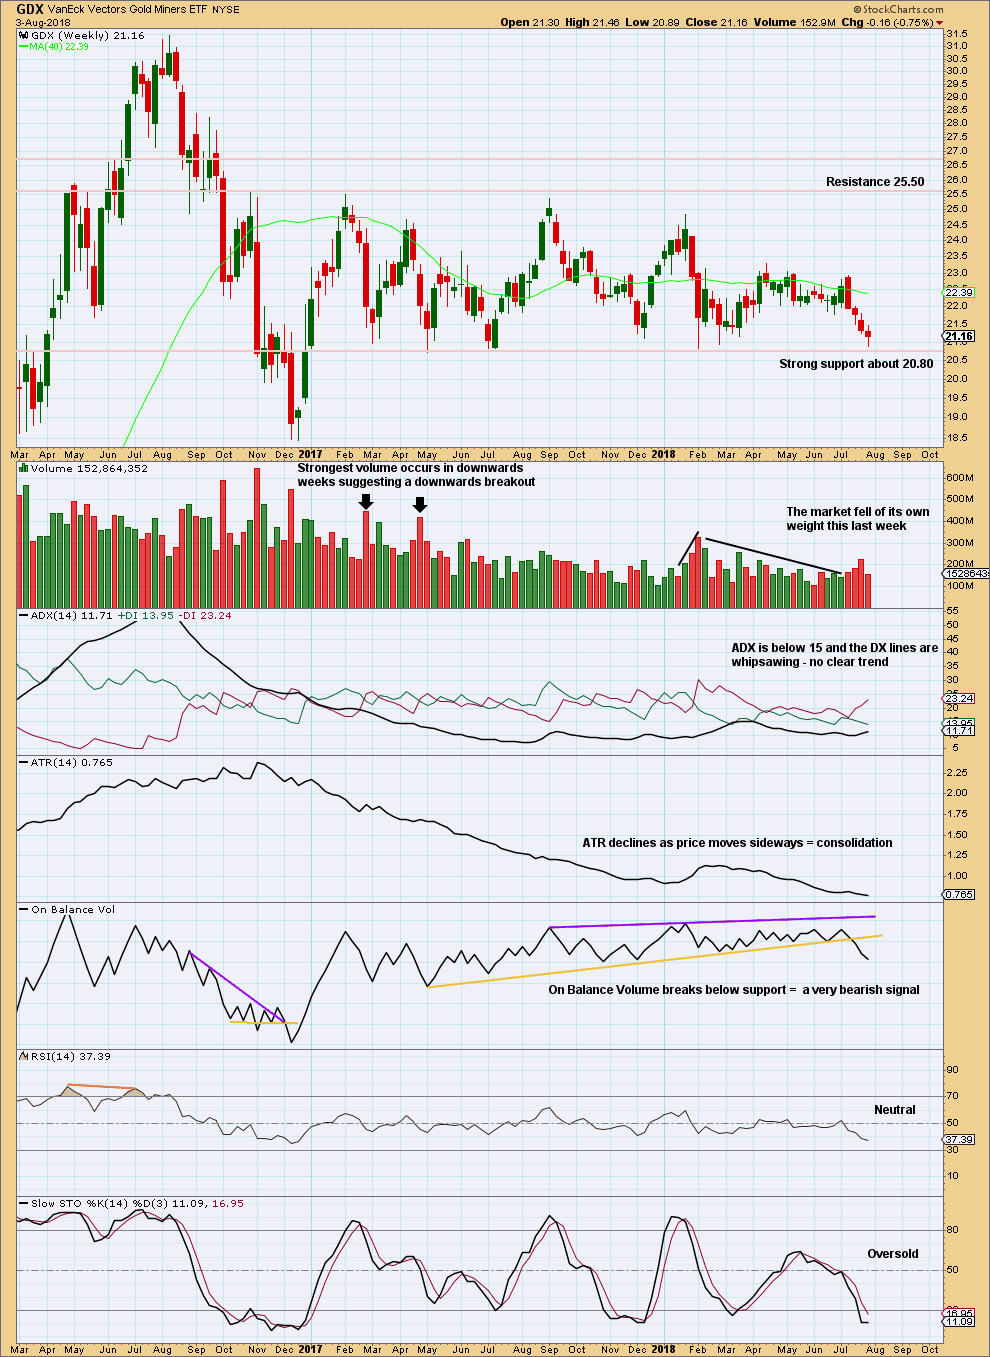
Click chart to enlarge. Chart courtesy of StockCharts.com.
GDX has been range bounce since January 2017. This is a very long sideways consolidation. The longer it continues, the more sustained the eventual breakout will be. Volume suggests the breakout may more likely be downwards.
Support about 20.80 has been tested about eight times and so far has held. The more often a support area is tested and holds, the more technical significance it has.
Price is now almost at support about 20.80. Stochastics is now oversold. Normally, it would be reasonable to expect that downwards movement may end here and an upwards swing may develop. But the very bearish signal from On Balance Volume suggests a downwards breakout may be about to happen.
A downwards breakout would require a close below support. If it has support from volume, it would be very bearish; but that is not necessary for a downwards breakout, because the market may fall of its own weight.
GDX DAILY CHART
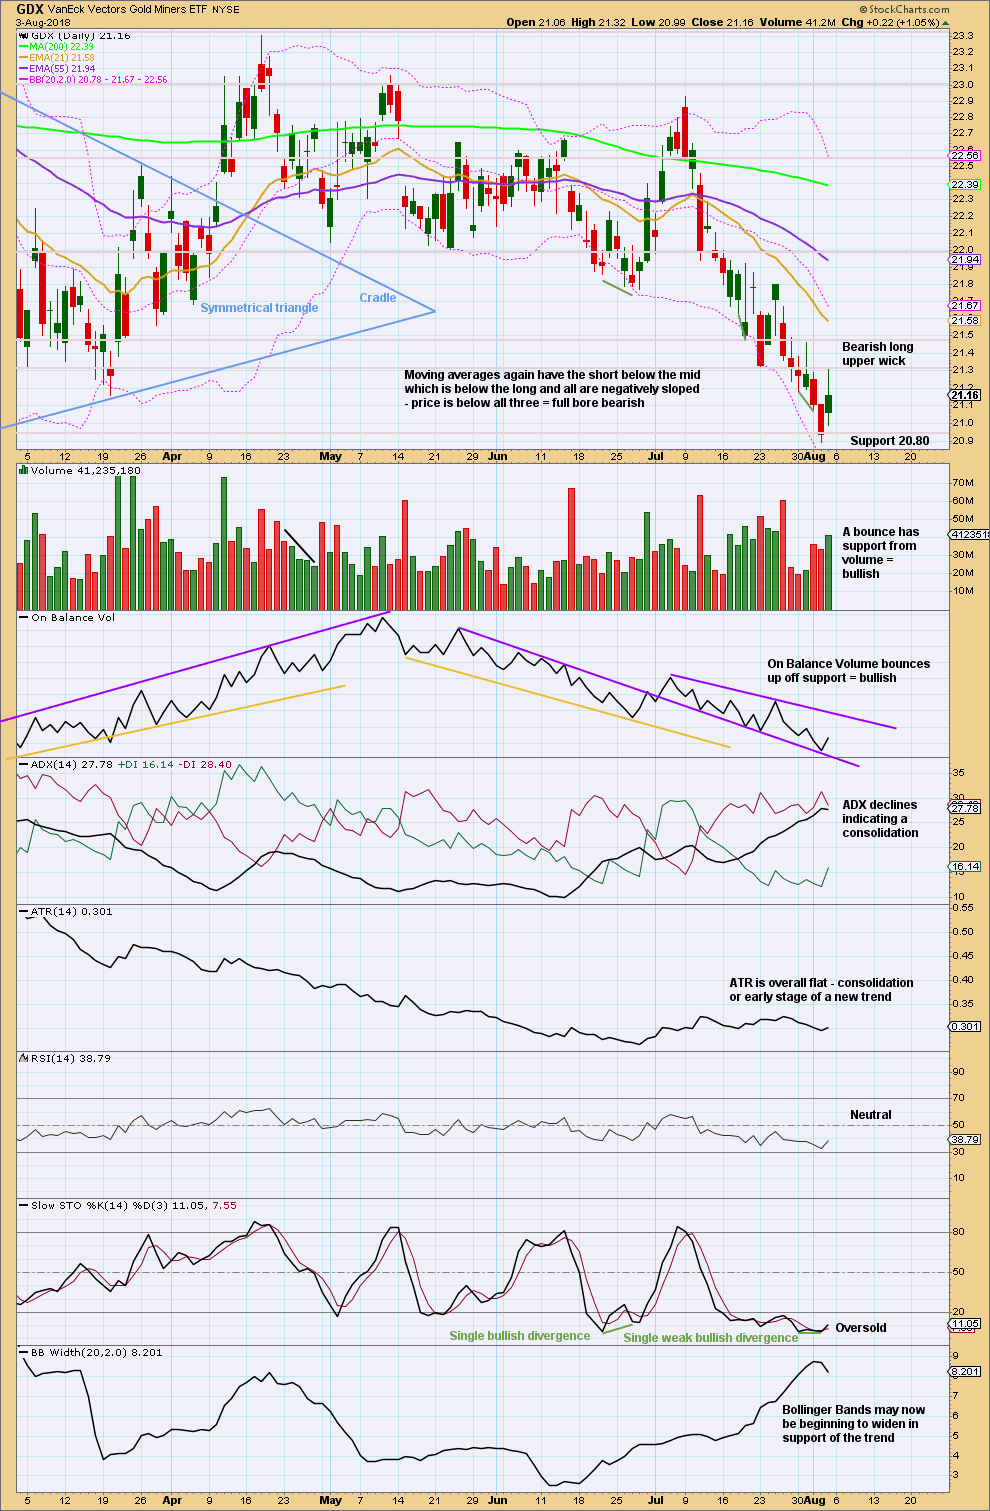
Click chart to enlarge. Chart courtesy of StockCharts.com.
Price is now at very strong support. In the first instance, at least expect some bounce here to relieve oversold conditions. Thereafter, look out for a possible downwards breakout.
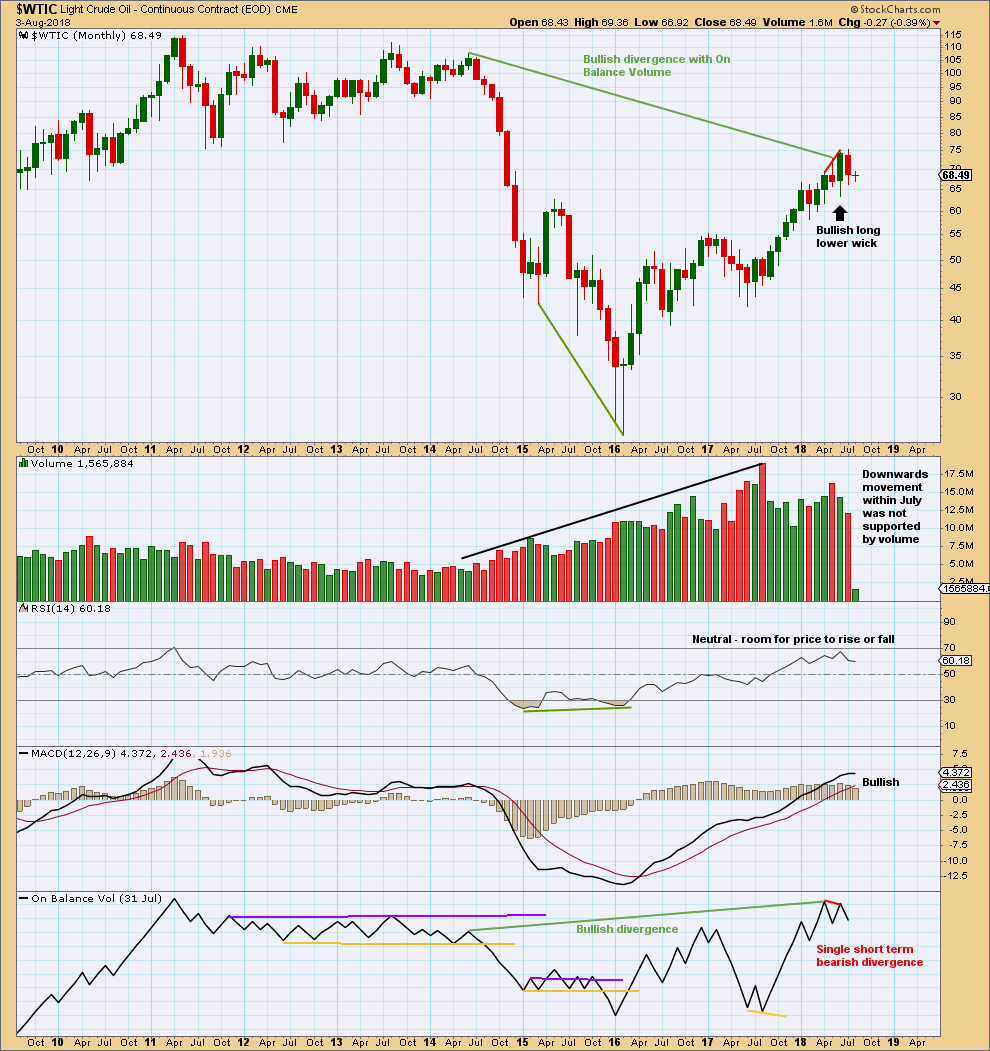
US OIL
A bounce was expected for the very short term. An outside week closes as a doji. Price mostly moved sideways.
Summary: This downwards swing may now continue to about 61.22. For the very short term, look out for a bounce to end at least above 70.17, and possibly about 72.12.
A deeper and longer lasting consolidation may be underway, which may last about 13 to 21 weeks in total. It should remain above 55.24, and the target is about 61.12. The consolidation will not move in a straight line; it may swing from resistance to support and back again in large swings. Once resistance and support are identified, then a swing trading system may be employed by more experienced traders. Support may now be about 63.0 and resistance may be about 75.25.
Always practice good risk management as the most important aspect of trading. Always trade with stops and invest only 1-5% of equity on any one trade. Failure to manage risk is the most common mistake new traders make.
MAIN WAVE COUNT
MONTHLY CHART
Click chart to enlarge.
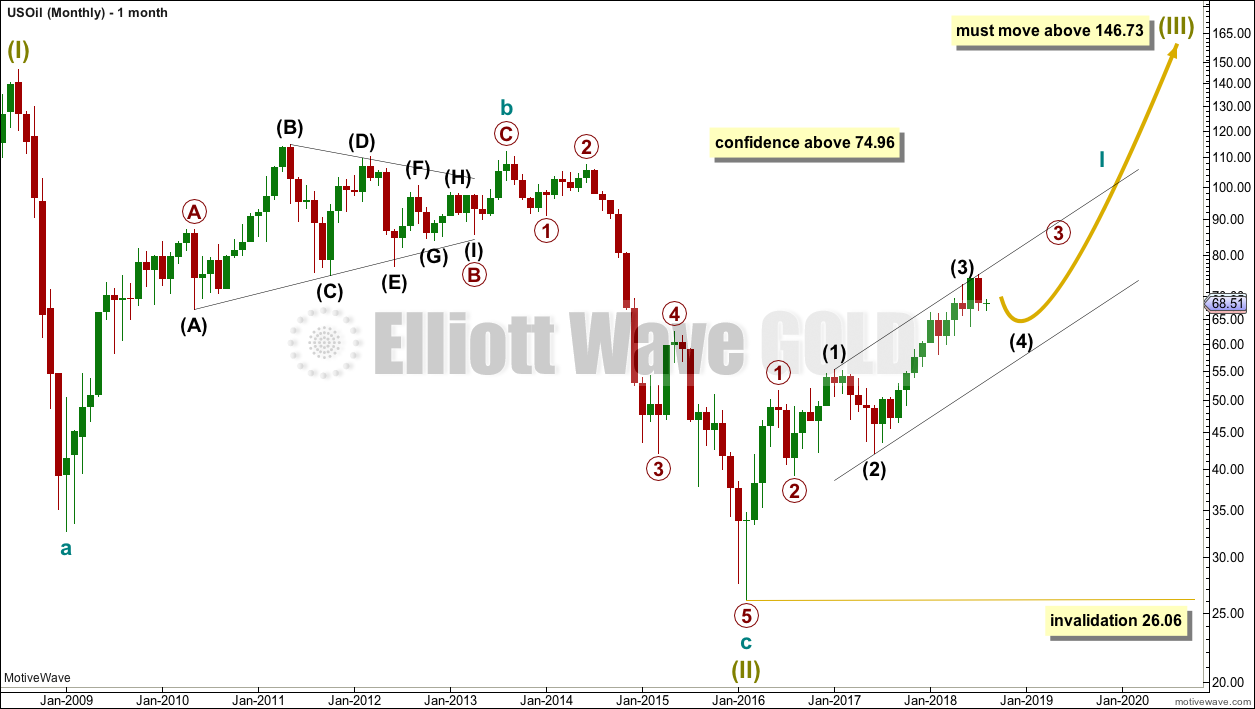
The bear market for US Oil looks to be over and a new bull market looks to be in its very early stages. The prior bearish wave count has been invalidated, leaving only this very bullish wave count.
A huge zigzag down to the last low may be complete and is labelled here Super Cycle wave (II).
Cycle wave b must be seen as complete in August 2013 for this wave count to work. It cannot be seen as complete at the prior major swing high in May 2011.
Cycle wave b is seen as a zigzag, and within it primary wave B is seen as a running contracting triangle. These are fairly common structures, although nine wave triangles are uncommon. All subdivisions fit.
Primary wave C moves beyond the end of primary wave A, so it avoids a truncation. But it does not have to move above the price territory of primary wave B to avoid a truncation, which is an important distinction.
If cycle wave b begins there, then cycle wave c may be seen as a complete five wave impulse.
Super Cycle wave (III) must move beyond the end of Super Cycle wave (I). It must move far enough above that point to allow room for a subsequent Super Cycle wave (IV) to unfold and remain above Super Cycle wave (I) price territory.
Cycle wave I may be incomplete. It may be unfolding as an impulse and may have now moved through the middle portion. Commodities have a tendency to exhibit swift strong fifth waves, and this tendency is especially prevalent for third wave impulses. Intermediate wave (5) to end primary wave 3 may be very swift and strong, ending with a blow off top.
When cycle wave I is complete, then cycle wave II may be a deep correction that may not move beyond the start of cycle wave I below 26.06.
Data from FXCM for USOil does not go back to the beginning of Super Cycle wave (I). Without an accurate known length of Super Cycle wave (I) a target cannot be calculated for Super Cycle wave (III) to end using Fibonacci ratios. The target for Super Cycle wave (III) may be calculated when cycle waves I, II, III and IV within it are complete. That cannot be done for many years.
WEEKLY CHART
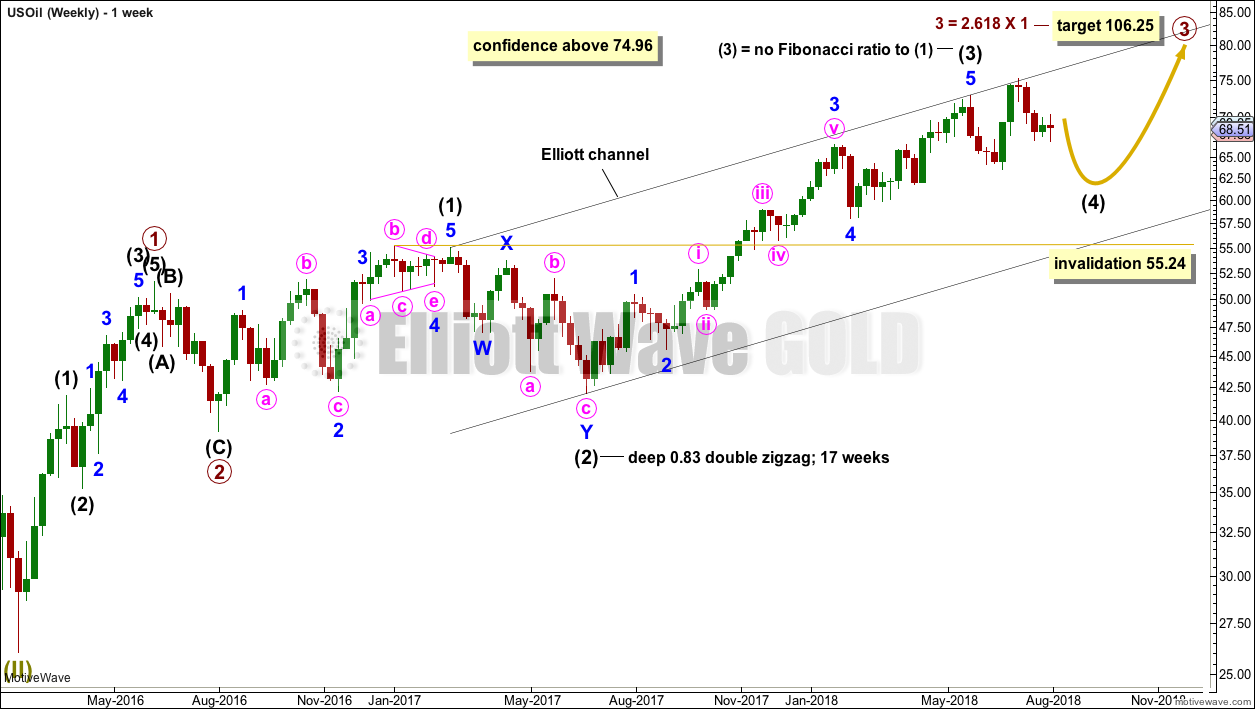
Click chart to enlarge.
Intermediate wave (3) may now be complete. There is no Fibonacci ratio between intermediate waves (1) and (3), and intermediate wave (3) is longer than 1.618 the length of intermediate wave (1).
This wave count fits with classic technical analysis at the monthly and daily chart levels.
Intermediate wave (2) was a deep double zigzag. Given the guideline of alternation, intermediate wave (4) may be expected to most likely be a shallow flat, triangle or combination. It may be about even in duration with intermediate wave (2), or it may be a little longer because triangles and combinations are more time consuming structures.
In the first instance, a Fibonacci 13 weeks may be expected for intermediate wave (4). If about that time the structure is incomplete, then the next Fibonacci number in the sequence at 21 will be expected. At this stage, it has lasted only 10 weeks.
Intermediate wave (4) may find support about the lower edge of the black Elliott channel. It may end within the price territory of the fourth wave of one lesser degree; minor wave 4 has its territory from 66.65 to 59.13.
At this stage, there are still multiple structural options for intermediate wave (4) to complete as. They will be separated out into separate charts.
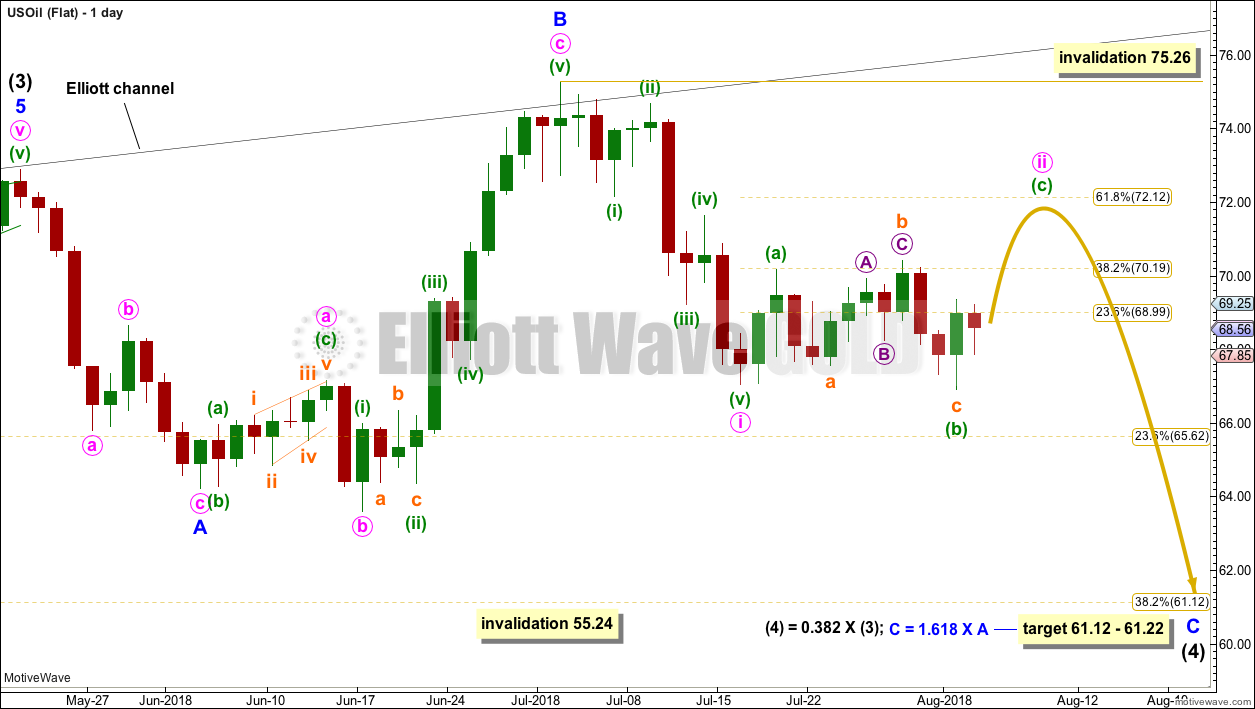
FLAT
Click chart to enlarge.
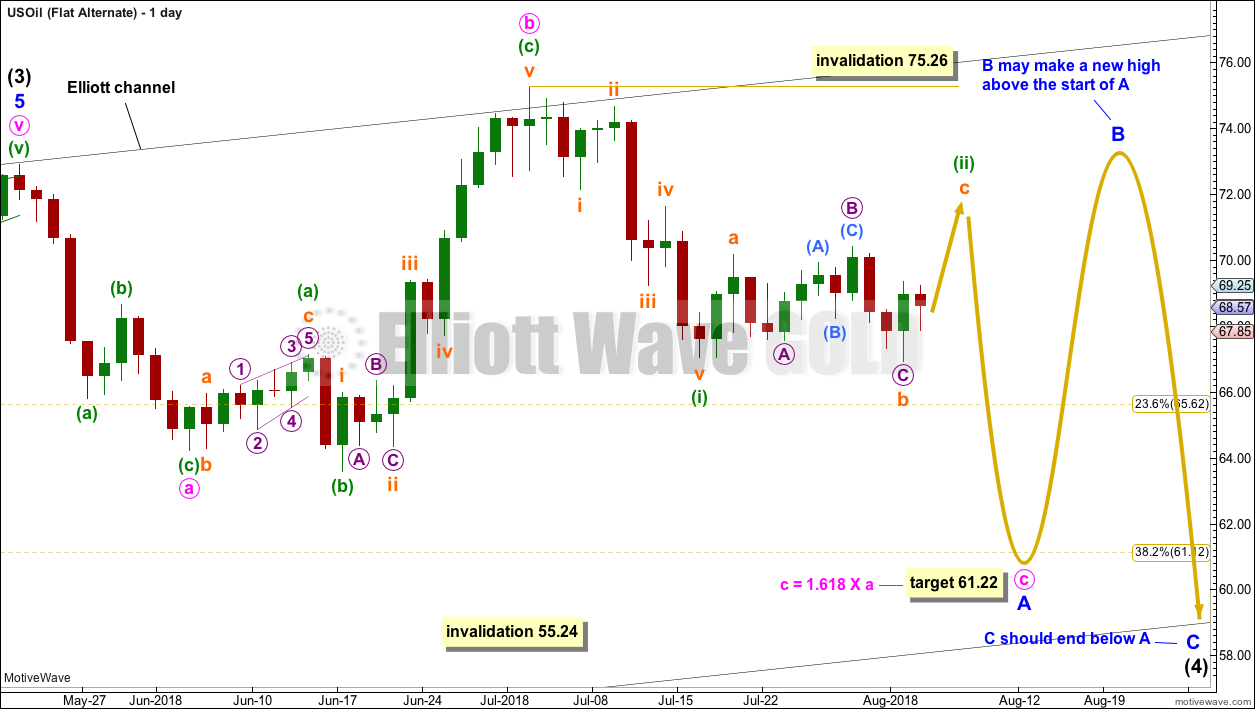
Of all the daily charts, this first chart at this stage has the best look and may have the highest probability.
Intermediate wave (4) may be unfolding as a flat correction. Within the flat correction, minor wave A may be a complete zigzag and minor wave B may be a complete expanded flat correction, a 1.27 length of minor wave A, which is within the most common range of from 1 to 1.38. An expanded flat is indicated.
Expanded flats normally see C waves move substantially beyond the end of their A waves. A target for minor wave C is calculated, which expects it to exhibit a common Fibonacci ratio to minor wave A. This target is very close to the 0.382 Fibonacci ratio of intermediate wave (3).
Minor wave C must subdivide as a five wave structure, and within it minute wave ii may not move beyond the start of minute wave i above 75.26.
At this stage, minute wave ii now looks like it may be completing as a regular flat correction. Minuette wave (c) would be most likely to make at least a slight new high above the end of minuette wave (a) at 70.17 to avoid a truncation and a very rare running flat. At about 72, minuette wave (c) would reach 1.618 the length of minuette wave (a), and minute wave ii would reach about the 0.618 Fibonacci ratio of minute wave i. If this target expectation is wrong though, it may be too high; regular flats most commonly have C waves which end only a little beyond their A waves.
When minute wave ii is complete, then minute wave iii should unfold lower.
Intermediate wave (4) may not move into intermediate wave (1) price territory below 55.24.
For the short term, all the following wave counts also expect a flat correction to complete, which may not move above 75.26 and should be followed by another wave down. The structure is the same.
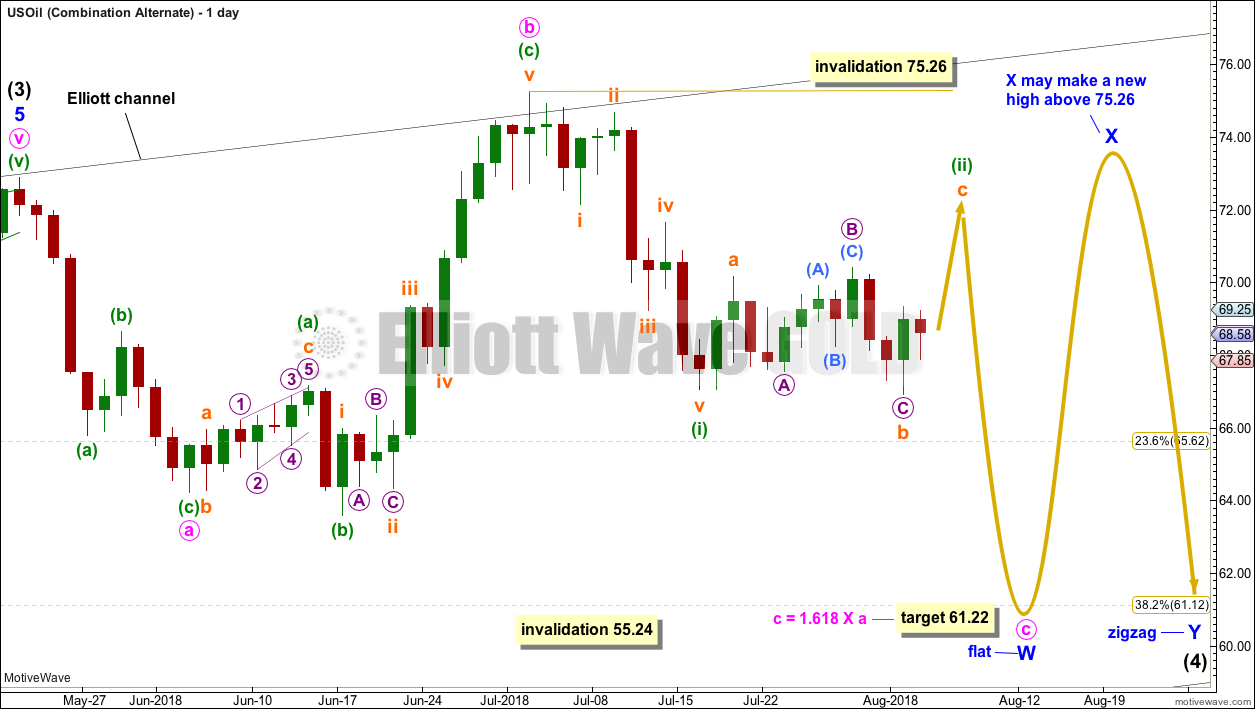
FLAT – ALTERNATE
Click chart to enlarge.
This alternate idea is identical to the first flat wave count with the exception of the degree of labelling. Here, the degree of labelling within intermediate wave (4) is moved down one degree. Minor wave A may be an incomplete flat correction.
The target and expected direction is the same. The upper invalidation point is the same for the short to mid term.
This wave count allows for intermediate wave (4) to be longer lasting.
COMBINATION
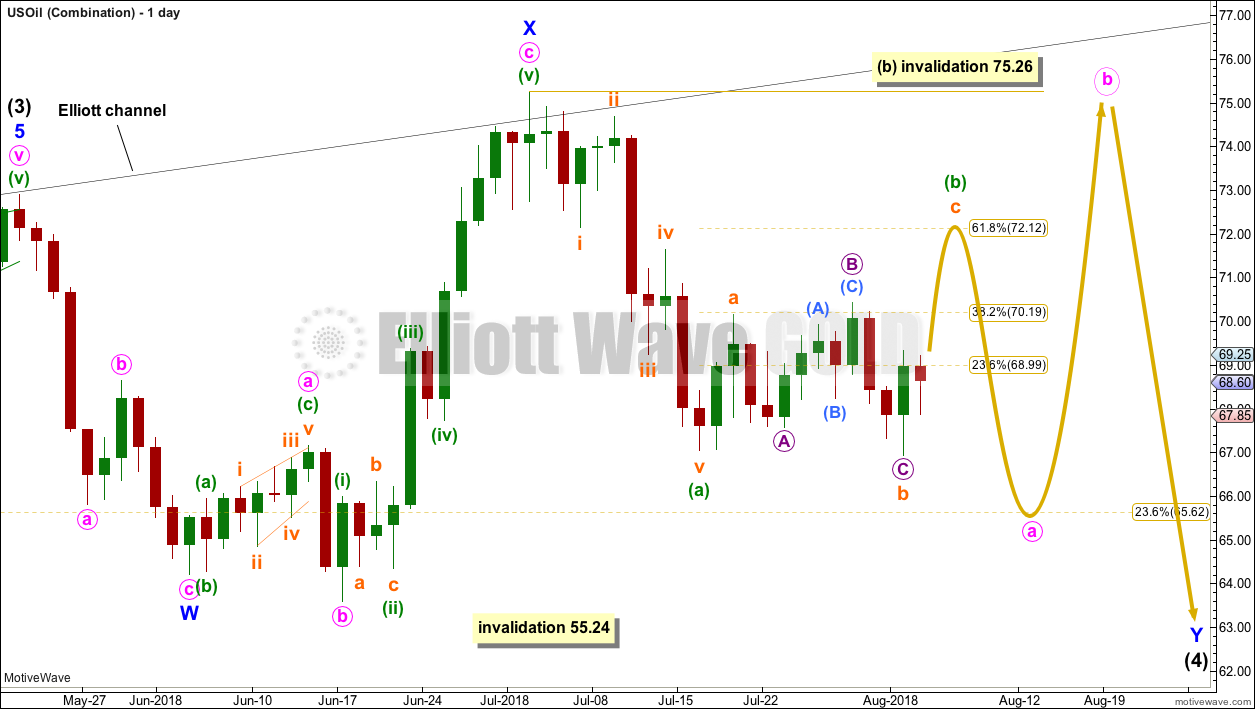
Click chart to enlarge.
Intermediate wave (4) may be unfolding as a double combination.
The first structure in the double may be a completed zigzag labelled minor wave W. The double may be joined by a three in the opposite direction, an expanded flat labelled minor wave X.
The second structure in the double may be either a flat or a triangle, with a flat correction much more likely, so that is what will be expected.
Within the flat correction of minor wave Y, minute wave a must subdivide as a three. Minute wave a may be subdividing as a zigzag, and within it minuette wave (b) may not move beyond the start of minuette wave (a) above 75.26.
Within the flat correction of minor wave Y, when minute wave a is a completed three wave structure, then minute wave b must unfold upwards and must retrace a minimum 0.9 length of minute wave a. Minute wave b at that stage may make a new high above the start of minute wave a at 75.26.
Minor wave Y would most likely end about the same level as minor wave W at 64.22, so that the whole structure takes up time and moves price sideways.
COMBINATION – ALTERNATE
Click chart to enlarge.
This alternate idea for the combination again moves the degree of labelling within intermediate wave (4) all down one degree.
The first structure in a double combination may be an incomplete flat correction labelled minor wave W.
When minor wave W is complete, then minor wave X should unfold as a three wave structure upwards, most likely a zigzag. Minor wave X has no minimum requirement nor no maximum allowable length.
Thereafter, minor wave Y would most likely be a zigzag and would most likely end about the same level as minor wave W, so that the whole structure takes up time and moves price sideways.
A double combination with this degree of labelling could take several more weeks to unfold.
TRIANGLE
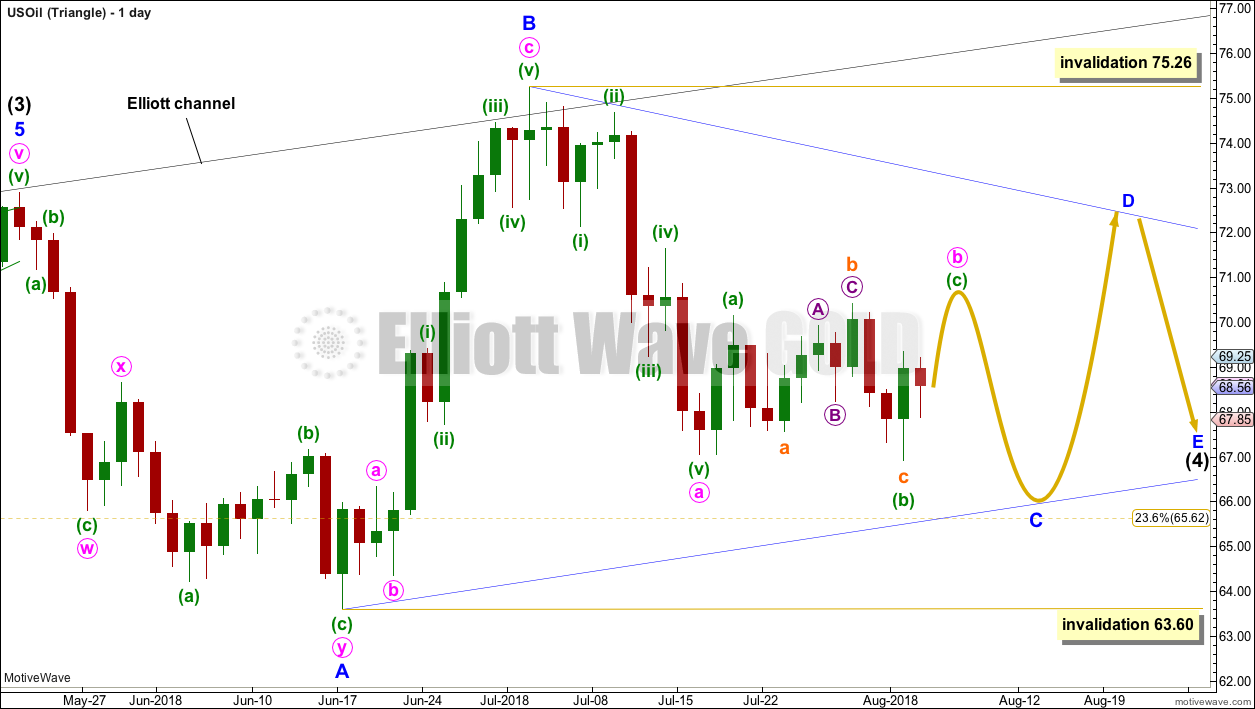
Click chart to enlarge.
Intermediate wave (4) may be unfolding as a triangle.
Within the triangle, minor wave A should be seen as over at the last low. This is problematic because it does not fit as a single zigzag. It can be seen complete as a double zigzag, but this looks forced because minute wave w does not look like a very clear three.
If minor wave A is a double zigzag, then all remaining triangle sub-waves must subdivide as single structures. All but one of them must be zigzags and one triangle sub-wave may be another type of corrective structure.
Within the triangle, minor wave C may be unfolding as a zigzag; within it, minute wave b may not move beyond the start of minute wave a above 75.26.
Minor wave C may not move beyond the end of minor wave A below 63.60.
A triangle may take several more weeks to complete. They are often very time consuming structures.
TECHNICAL ANALYSIS
MONTHLY CHART
Click chart to enlarge. Chart courtesy of StockCharts.com.
The short term volume profile is bearish: the strongest month in the last few months was the downwards month of May (where the balance of volume was down) and now June shows a decline in volume, so volume has not supported upwards movement here.
July saw another red monthly candlestick with the balance of volume downwards, but the market fell of its own weight; it was not supported by volume. This is not necessarily bullish, but it does point to a consolidation as somewhat more likely here.
For the short term, On Balance Volume is also slightly bearish. This supports the idea that price may be within a correction and not necessarily a continuation of the larger upwards trend.
However, it is entirely possible that this situation could reverse and volume could start to support upwards movement, as has happened back in January 2018.
The larger trend is upwards.
DAILY CHART
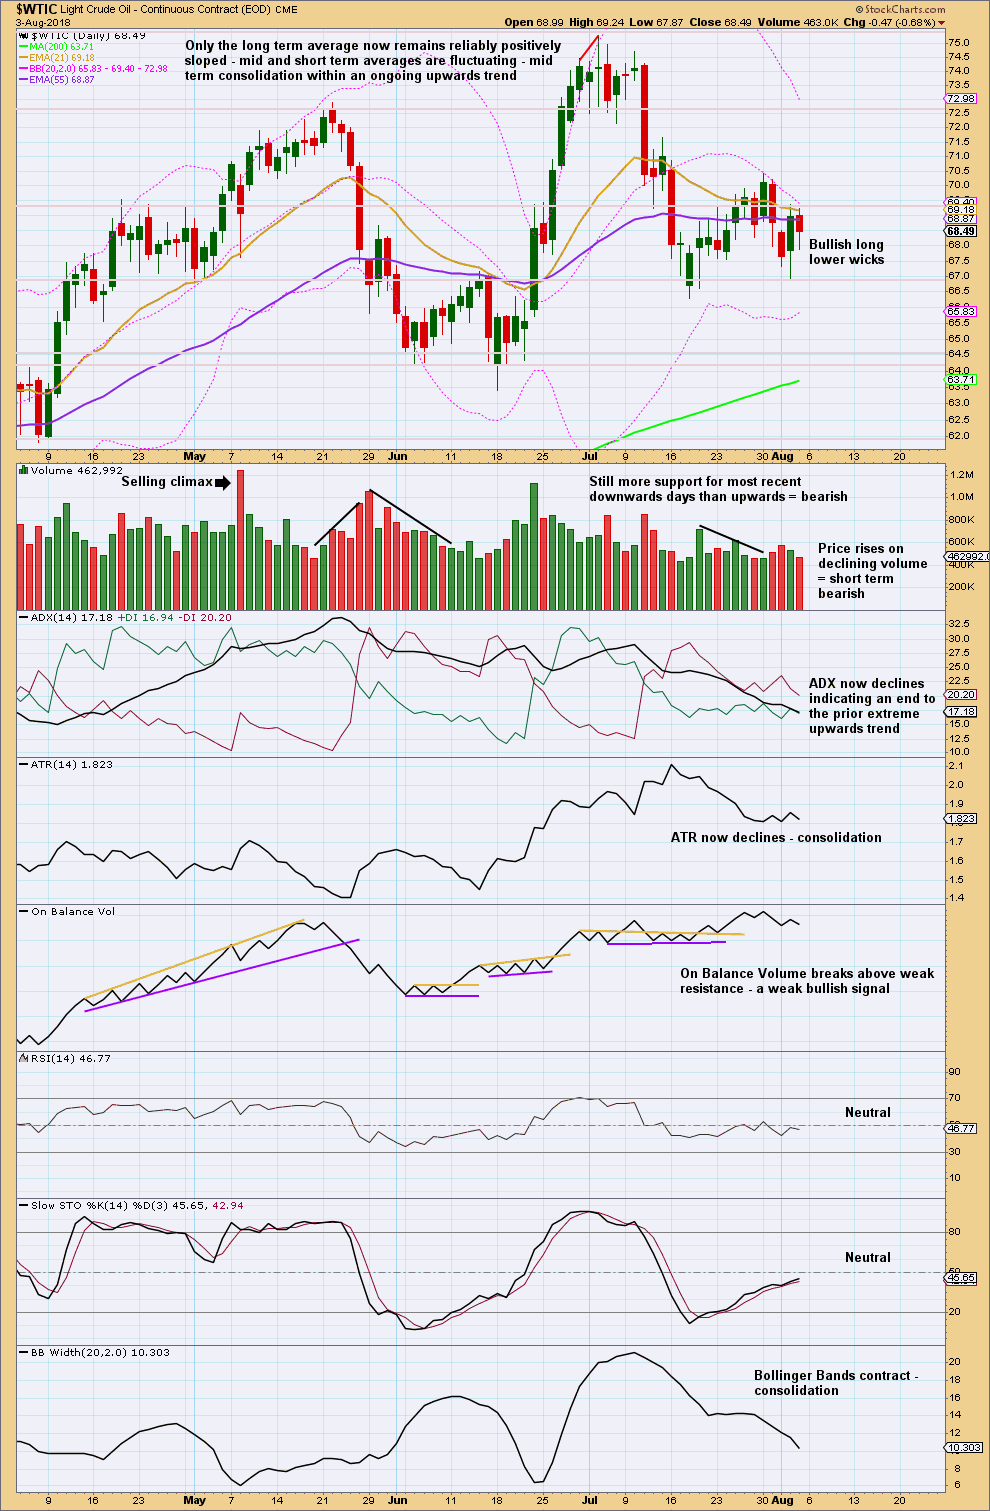
Click chart to enlarge. Chart courtesy of StockCharts.com.
ADX now indicates no clear trend; the market may be consolidating.
Expect swings from support to resistance and back again, using Stochastics to indicate when each swing may end.
At this stage, it looks like a downwards swing may have ended about support at 66.30 and an upwards swing may be underway. Stochastics reached oversold and has now returned to neutral.
It is also possible that price may continue lower to final support about 64.15, and Stochastics may return to oversold and may exhibit divergence with price before the downwards swing is complete.
Each swing rarely moves in a straight line when price consolidates. Consolidations are characterised by choppy overlapping price movement.
Hi Lara, Given the drop in USOIL in the last 24 hours, it looks like Minute (b) of the Main count (Flat) may not be complete. Would the wave count in this chart be a viable one for the recent price action?
Yes, that’s viable. But I think I’d rather see the correction over.
Downwards movement of the 8th of August had good support from volume. That doesn’t look like a B wave.
For those who are longer term oriented (weekly & monthly) in their investments / trades, I once again recommend viewing the Ciovacco Capital video from this past week. He points out a long term indicator that has just issued a “new bull market” signal. Ciovacco does not make predictions. But he looks at the evidence and determines if it is indicating the probability of “good things happening” in the equity markets. If his conclusions are correct, he not only corroborates Lara’s long term target of 3600 on the SPX, but one could look for something much higher in the next 5, 10 and 15 years. I propose the very real possibility of 5,000 to 10,000 on the SPX.
Believe it or not, you heard it here first!
An excellent recommendation Rodney. I put a lot of value on Chris Ciovacco’s analysis. It’s solid and highly professional technical analysis.
I have only a very few links on my sidebar to other resources. Ciovacco is right up there at the top for a reason; I rate it very highly.
Impressive web site. I’m going to spend some time looking over his information. I guess you like the idea of a I II 1 2 count. (note chart) Possible, in studying Bill Williams if wave III is the extended wave than the AO peaks in the 3rd wave. Per my chart 3 of (3) might have ended on the peak of the RSI. The pink vertical line is 140 bars from point 0. I look for a trend to complete in 120 to 160 bars.