
Last week’s analysis expected more downwards movement to end before 14.533, about which a bounce or consolidation was expected. Price moved lower as expected, with the expected limit at 14.533 slightly exceeded before a small bounce.
Summary: A classic downwards breakout from a very long held consolidation still looks like it has occurred, and now a backtest of resistance at prior support may have completed.
The trend is down. Bounces and consolidations may be used as opportunities to join the trend.
Classic analysis strongly supports the triangle Elliott wave count. Expect a consolidation here to last about 5 to 8 weeks, and then to be followed by a continuation of a downwards trend.
Always trade with stops, and invest only 1-5% of equity on any one trade.
Last monthly charts can be viewed here.
New updates to this analysis are in bold.
ELLIOTT WAVE COUNTS
WEEKLY CHART – TRIANGLE
Click chart to enlarge.
This first wave count has good support from classic technical analysis, so it will be favoured. This wave count looks highly likely.
The first wave count expects that the bear market, which began from the April 2011 high, is incomplete.
Cycle wave a is seen as a five wave impulse for this main wave count. There are multiple corrective structures possible still for cycle wave b.
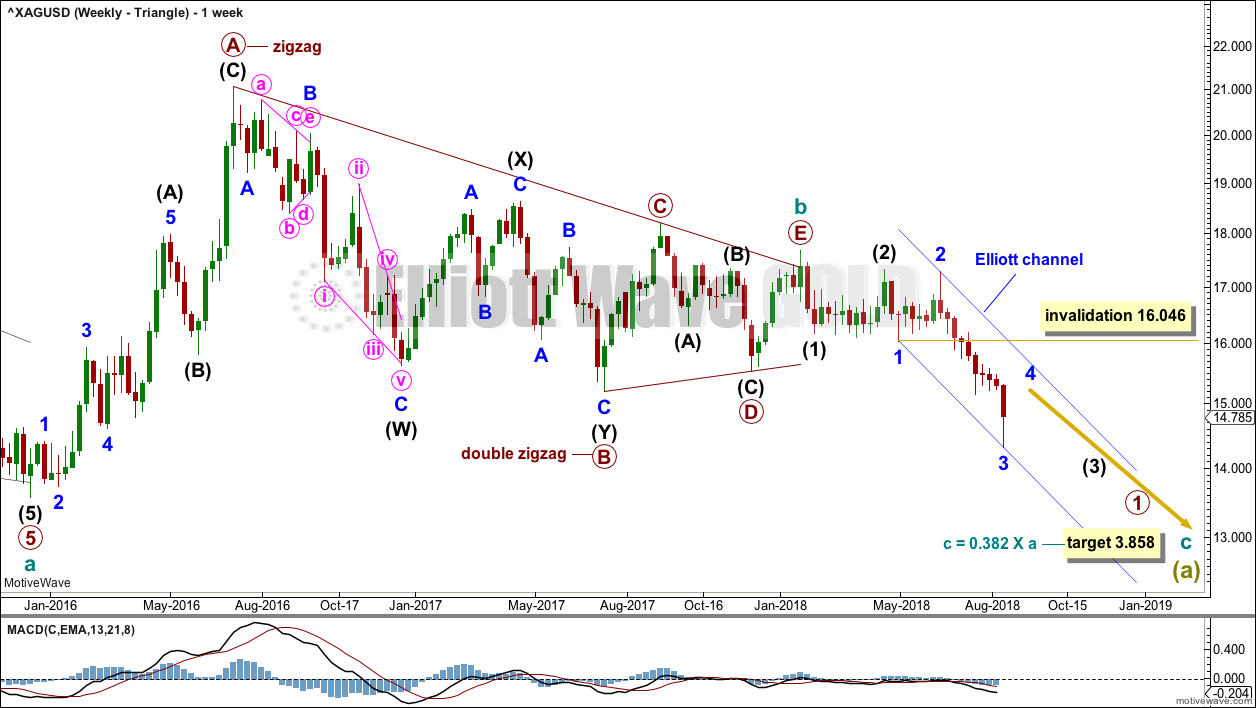
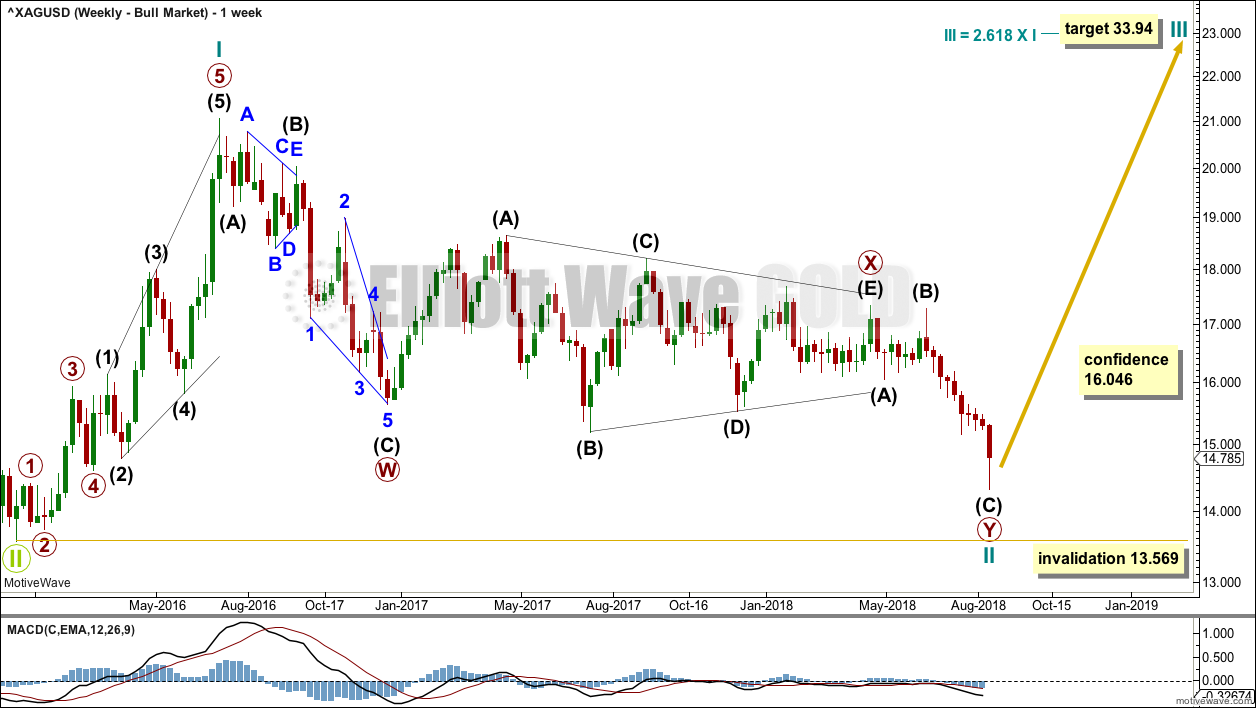
This first weekly chart sees cycle wave b as a now possibly complete regular contracting triangle.
Primary wave E of the triangle may have ended with an overshoot of the A-C trend line.
So far, within the new downwards trend, there may now be two overlapping first and second waves and a third wave at two degrees may be unfolding lower. Minor wave 3 may now be over with a selling climax on Wednesday. This is typical behaviour of commodities, and last week’s analysis noted to look out for it.
Minor wave 4 may now unfold sideways. Minor wave 4 may not move into minor wave 1 price territory above 16.046.
Draw an Elliott channel about downwards movement as shown. Copy it over to the daily chart. Minor wave 4 may find resistance about the upper edge, if it gets that high.
DAILY CHART – TRIANGLE
Click chart to enlarge.
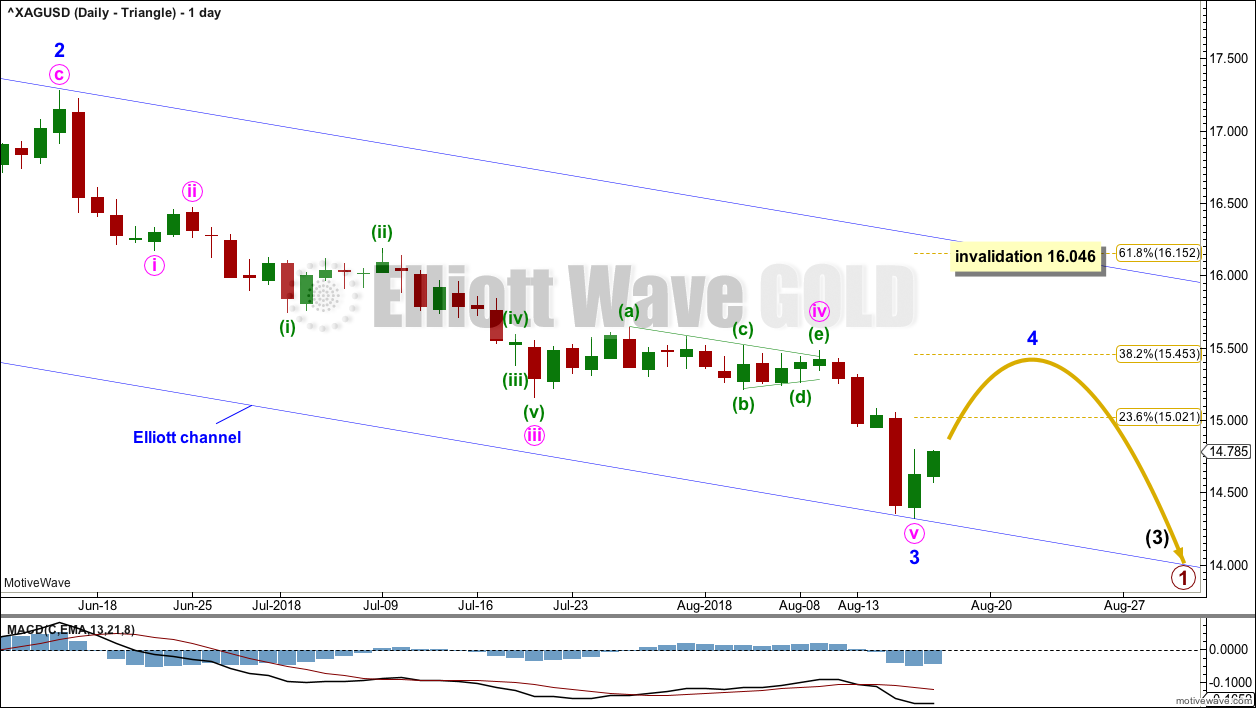
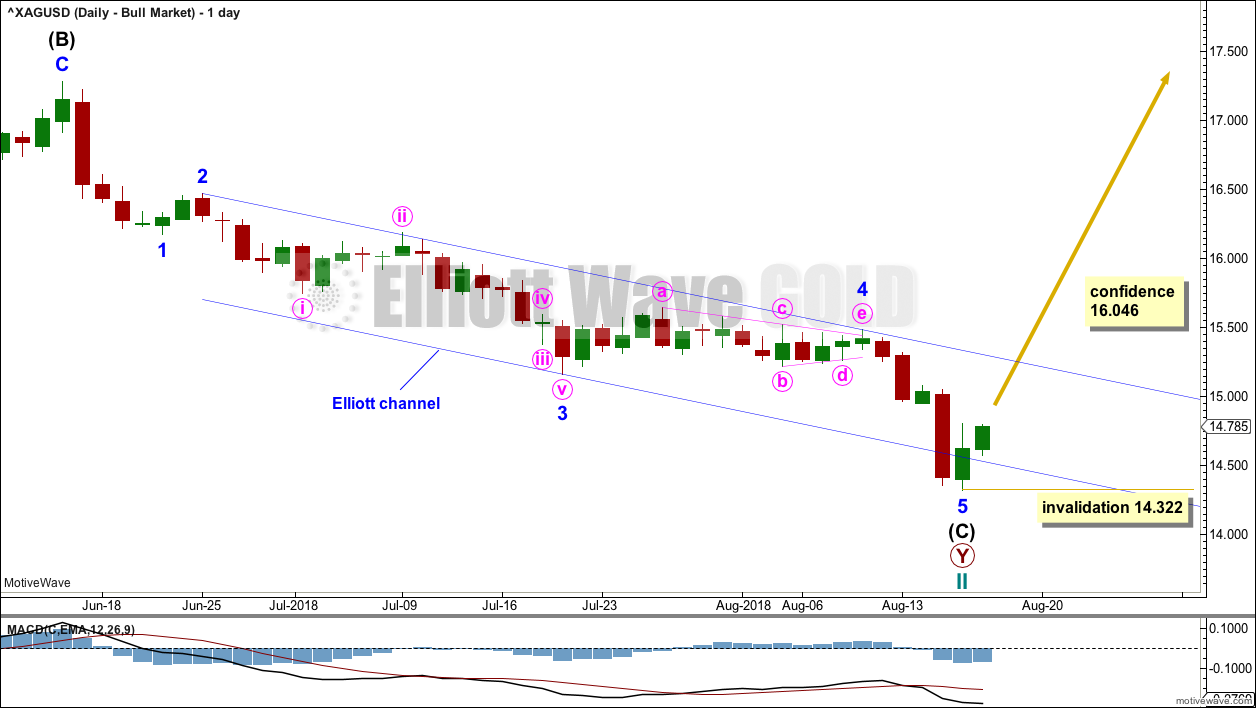
Intermediate wave (3) may only subdivide as an impulse. Within intermediate wave (3), minor waves 1, and now 3 may now be complete.
The structure of minor wave 3 is relabelled, so that it meets all Elliott wave rules.
Minor wave 2 was a very deep 0.96 zigzag lasting 32 days (6 weeks). Given the guideline of alternation, minor wave 4 may be expected to most likely be a shallow sideways flat, triangle or combination. The 0.382 Fibonacci ratio would be a reasonable target.
Minor wave 4 may last anywhere from 3 to 13 weeks to show reasonable proportion. However, Silver does not always exhibit good proportion.
WEEKLY CHART – COMBINATION
Click chart to enlarge.
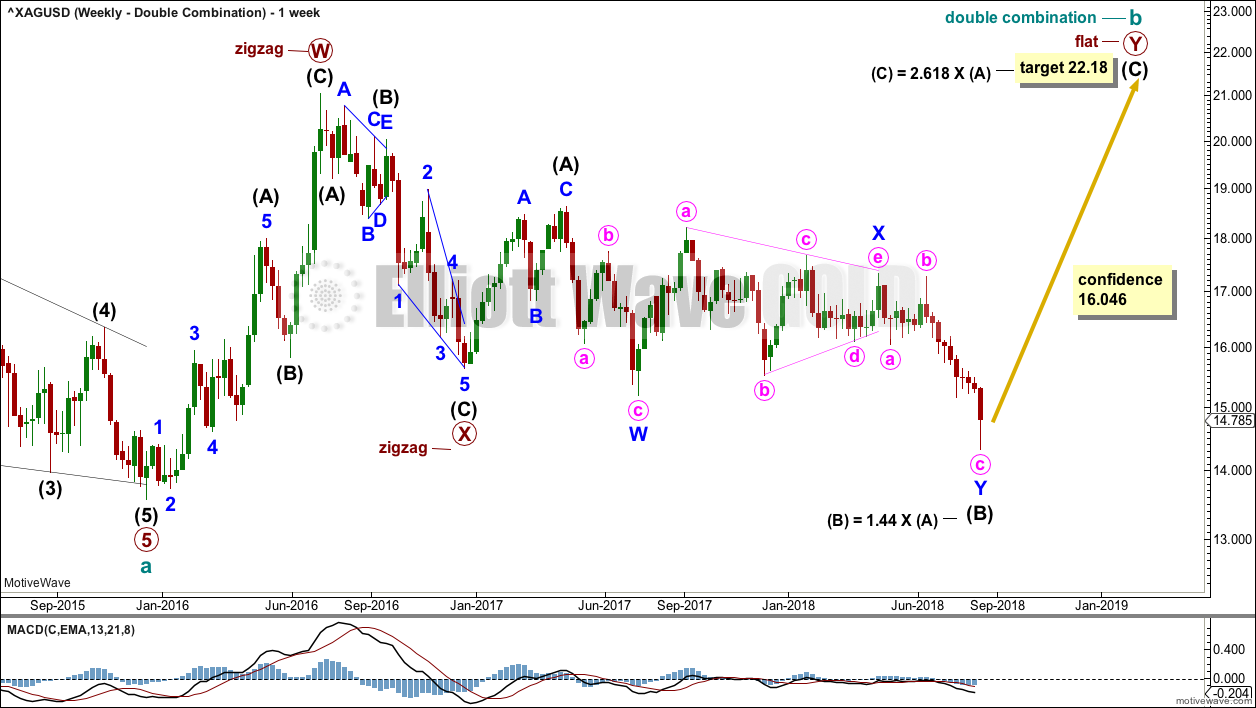
Cycle wave b may still be completing as a double combination: zigzag – X – flat. The second structure, a flat correction for primary wave Y, may be underway.
Within a flat correction, intermediate wave (B) has now met and passed the minimum 0.9 length of intermediate wave (A) at 15.938.
The purpose of combinations is to take up time and move price sideways. To achieve this purpose the second structure in the double normally ends about the same level as the first.
Intermediate wave (B) may now be over. Intermediate wave (C) may now begin as a large five wave motive structure higher. A target is calculated for intermediate wave (C) that expects it to end reasonably close to the 21.062, so that primary wave Y ends about the same level as primary wave W.
DAILY CHART – COMBINATION
Click chart to enlarge.
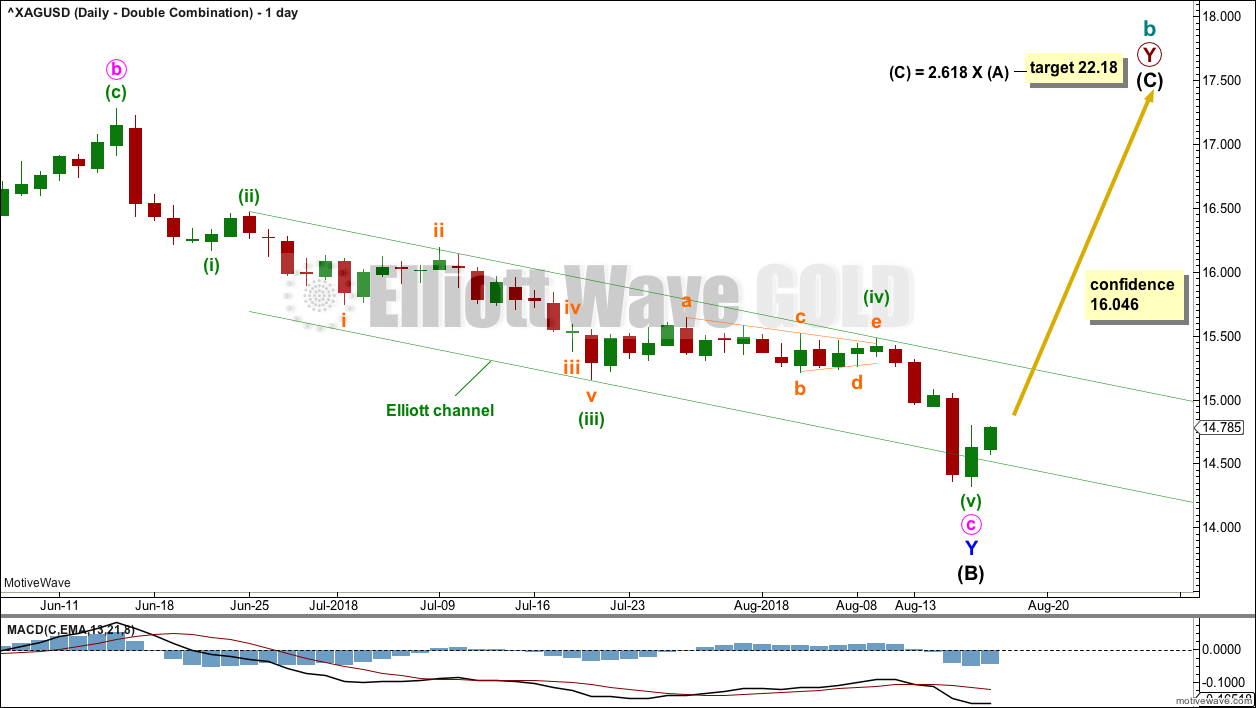
Within the zigzag of minor wave Y, minute wave c may now be a complete five wave structure.
A new high above 16.046 would invalidate the first triangle wave count and offer some confidence in this combination wave count. At that stage, the downwards breakout may be considered false and a new upwards wave may be underway. This wave count does not have good support from classic technical analysis.
WEEKLY CHART – BULL WAVE COUNT
Click chart to enlarge.
This alternate wave count looks at the possibility that the bear market may be over for Silver and a new bull market may have begun.
Cycle wave II may be a complete double zigzag. Cycle wave II would be very deep at 0.90 of cycle wave I. This is typical behaviour for the first second wave correction within a new trend for commodities.
If it continues any further, then cycle wave II may not move beyond the start of cycle wave I below 13.569.
DAILY CHART – BULL WAVE COUNT
Click chart to enlarge.
A five wave impulse for intermediate wave (C) may be complete for this wave count.
This wave count does not have support from classic technical analysis. It is judged to have a very low probability.
TECHNICAL ANALYSIS
WEEKLY CHART
Click chart to enlarge. Chart courtesy of StockCharts.com.
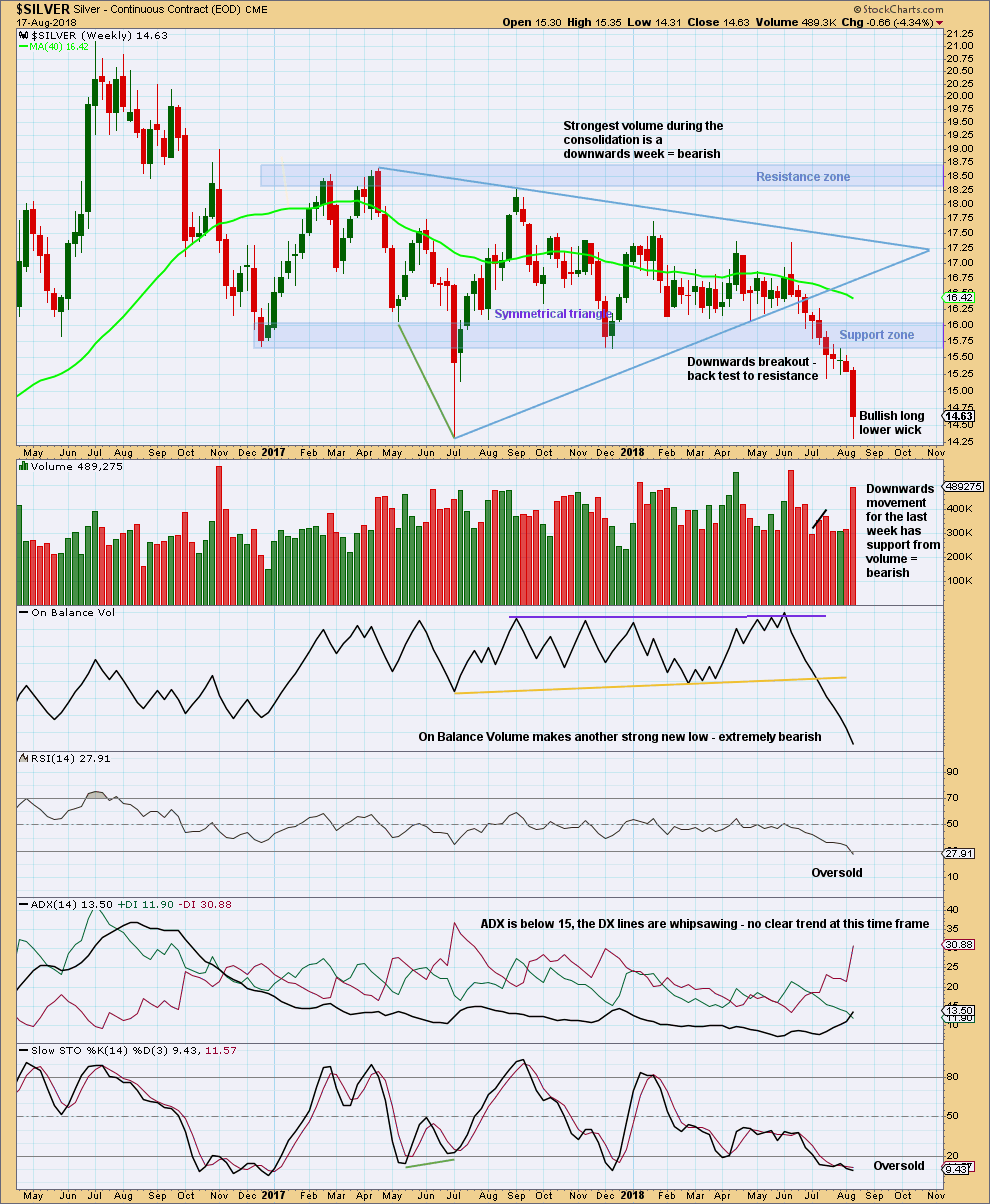
Silver has seen a classic downwards breakout from the shaded support zone, which then provided resistance for a small back test. It is possible that another back test may come.
The strongest signal that ADX can give is when it rises from low numbers (below 15) and from below both directional lines. Once it reaches 15 and continues to rise, then a trend in the very early stages is indicated. That may come soon.
A long lower wick this week and RSI now oversold suggest a small bounce or consolidation may unfold to relieve extreme conditions, before downwards movement continues.
A target from the breakout of the symmetrical triangle is about 12.08.
DAILY CHART
Click chart to enlarge. Chart courtesy of StockCharts.com.
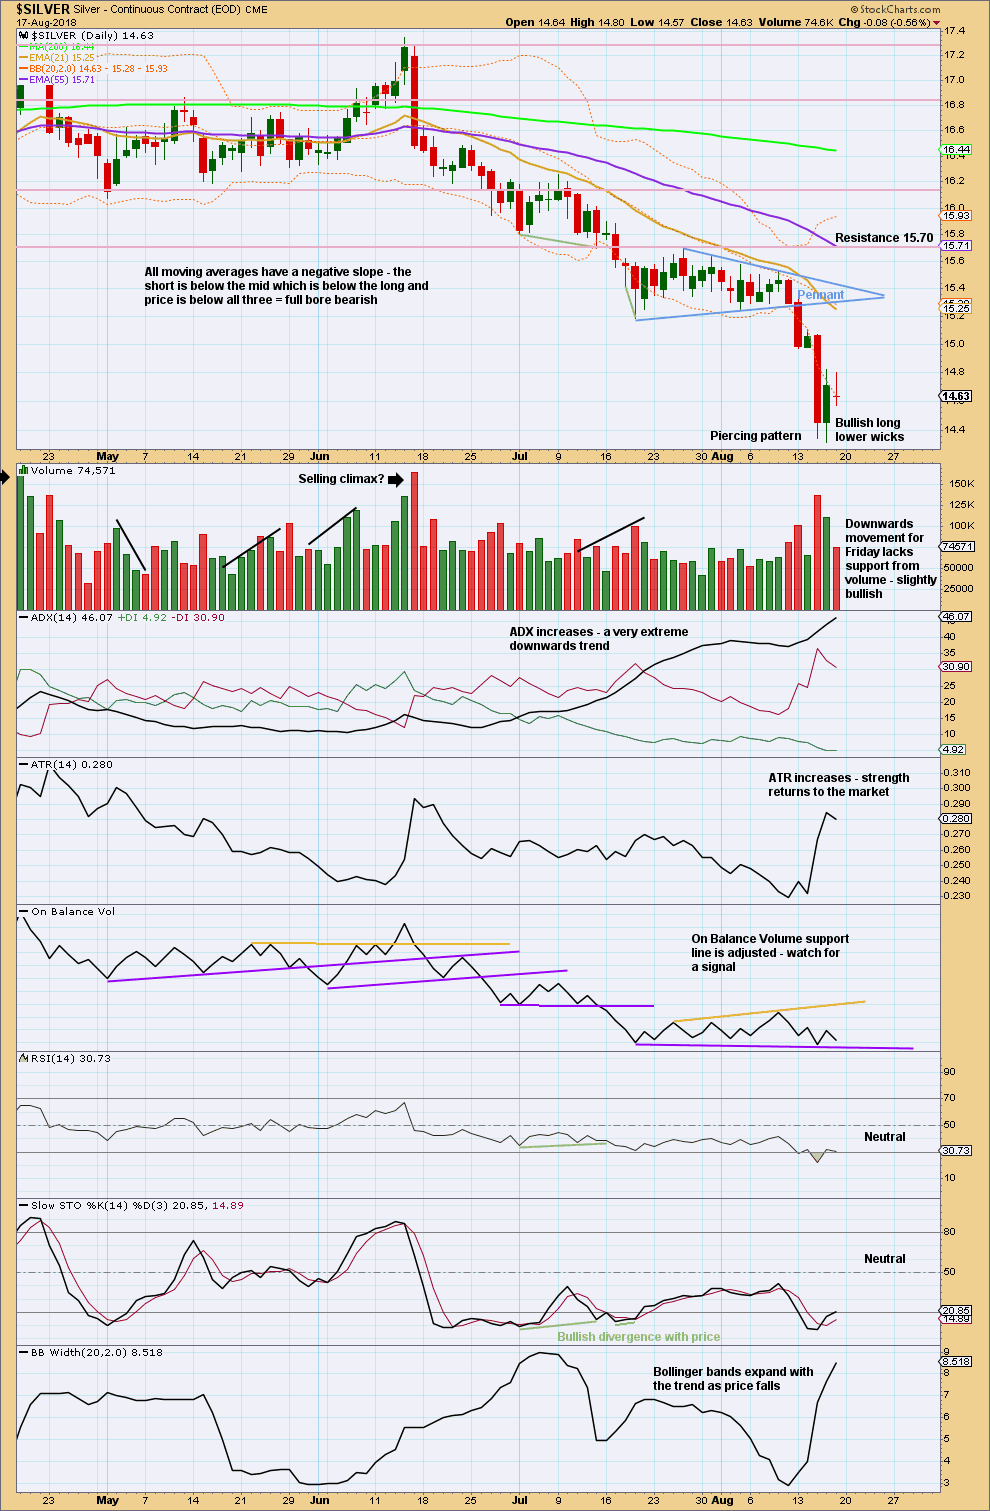
A target calculated from the flag pole preceding the pennant pattern would be about 14.18. This is now very close by, but it may not be quite reached.
Another consolidation may begin about here: the short term volume profile is slightly bullish, Thursday completed a bullish Piercing pattern, and RSI reached oversold.
If On Balance Volume breaks below support, then the expectation would be for the bounce or consolidation to be over and the downwards trend may then have resumed. Watch On Balance Volume closely next week, but do be aware that it does not always work very well with trend lines for Silver.
Published @ 12:25 a.m. EST on 19th August, 2018.