
Downwards movement was expected for the last week, which is exactly what has happened.
Summary: This consolidation may end next week. It should remain above 55.24. The target is about 61.22 to 61.12.
After one more low below 64.22, look for a candlestick reversal pattern to indicate the consolidation is over. The upwards trend may then resume.
Always practice good risk management as the most important aspect of trading. Always trade with stops and invest only 1-5% of equity on any one trade. Failure to manage risk is the most common mistake new traders make.
New updates to this analysis are in bold.
MAIN WAVE COUNT
MONTHLY CHART
Click chart to enlarge.
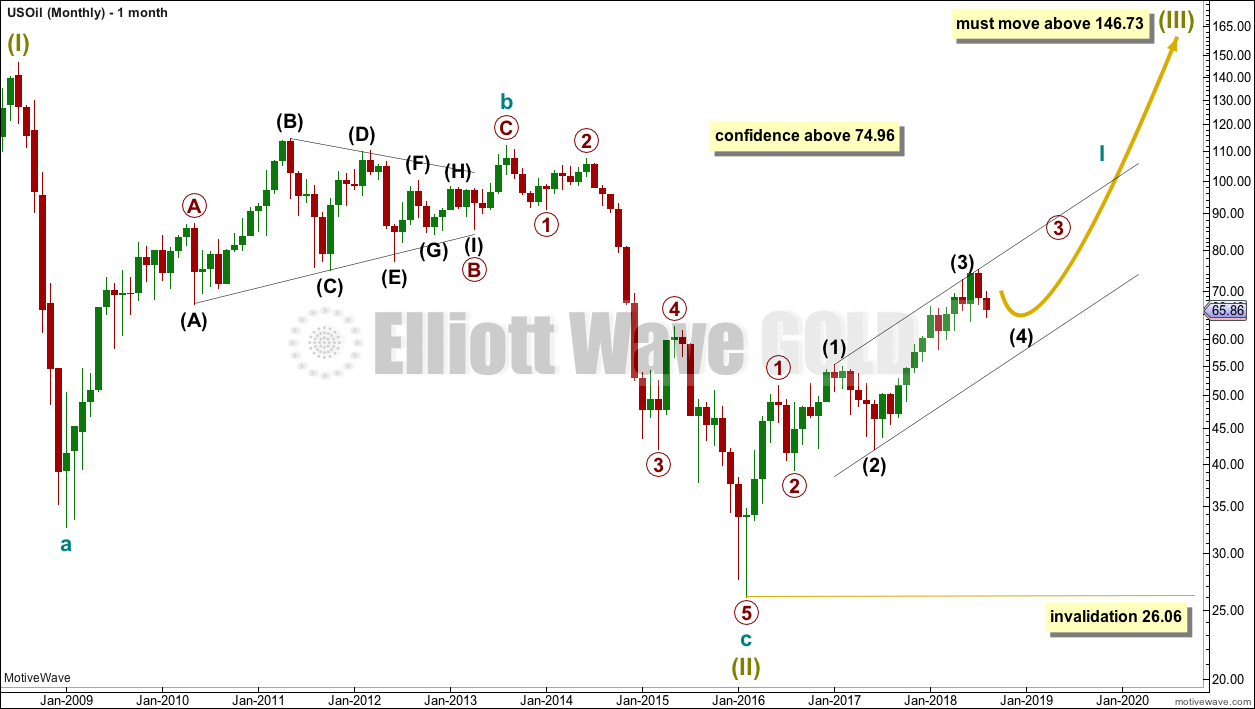
The bear market for US Oil looks to be over and a new bull market looks to be in its very early stages. The prior bearish wave count has been invalidated, leaving only this very bullish wave count.
A huge zigzag down to the last low may be complete and is labelled here Super Cycle wave (II).
Cycle wave b must be seen as complete in August 2013 for this wave count to work. It cannot be seen as complete at the prior major swing high in May 2011.
Cycle wave b is seen as a zigzag, and within it primary wave B is seen as a running contracting triangle. These are fairly common structures, although nine wave triangles are uncommon. All subdivisions fit.
Primary wave C moves beyond the end of primary wave A, so it avoids a truncation. But it does not have to move above the price territory of primary wave B to avoid a truncation, which is an important distinction.
If cycle wave b begins there, then cycle wave c may be seen as a complete five wave impulse.
Super Cycle wave (III) must move beyond the end of Super Cycle wave (I). It must move far enough above that point to allow room for a subsequent Super Cycle wave (IV) to unfold and remain above Super Cycle wave (I) price territory.
Cycle wave I may be incomplete. It may be unfolding as an impulse and may have now moved through the middle portion. Commodities have a tendency to exhibit swift strong fifth waves, and this tendency is especially prevalent for third wave impulses. Intermediate wave (5) to end primary wave 3 may be very swift and strong, ending with a blow off top.
When cycle wave I is complete, then cycle wave II may be a deep correction that may not move beyond the start of cycle wave I below 26.06.
Data from FXCM for USOil does not go back to the beginning of Super Cycle wave (I). Without an accurate known length of Super Cycle wave (I) a target cannot be calculated for Super Cycle wave (III) to end using Fibonacci ratios. The target for Super Cycle wave (III) may be calculated when cycle waves I, II, III and IV within it are complete. That cannot be done for many years.
WEEKLY CHART
Click chart to enlarge.
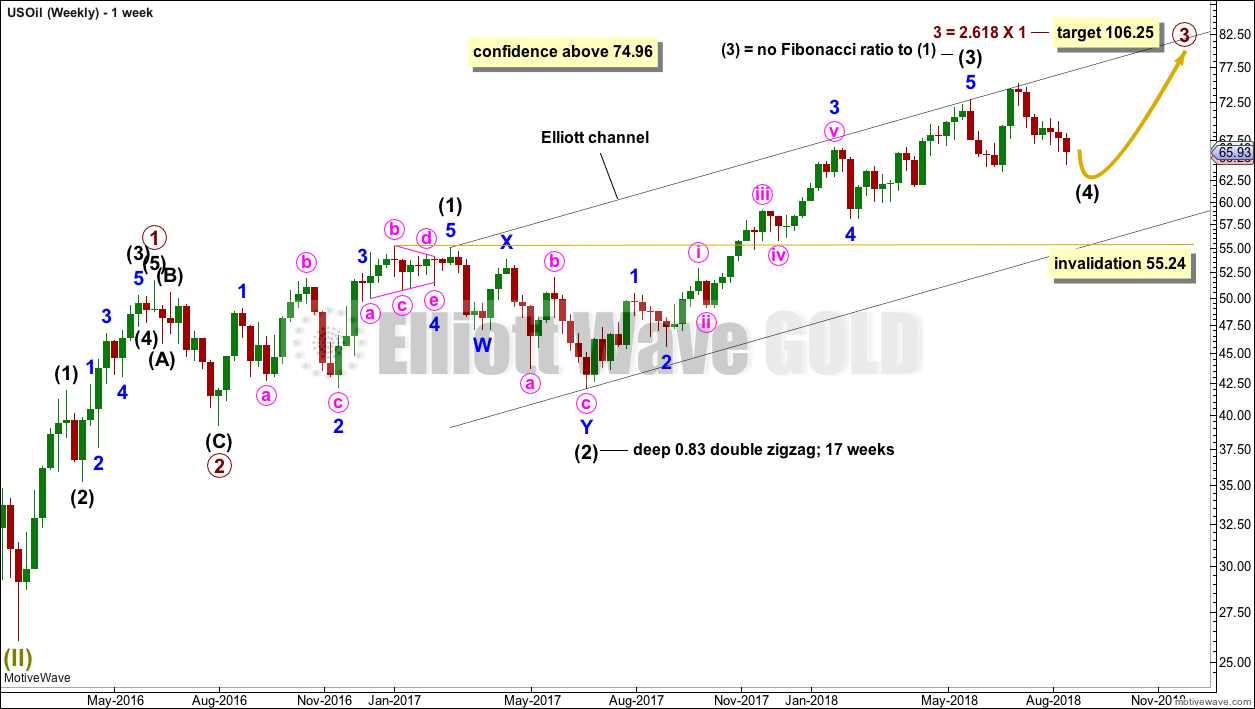
Intermediate wave (3) may now be complete. There is no Fibonacci ratio between intermediate waves (1) and (3), and intermediate wave (3) is longer than 1.618 the length of intermediate wave (1).
This wave count fits with classic technical analysis at the monthly and daily chart levels.
Intermediate wave (2) was a deep double zigzag. Given the guideline of alternation, intermediate wave (4) may be expected to most likely be a shallow flat, triangle or combination. It may be about even in duration with intermediate wave (2), or it may be a little longer because triangles and combinations are more time consuming structures.
In the first instance, a Fibonacci 13 weeks may be expected for intermediate wave (4). So far intermediate wave (4) has lasted 12 weeks, so it could end next week. If it does not end there and continues sideways, then the next Fibonacci ratio in the sequence would be a Fibonacci 21 weeks.
Intermediate wave (4) may find support about the lower edge of the black Elliott channel. It may end within the price territory of the fourth wave of one lesser degree; minor wave 4 has its territory from 66.65 to 59.13.
At this stage, there are still multiple structural options for intermediate wave (4) to complete as. They will be separated out into separate charts.
FLAT
Click chart to enlarge.
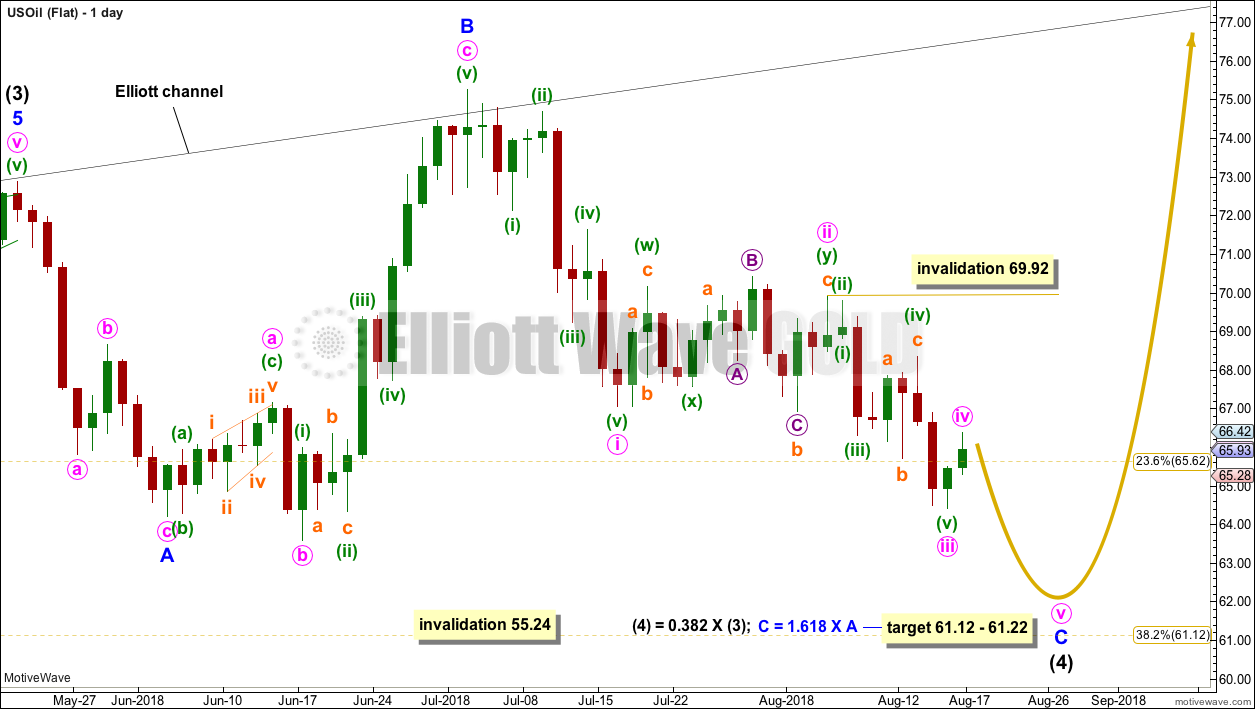
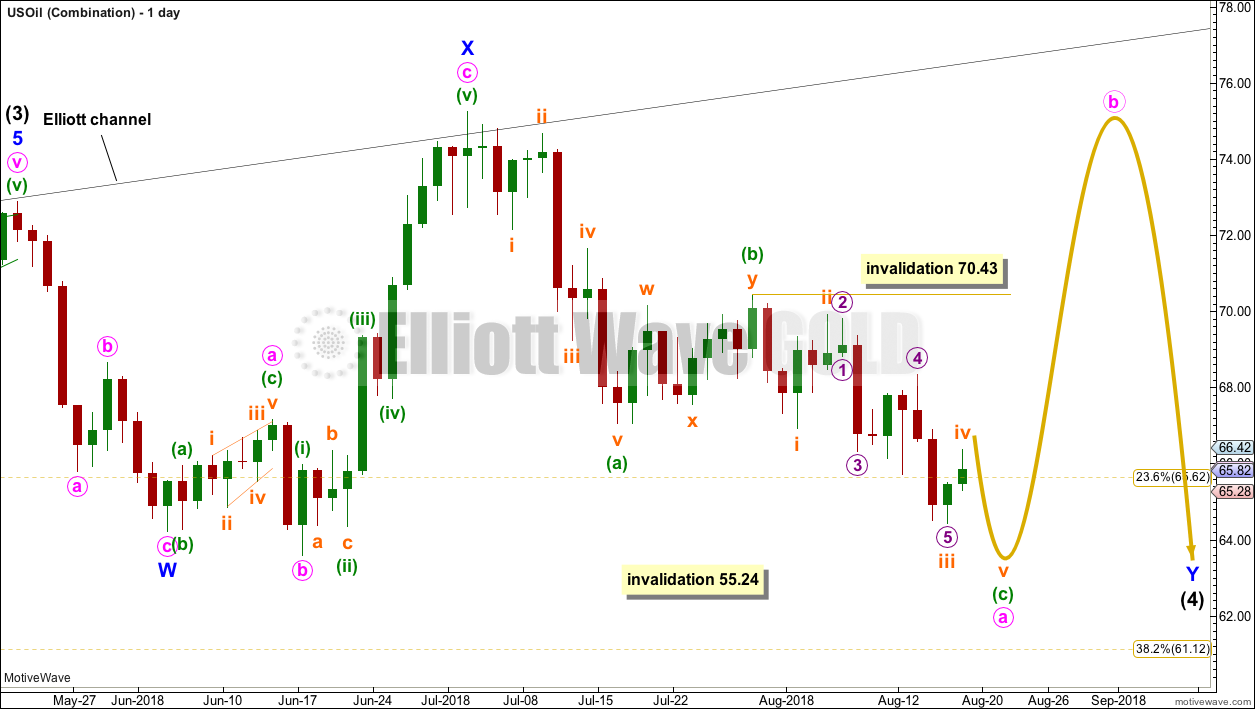
Of all the daily charts, this first chart at this stage has the best look and may have the highest probability.
Intermediate wave (4) may be unfolding as a flat correction. Within the flat correction, minor wave A may be a complete zigzag and minor wave B may be a complete expanded flat correction, a 1.27 length of minor wave A, which is within the most common range of from 1 to 1.38. An expanded flat is indicated.
Expanded flats normally see C waves move substantially beyond the end of their A waves. A target for minor wave C is calculated, which expects it to exhibit a common Fibonacci ratio to minor wave A. This target is very close to the 0.382 Fibonacci ratio of intermediate wave (3).
Minor wave C must subdivide as a five wave structure.
It is possible that minute waves i, ii and now iii may all be complete within minor wave C. Minute wave ii subdivides as a shallow double combination. Minute wave iii may be a complete impulse.
The degree of labelling of minute wave iii will be correct while price remains below the end of minute wave i at 67.05. For the short term, a new high above 67.05 would see the degree of labelling within minute wave iii moved down one degree; if that were to occur, only minuette wave (i) within minute wave iii would be complete and minuette wave (ii) would be limited to no further than the start of minuette wave (i) at 69.92. For this reason the invalidation point is at 69.92 and not 67.05.
Minor wave C may complete within one more week, which would see intermediate wave (4) complete in a total Fibonacci 13 weeks.
At this stage, minor wave C has not moved below the end of minor wave A at 64.22. Minor wave C is extremely likely to make at least a slight new low below the end of minor wave A to avoid a truncation and a very rare running flat. As soon as a new low below 64.22 occurs, it would be possible that minor wave C could be over.
Intermediate wave (4) may not move into intermediate wave (1) price territory below 55.24.
FLAT – ALTERNATE
Click chart to enlarge.
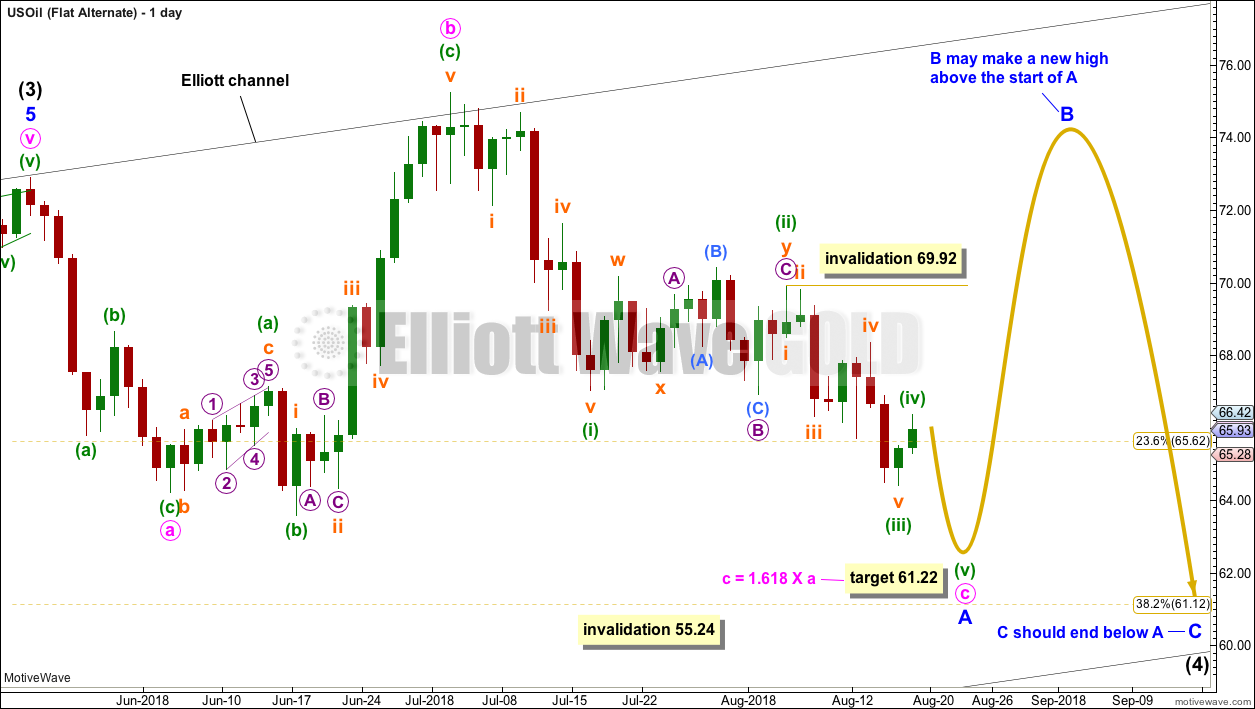
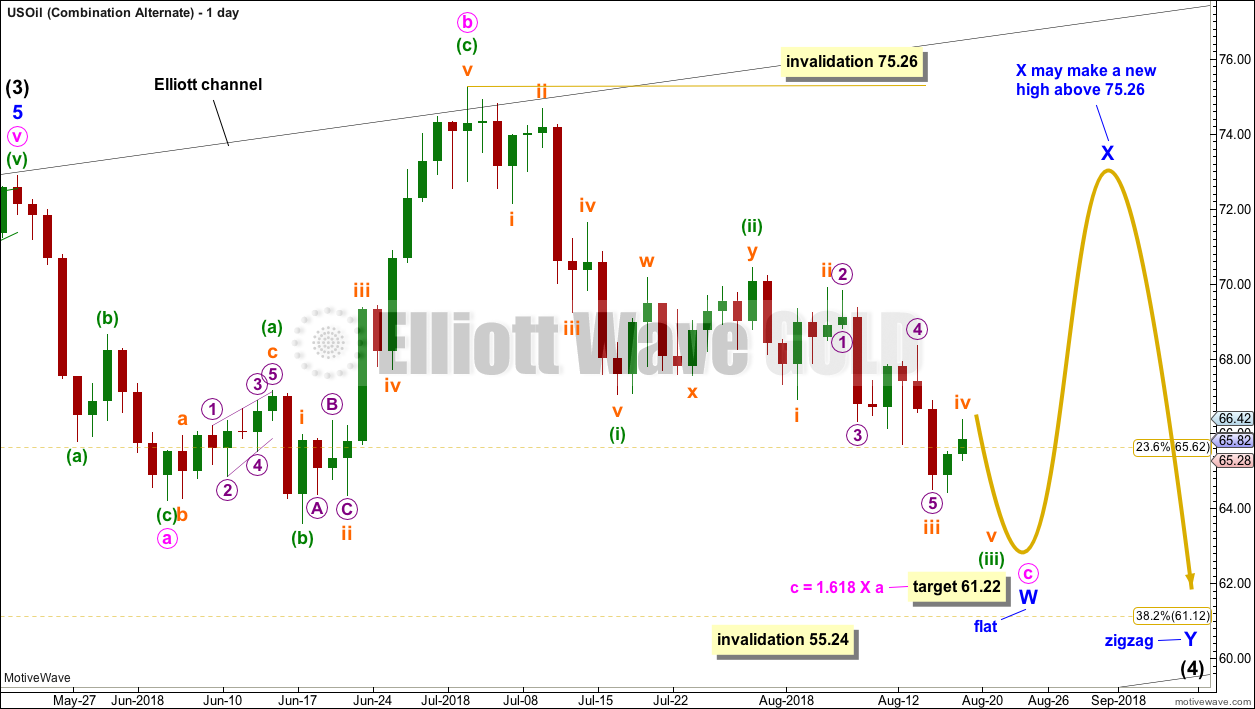
This alternate idea is identical to the first flat wave count with the exception of the degree of labelling. Here, the degree of labelling within intermediate wave (4) is moved down one degree. Minor wave A may be an incomplete flat correction.
The target and expected direction is the same. The upper invalidation point is the same for the short to mid term.
This wave count allows for intermediate wave (4) to be longer lasting. At this stage, it is looking less likely than the first wave count.
COMBINATION
Click chart to enlarge.
Intermediate wave (4) may be unfolding as a double combination.
The first structure in the double may be a completed zigzag labelled minor wave W. The double may be joined by a three in the opposite direction, an expanded flat labelled minor wave X.
The second structure in the double may be either a flat or a triangle, with a flat correction much more likely, so that is what will be expected.
Within the flat correction of minor wave Y, minute wave a must subdivide as a three. An alternate way of seeing this downwards wave for this wave count is considered. Minuette wave (b) may have been over earlier as a shallow double zigzag, and minuette wave (c) may have begun there as an impulse. The impulse of minuette wave (c) may be incomplete and need only one new low to complete it.
Within the flat correction of minor wave Y, when minute wave a is a completed three wave structure, then minute wave b must unfold upwards and must retrace a minimum 0.9 length of minute wave a. Minute wave b at that stage may make a new high above the start of minute wave a at 75.26.
Minor wave Y would most likely end about the same level as minor wave W at 64.22, so that the whole structure takes up time and moves price sideways.
COMBINATION – ALTERNATE
Click chart to enlarge.
This alternate idea for the combination again moves the degree of labelling within intermediate wave (4) all down one degree.
The first structure in a double combination may be an incomplete flat correction labelled minor wave W. Within the flat correction of minor wave W, minute wave c would be extremely likely to make at least one slight new low below the end of minute wave a at 64.22 to avoid a truncation and a very rare running flat.
When minor wave W is complete, then minor wave X should unfold as a three wave structure upwards, most likely a zigzag. Minor wave X has no minimum requirement nor no maximum allowable length.
Thereafter, minor wave Y would most likely be a zigzag and would most likely end about the same level as minor wave W, so that the whole structure takes up time and moves price sideways.
A double combination with this degree of labelling could take several more weeks to unfold. At this stage, this looks to be too time consuming considering the proportion between intermediate waves (2) and (4) on the weekly chart.
TRIANGLE
Click chart to enlarge.
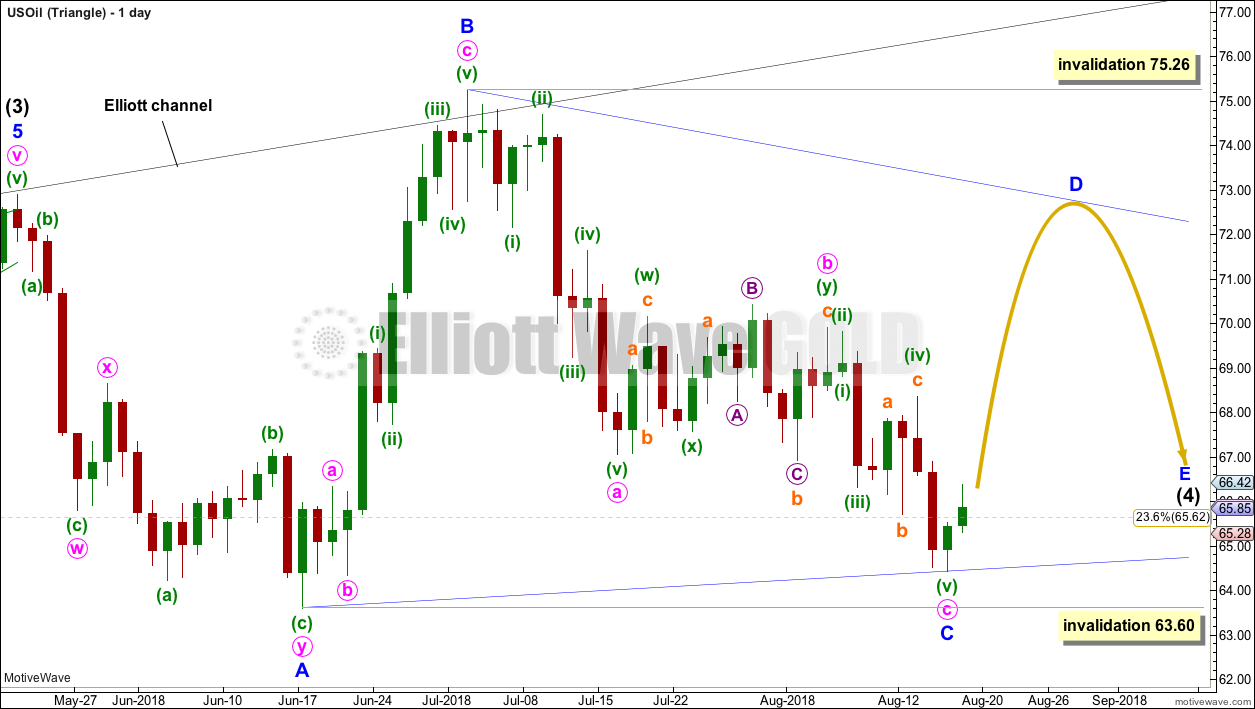
Intermediate wave (4) may be unfolding as a triangle.
Within the triangle, minor wave A should be seen as over at the last low. This is problematic because it does not fit as a single zigzag. It can be seen complete as a double zigzag, but this looks forced because minute wave w does not look like a very clear three.
If minor wave A is a double zigzag, then all remaining triangle sub-waves must subdivide as single structures. All but one of them must be zigzags and one triangle sub-wave may be another type of corrective structure.
Within the triangle, minor wave C may be now a complete zigzag. Minor wave D may now be a strong bounce that may not move reasonably beyond 75.26.
If intermediate wave (4) is unfolding as a contracting triangle, then minor wave D may not move beyond the end of minor wave B.
If intermediate wave (4) is unfolding as a barrier triangle, then minor wave D may end about the same level as minor wave C; the triangle wave count would remain valid as long as the B-D trend line remains essentially flat, which is subjective (the upper invalidation point is not black and white).
Minor wave C may not move beyond the end of minor wave A below 63.60.
A triangle may take several more weeks to complete. They are often very time consuming structures.
TECHNICAL ANALYSIS
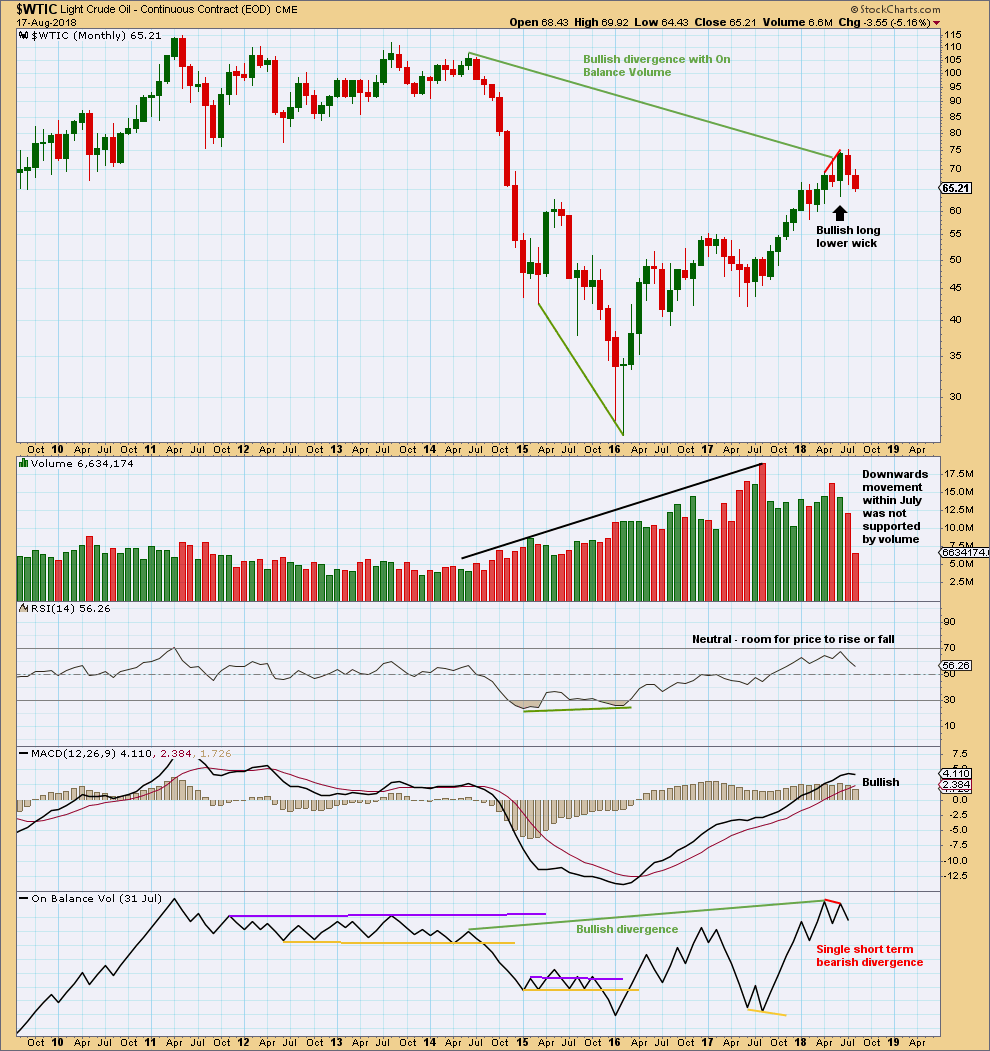
MONTHLY CHART
Click chart to enlarge. Chart courtesy of StockCharts.com.
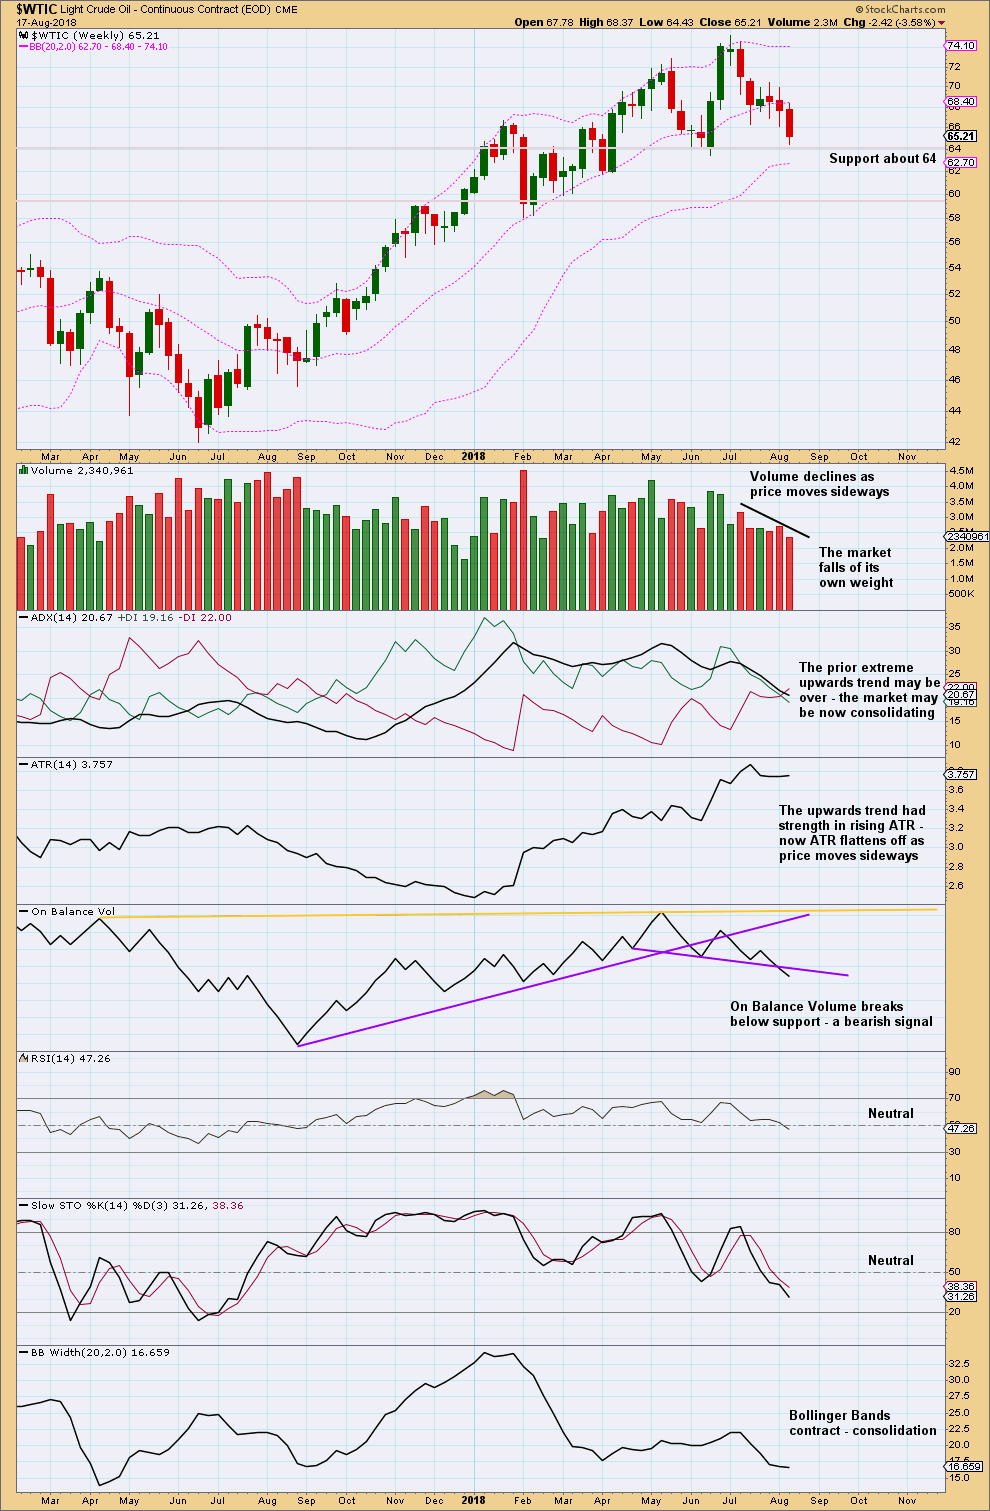
The short term volume profile is bearish: the strongest month in the last few months was the downwards month of May (where the balance of volume was down) and now June shows a decline in volume, so volume has not supported upwards movement here.
July saw another red monthly candlestick with the balance of volume downwards, but the market fell of its own weight; it was not supported by volume. This is not necessarily bullish, but it does point to a consolidation as somewhat more likely here.
For the short term, On Balance Volume is also slightly bearish. This supports the idea that price may be within a correction and not necessarily a continuation of the larger upwards trend.
However, it is entirely possible that this situation could reverse and volume could start to support upwards movement, as has happened back in January 2018.
The larger trend is upwards.
WEEKLY CHART
Click chart to enlarge. Chart courtesy of StockCharts.com.
Price needs to break below support, and close below it at about 64.00, for a downwards trend to be considered.
On Balance Volume is very bearish.
DAILY CHART
Click chart to enlarge. Chart courtesy of StockCharts.com.
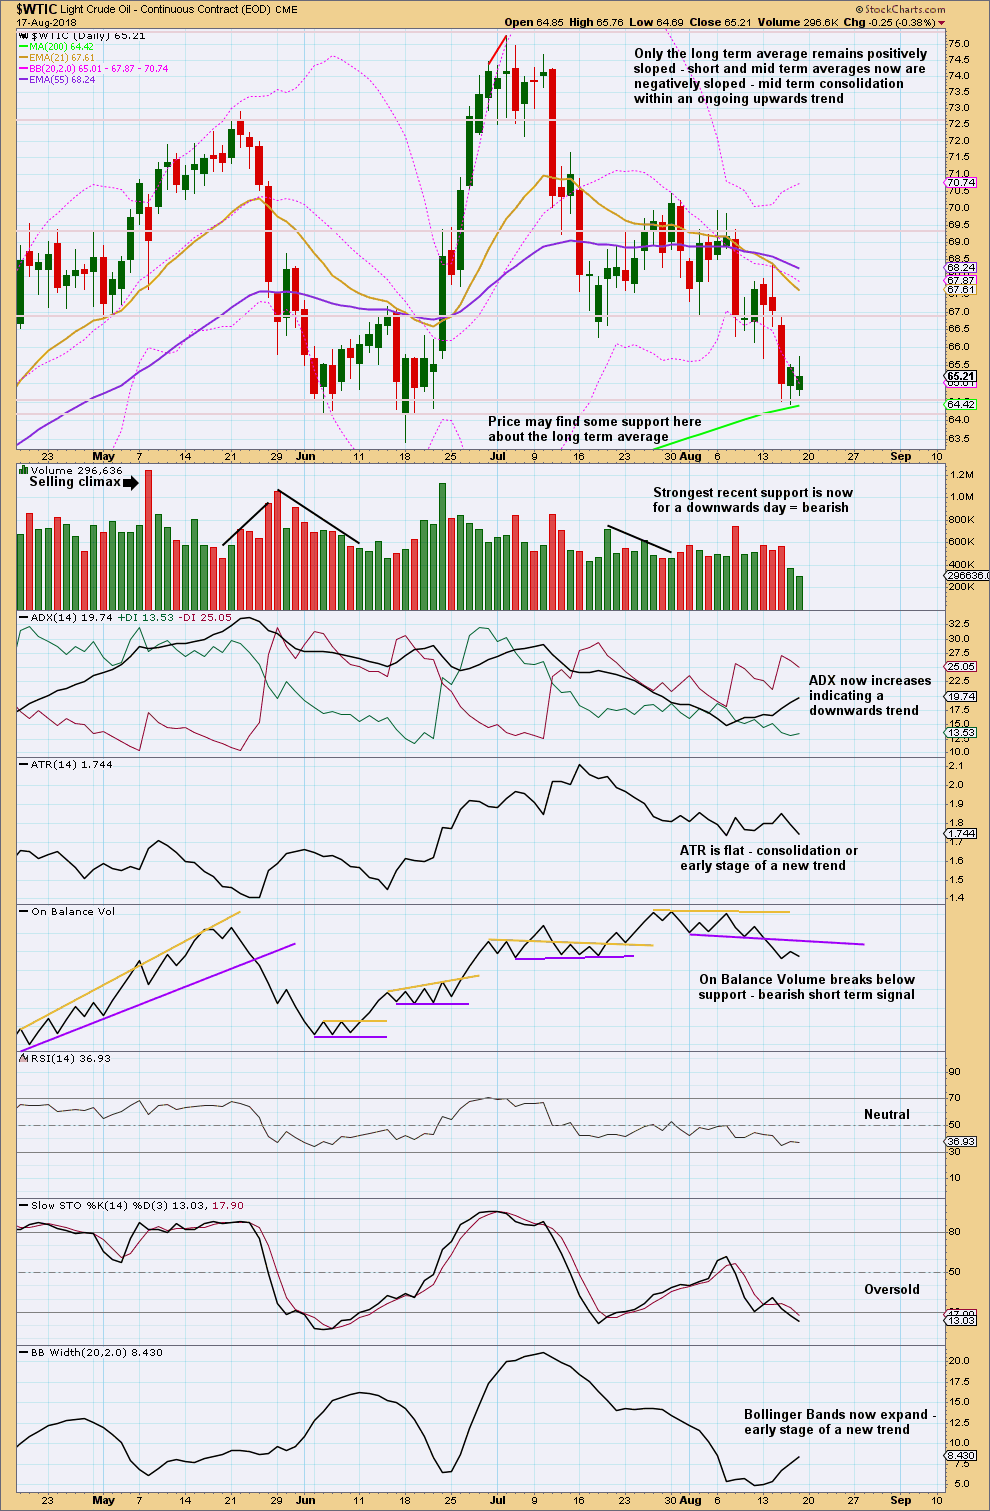
ADX now indicates a downwards trend at the daily chart time frame.
Stochastics is just now oversold; when Oil trends strongly, Stochastics may remain extreme for reasonable periods of time.
RSI is neutral, so there is plenty of room for price to fall.
If price can close below support here, at about 64.00, then consider a new downwards trend.
Published @ 12:01 a.m. EST on 19th August, 2018.