
After a five down from an Elliott wave triangle, a three up was expected to develop. This is what happened on Friday.
Summary: There are at this time multiple alternate wave counts because of the expectation that a cycle degree b wave is unfolding.
At this time, it may be best to use classic technical analysis as a guide as it offers some clarity.
A downwards breakout from an ascending triangle has completed, with support from volume and a strong bearish signal from On Balance Volume. The target is at 1,145. For the short term, look out for a throw back to test resistance at the lower triangle trend line on Monday / Tuesday before price moves down and away.
New updates to this analysis are in bold.
Grand SuperCycle analysis is here.
Last historic analysis with monthly charts is here.
Weekly charts will again all be reviewed at the end of this week.
MAIN ELLIOTT WAVE COUNT
WEEKLY CHART – COMBINATION
Click chart to enlarge.
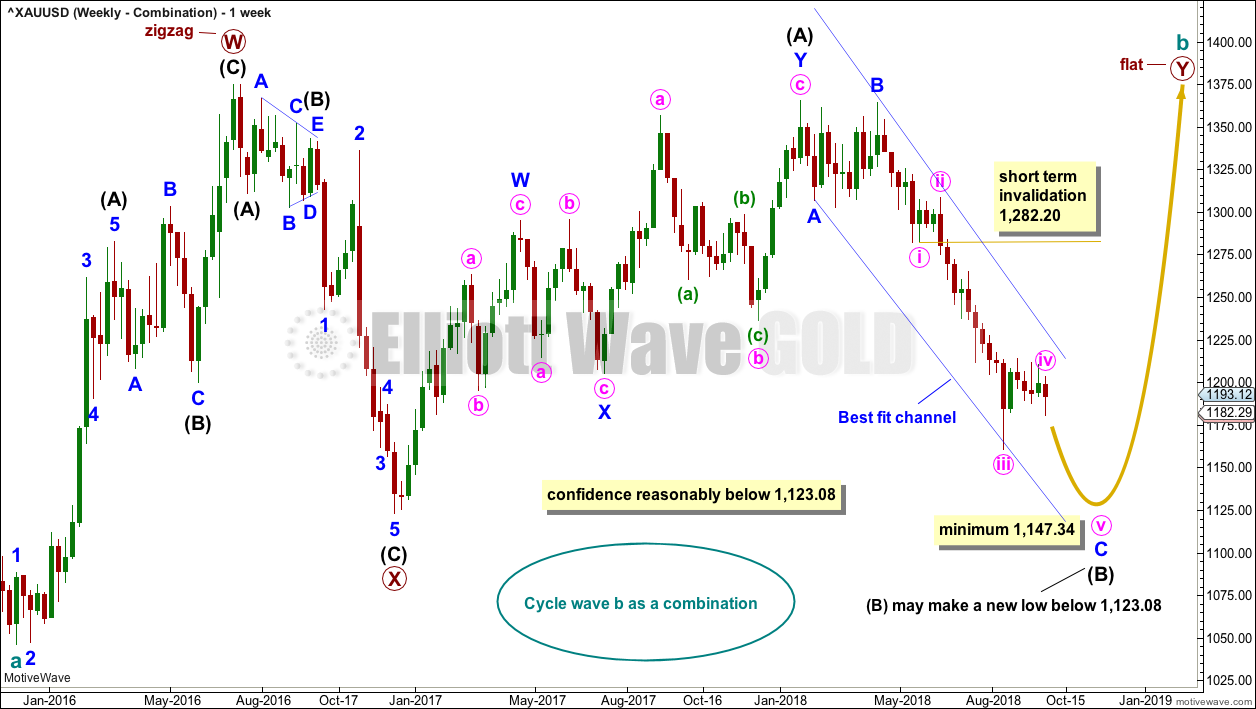
There are four remaining weekly wave counts at this time for cycle wave b: a triangle, flat, combination or double zigzag.
All four weekly wave counts are again considered at the end of this week. Only two shall be followed on a daily basis.
At this stage, this wave count may have a slightly higher probability than the other three weekly wave counts because it has more support from classic technical analysis.
If cycle wave b is a combination, then the first structure in a double may be a complete zigzag labelled primary wave W.
The double may be joined by a three in the opposite direction, a zigzag labelled primary wave X.
The second structure in the double may be a flat correction labelled primary wave Y. My research on Gold so far has found that the most common two structures in a double combination are one zigzag and one flat correction. I have found only one instance where a triangle unfolded for wave Y. The most likely structure for wave Y would be a flat correction by a very wide margin, so that is what this wave count shall expect.
Within a flat correction for primary wave Y, the current downwards wave of intermediate wave (B) may be a single or multiple zigzag; for now it shall be labelled as a single. Intermediate wave (B) must retrace a minimum 0.9 length of intermediate wave (A) at 1,147.34. Intermediate wave (B) may move beyond the start of intermediate wave (A) as in an expanded flat.
Because the minimum requirement for intermediate wave (B) is not yet met, this wave count requires that minute wave v of minor wave C of intermediate wave (B) continues lower. This is the most immediately bearish of all four weekly wave counts.
When intermediate wave (B) is complete, then intermediate wave (C) would be expected to make at least a slight new high above the end of intermediate wave (A) at 1,365.68 to avoid a truncation. Primary wave Y would be most likely to end about the same level as primary wave W at 1,374.91, so that the whole structure takes up time and moves price sideways, as that is the purpose of double combinations.
While double combinations are very common, triples are extremely rare. I have found no examples of triple combinations for Gold at daily chart time frames or higher back to 1976. When the second structure in a double is complete, then it is extremely likely (almost certain) that the whole correction is over.
DAILY CHART – COMBINATION
Click chart to enlarge.
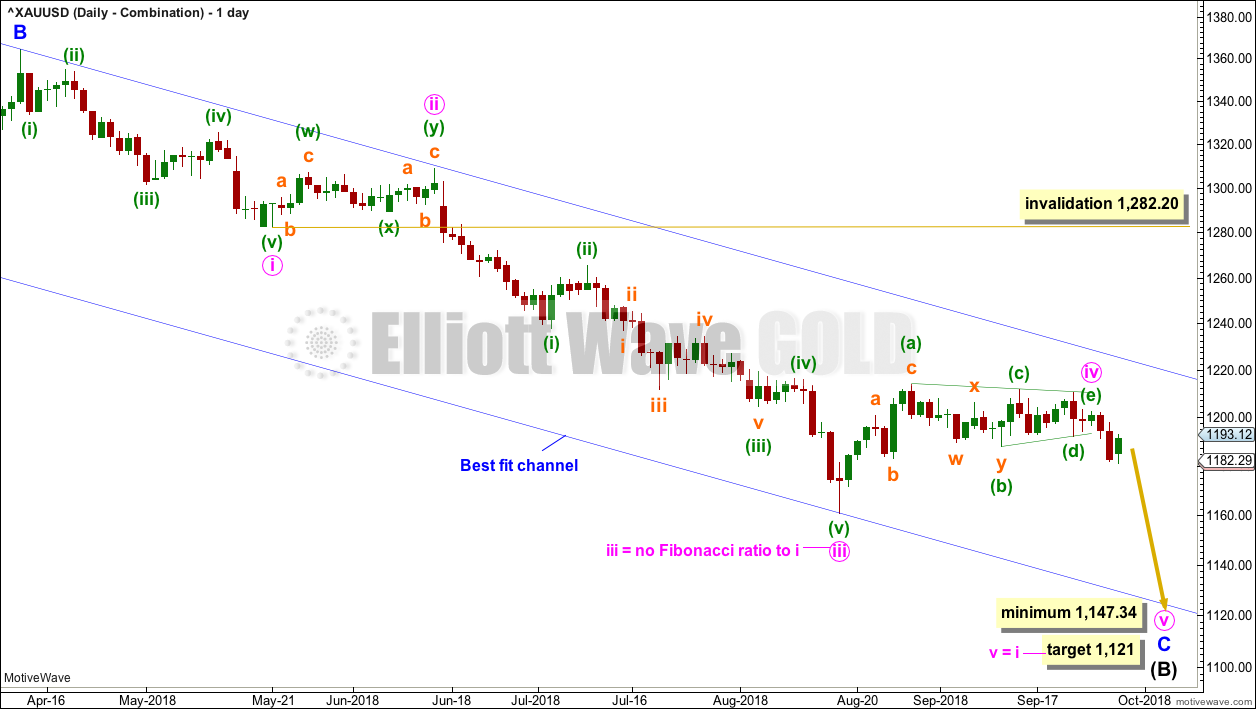
Intermediate wave (B) may be unfolding lower as either a single or double zigzag. At this stage, a single zigzag will be considered; the expected direction nor minimum requirement at 1,147.34 do not differ from a double zigzag.
If intermediate wave (B) is unfolding as a single zigzag, then within it minor wave C must subdivide as a five wave impulse.
Minute wave iv looks like a complete regular contracting triangle. The downwards breakout from the triangle may be minute wave v.
Gold often exhibits surprisingly swift and short fifth waves out of its fourth wave triangles. If the target is wrong, then it may be too low.
HOURLY CHART
Click chart to enlarge.
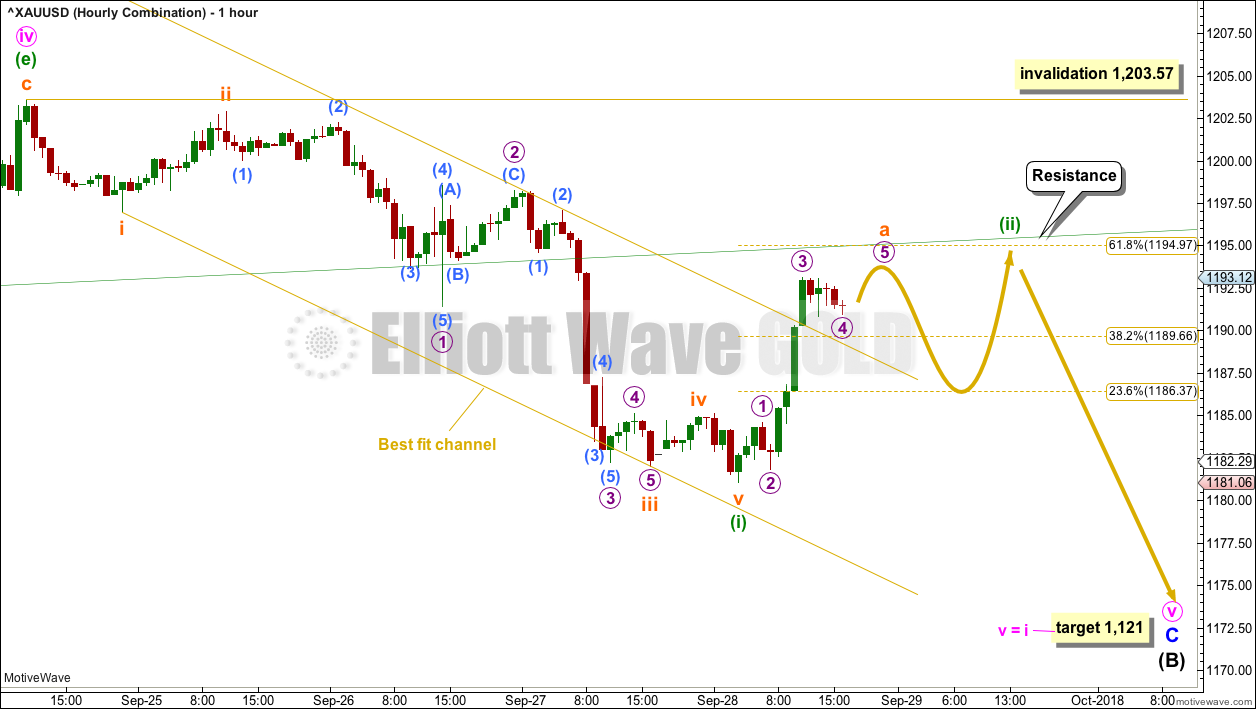
If the triangle is complete, then a five down should develop on the hourly chart. This is labelled minuette wave (i), which may now be complete.
Following a five down, a three up should develop. Minuette wave (ii) may find resistance about the lower edge of the triangle trend line, which is also about the 0.618 Fibonacci ratio of minuette wave (i).
Minuette wave (ii) may not move beyond the start of minuette wave (i) above 1,203.57.
When minuette wave (ii) is complete, then an increase in downwards momentum may be expected for minuette wave (iii).
WEEKLY CHART – TRIANGLE
Click chart to enlarge.
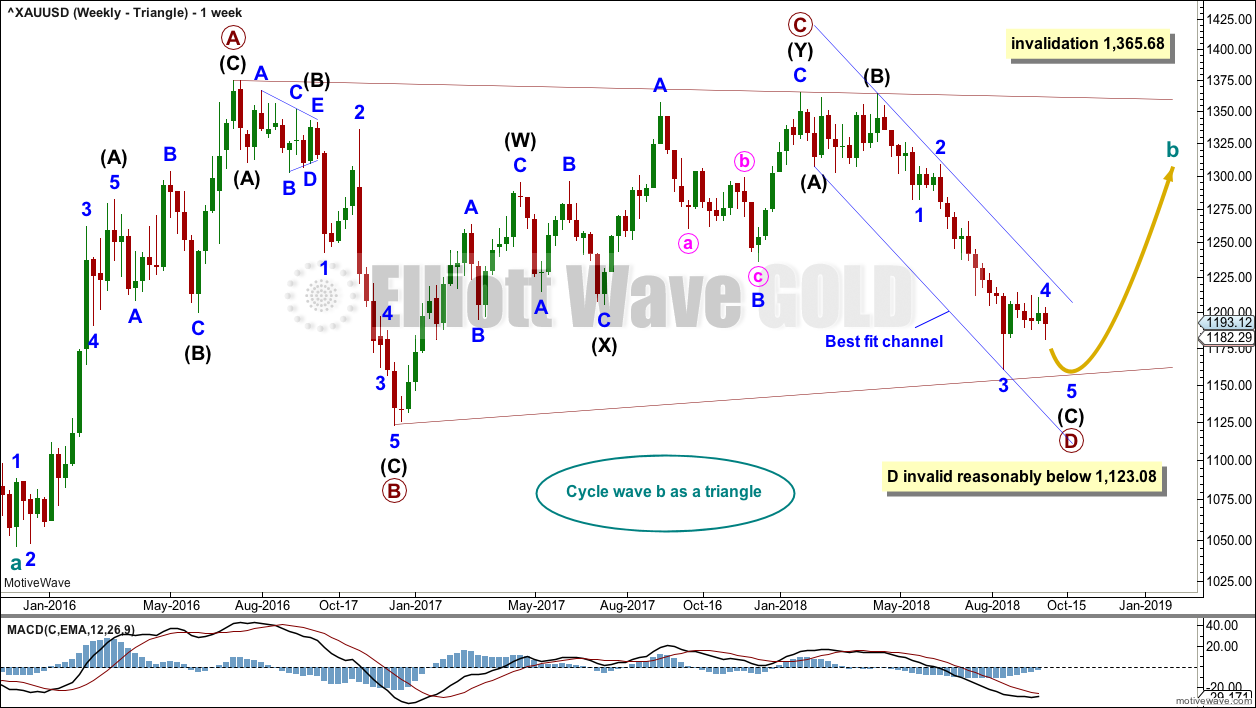
At the weekly chart level, the triangle so far has the best fit and look, but at this stage it no longer has good support from classic technical analysis. It is now judged to have a slightly lower probability than the combination wave count.
Cycle wave b may be an incomplete triangle. The triangle may be a contracting or barrier triangle, with a contracting triangle looking much more likely because the A-C trend line does not have a strong slope. A contracting triangle could see the B-D trend line have a stronger slope, so that the triangle trend lines converge at a reasonable rate. A barrier triangle would have a B-D trend line that would be essentially flat, and the triangle trend lines would barely converge.
Within a contracting triangle, primary wave D may not move beyond the end of primary wave B below 1,123.08. Within a barrier triangle, primary wave D may end about the same level as primary wave B at 1,123.08, so that the B-D trend line is essentially flat. Only a new low reasonably below 1,123.08 would invalidate the triangle.
Within both a contracting and barrier triangle, primary wave E may not move beyond the end of primary wave C above 1,365.68.
Four of the five sub-waves of a triangle must be zigzags, with only one sub-wave allowed to be a multiple zigzag. Primary wave C is the most common sub-wave to subdivide as a multiple, and this is how primary wave C for this example fits best.
Primary wave D must be a single structure, most likely a zigzag.
There are no problems in terms of subdivisions or rare structures for this wave count. It has an excellent fit and so far a typical look.
A channel is drawn on all charts about the downwards wave of primary wave D. Here, it is labelled a best fit channel. If this channel is breached by upwards movement, that may provide reasonable confidence in this weekly triangle wave count and the double zigzag count, and put serious doubt on the combination and flat wave counts.
After a slight new low, this wave count expects a consolidation for primary wave E to back test resistance at prior support, and then a significant new downwards wave for cycle wave C. For the long term, this is the most bearish wave count.
DAILY CHART – TRIANGLE
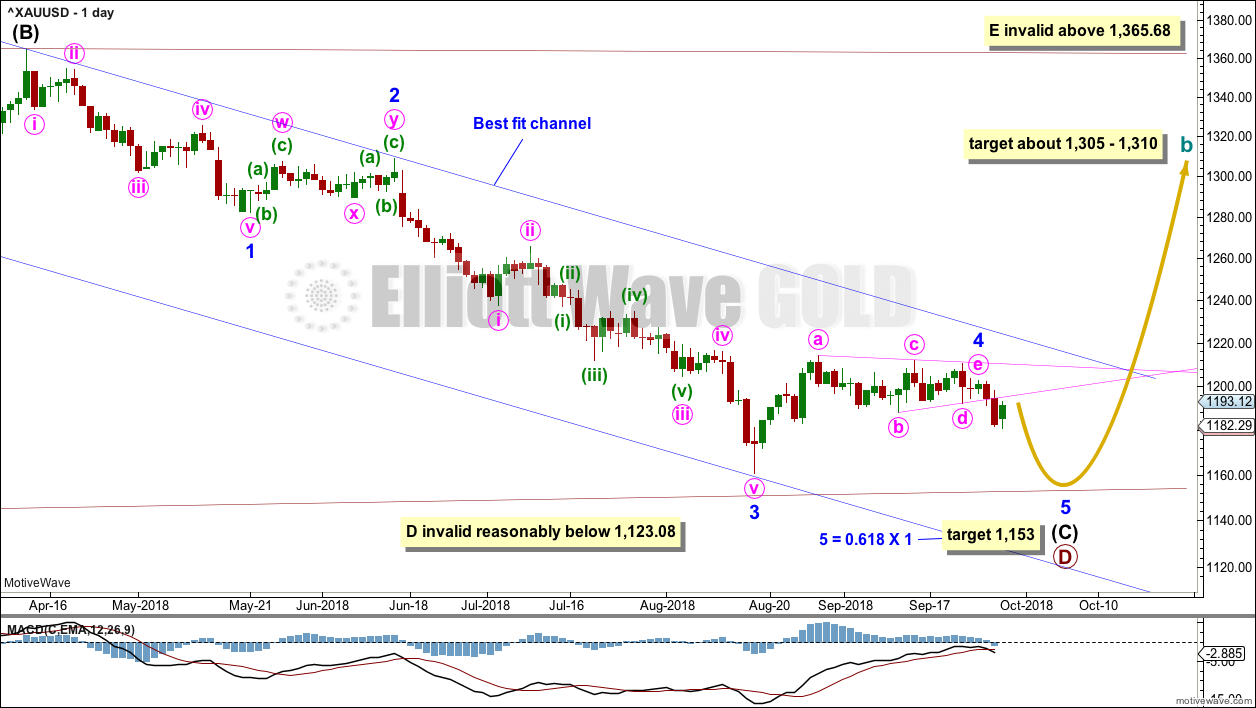
Click chart to enlarge.
Intermediate wave (C) may be almost complete. The triangle for minor wave 4 may have ended. Minor wave 5 may be underway. A target is calculated for minor wave 5 to end that expects it to exhibit a Fibonacci ratio to minor wave 1, and would still see the B-D trend line of the triangle for cycle wave b have a reasonable slope.
Gold often exhibits surprisingly short and brief fifth waves out of its fourth wave triangles. This wave count expects this tendency. Minor wave 5 would most likely end at least slightly below the end of minor wave 3 at 1,160.75 to avoid a truncation. The target expects it to end only a little below this point.
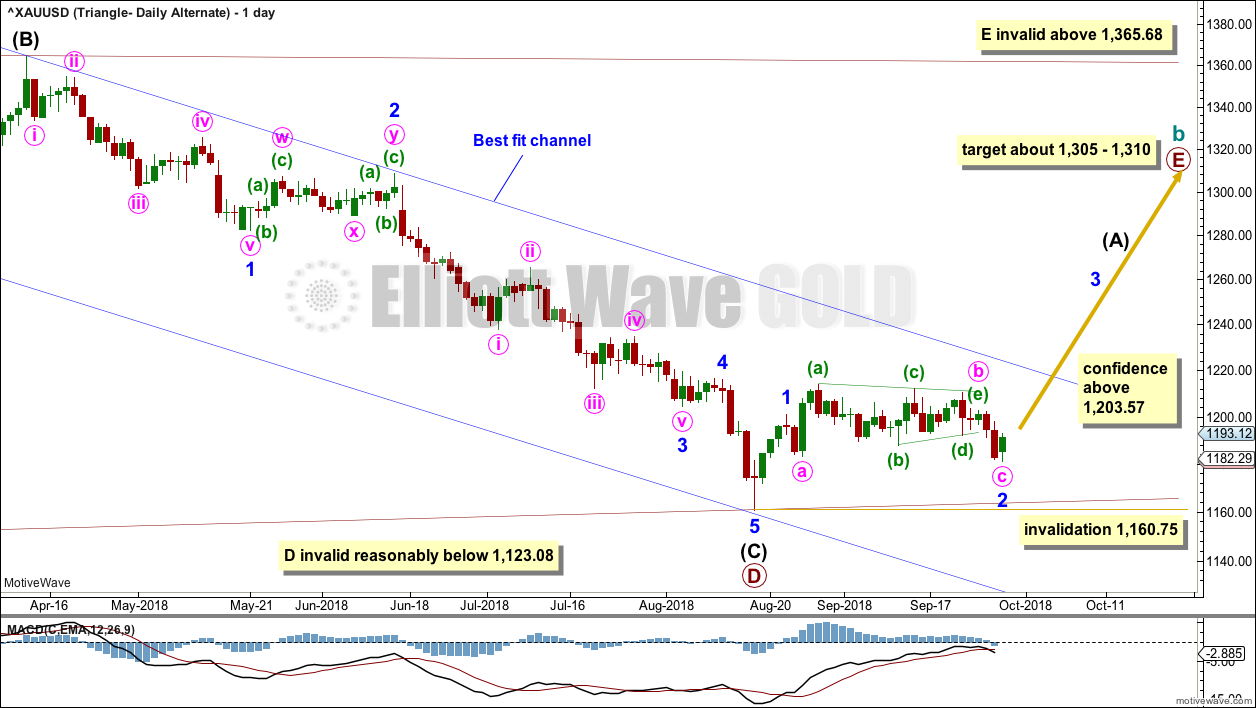
DAILY CHART – TRIANGLE – ALTERNATE
Click chart to enlarge.
Primary wave D may be complete.
If price moves above 1,203.57 by any amount at any time frame, then this alternate wave count would be indicated as most likely.
For strong confidence, this wave count now requires a breach of the upper edge of the blue best fit channel. This channel is drawn the same way on all weekly and daily charts, all on a semi-log scale.
Minor wave 1 may have been over on the 22nd of August.
Minor wave 2 may be a complete expanded flat correction. Within the expanded flat, at its end minute wave b must retrace a minimum 0.9 length of minute wave a.
Minute wave b may be complete at a 1.1 length of minute wave a. Minute wave c has ended below the end of minute wave a at 1,183.36, avoiding a truncation and a very rare running flat.
Minor wave 2 may not move beyond the start of minor wave 1 below 1,160.75.
A target for primary wave E is the strong zone of resistance about 1,305 to 1,310. Primary wave E is most likely to subdivide as a zigzag (although it may also subdivide as a triangle to create a rare nine wave triangle), and it should last at least a Fibonacci 13 weeks. Primary wave E may not move beyond the end of primary wave C above 1,365.68.
This wave count looks at the possibility that a short false downwards breakout may have just occurred out of the triangle and may now be followed by a deep time consuming bounce.
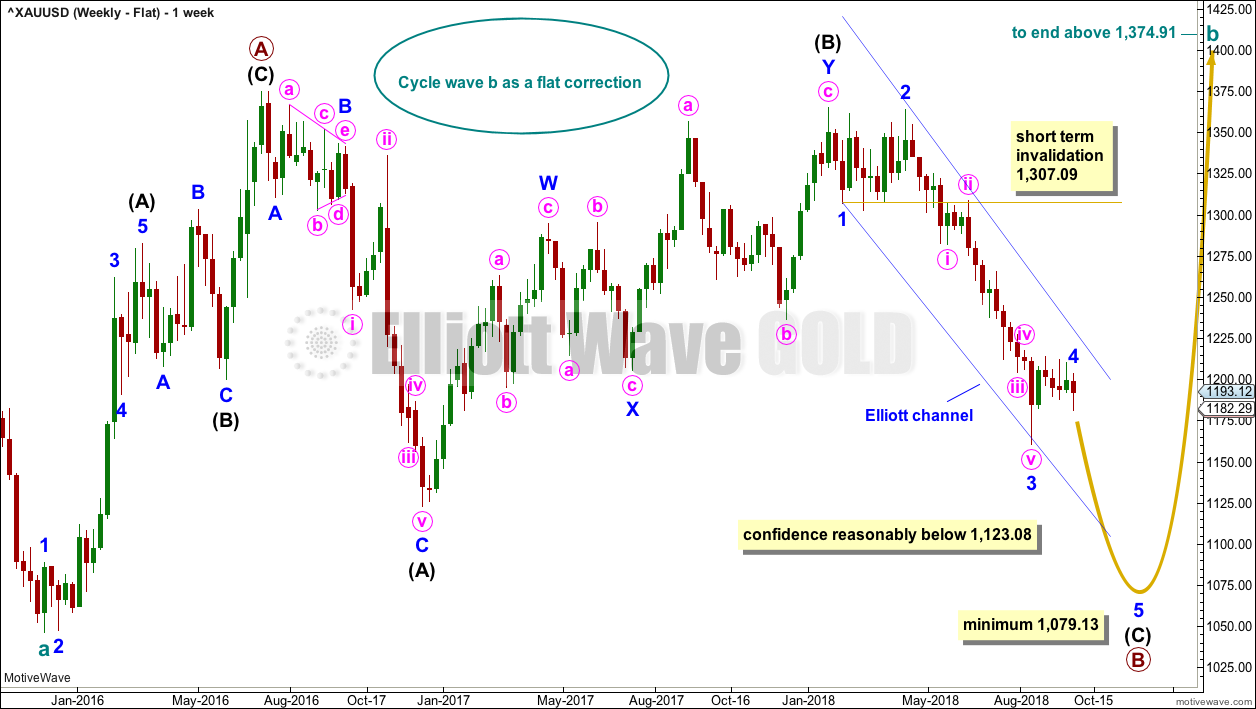
WEEKLY CHART – FLAT
Click chart to enlarge.
It is possible that cycle wave b may be a flat correction. Within a flat correction, primary wave B must retrace a minimum 0.9 length of primary wave A at 1,079.13 or below. Primary wave B may make a new low below the start of primary wave A at 1,046.27 as in an expanded flat correction.
Only a new low reasonably below 1,123.08 would provide reasonable confidence in this wave count.
Intermediate wave (C) must subdivide as a five wave structure; it may be unfolding as an impulse. Within intermediate wave (C), minor waves 1 through to 4 may be complete. If it continues further, then minor wave 4 may not move into minor wave 1 price territory above 1,307.09.
The blue channel here is drawn using Elliott’s first technique. Minor wave 4 would be most likely to remain contained within this channel, and may find resistance about the upper edge if it gets there. A strong breach of this channel by upwards movement would reduce the probability of this wave count.
Minor wave 2 was a double zigzag lasting nine weeks. Minor wave 4 exhibits alternation as a triangle and reasonable proportion lasting six weeks.
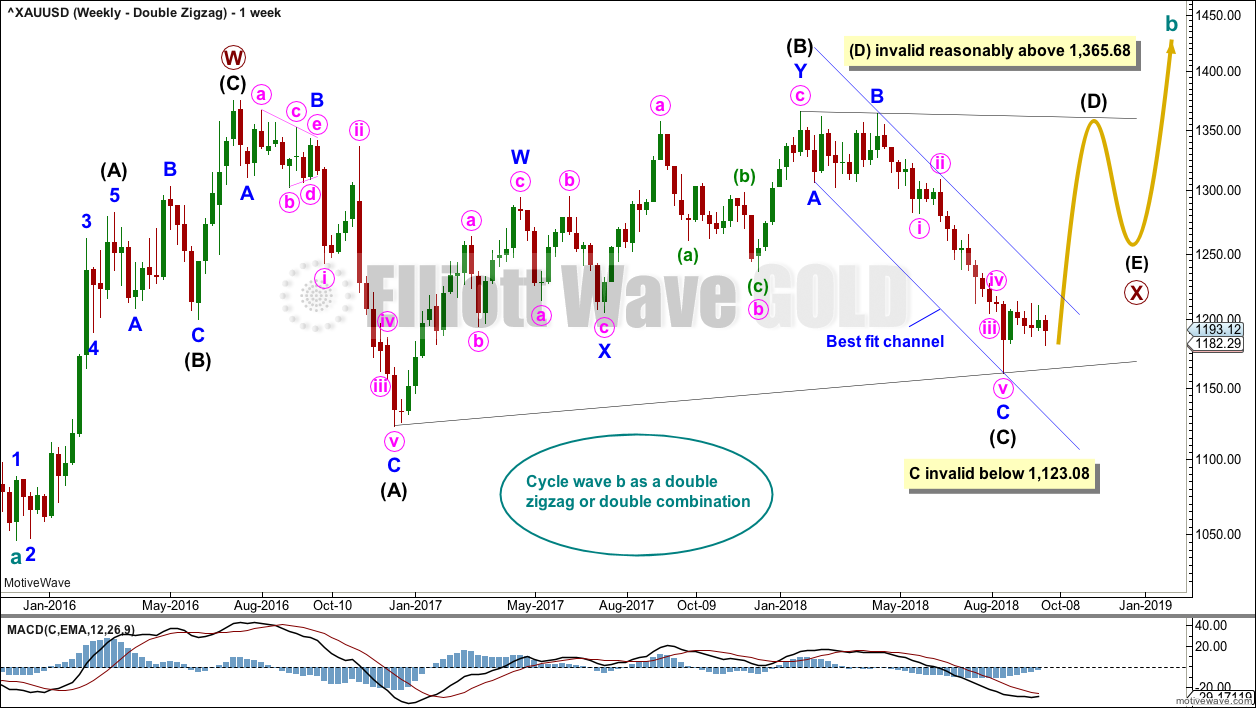
WEEKLY CHART – DOUBLE ZIGZAG
Click chart to enlarge.
Finally, it is also possible that cycle wave b may be a double zigzag or a double combination.
The first zigzag in the double is labelled primary wave W. This has a good fit.
The double may be joined by a corrective structure in the opposite direction, a triangle labelled primary wave X. The triangle would be about two thirds complete.
Within the triangle of primary wave X, intermediate wave (C) may now be complete. It may not move beyond the end of intermediate wave (A) below 1,123.08. The A-C trend line for both a barrier and contracting triangle should have some reasonable slope. For the triangle of primary wave X to have the right look, intermediate wave (C) should end here or very soon indeed.
This wave count may now expect choppy overlapping movement in an ever decreasing range for several more months. After the triangle is complete, then an upwards breakout would be expected from it.
Primary wave Y would most likely be a zigzag because primary wave X would be shallow; double zigzags normally have relatively shallow X waves.
Primary wave Y may also be a flat correction if cycle wave b is a double combination, but combinations normally have deep X waves. This would be less likely.
This wave count has good proportions and no problems in terms of subdivisions.
TECHNICAL ANALYSIS
WEEKLY CHART
Click chart to enlarge. Chart courtesy of StockCharts.com.
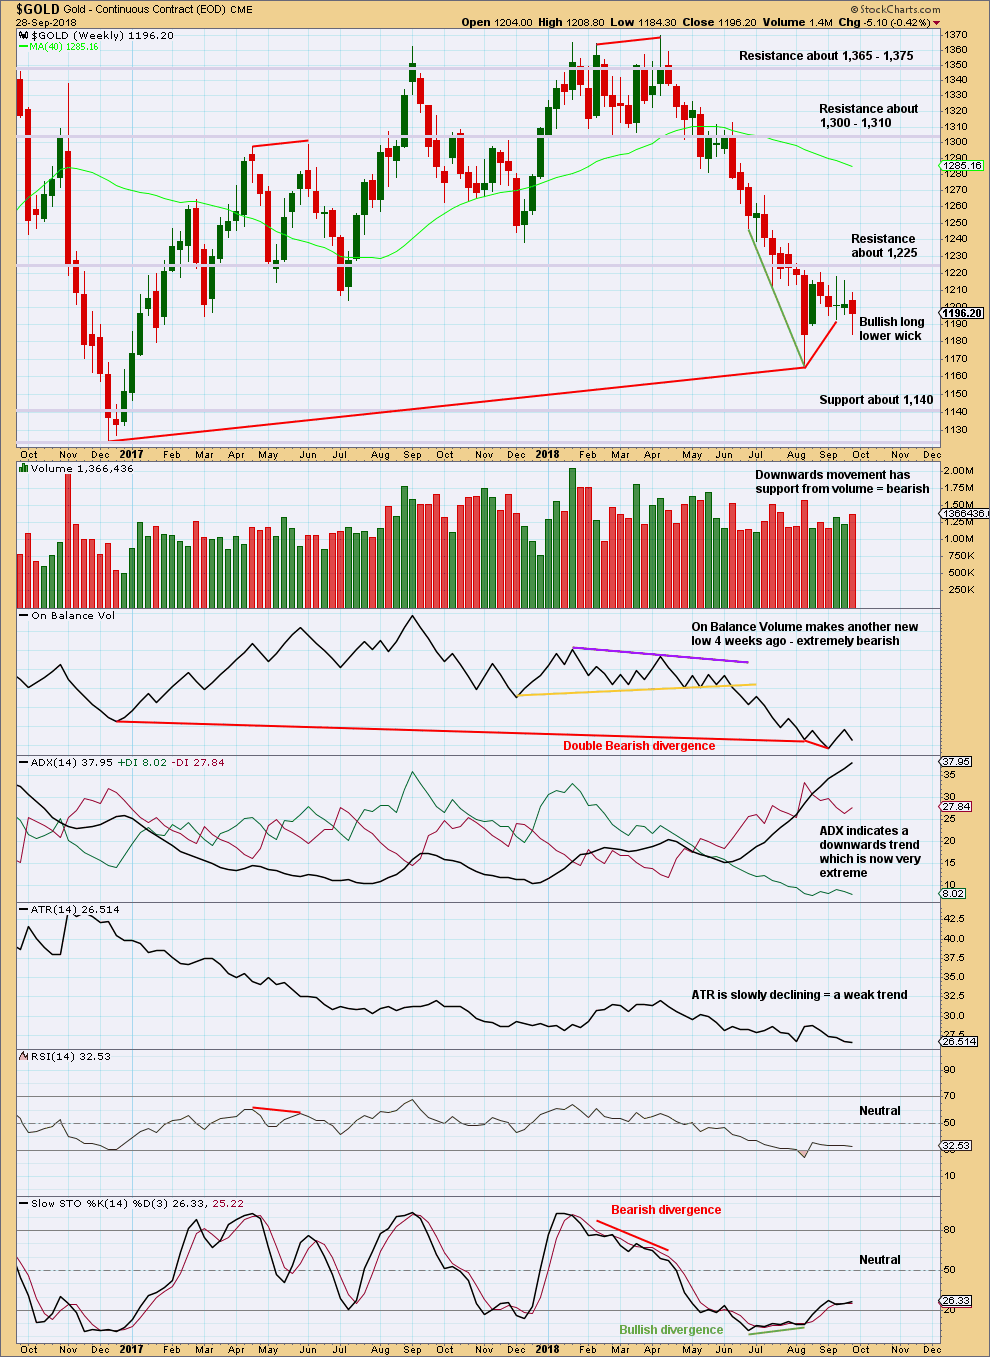
On Balance Volume is lower than its prior point at the end of November 2015. This divergence is extremely bearish but does not rule out a consolidation unfolding here; the divergence does strongly support the Triangle wave count, which expects a consolidation or bounce up to test resistance now and then a continuation of a major bear market. It could also support the flat wave count that allows for a new low below 1,046.27 in coming months.
On Balance Volume has made another new low, but price has not. There is now double bearish divergence between price and On Balance Volume.
The consolidation of the last six weeks has brought RSI and Stochastics up from oversold, but ADX remains very extreme. If the downwards trend resumes here, then it may be limited by extreme indicators. The consolidation may continue further to relieve extreme ADX.
If price does continue lower, then look for next support about 1,140.
DAILY CHART
Click chart to enlarge. Chart courtesy of StockCharts.com.
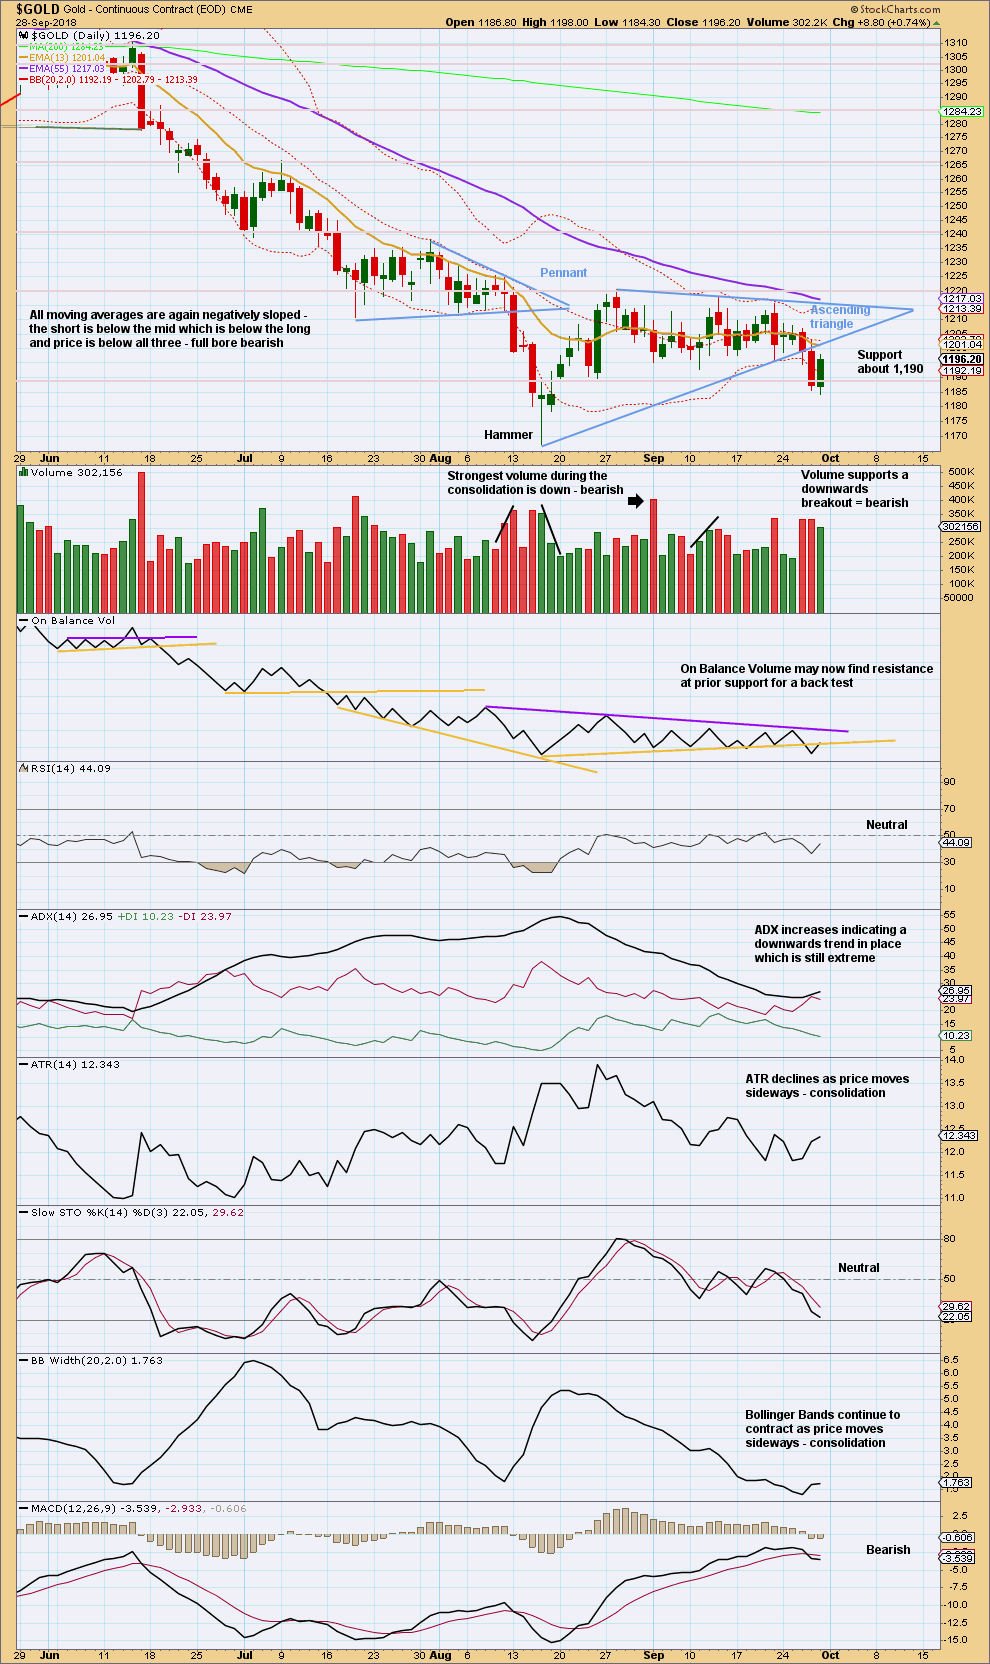
A downwards breakout below the ascending triangle, with support from volume, has completed. Upwards movement for Friday so far looks like a typical throw back to resistance at the lower triangle trend line.
A target is calculated at 1,145 using the measured rule.
The bearish signal from On Balance Volume offers support to the view that price is breaking out from a triangle pattern and that it is likely now to make new lows. This bearish signal is strong because the trend line broken is long held, has a very shallow slope, and was tested multiple times.
GDX WEEKLY CHART
Click chart to enlarge. Chart courtesy of StockCharts.com.
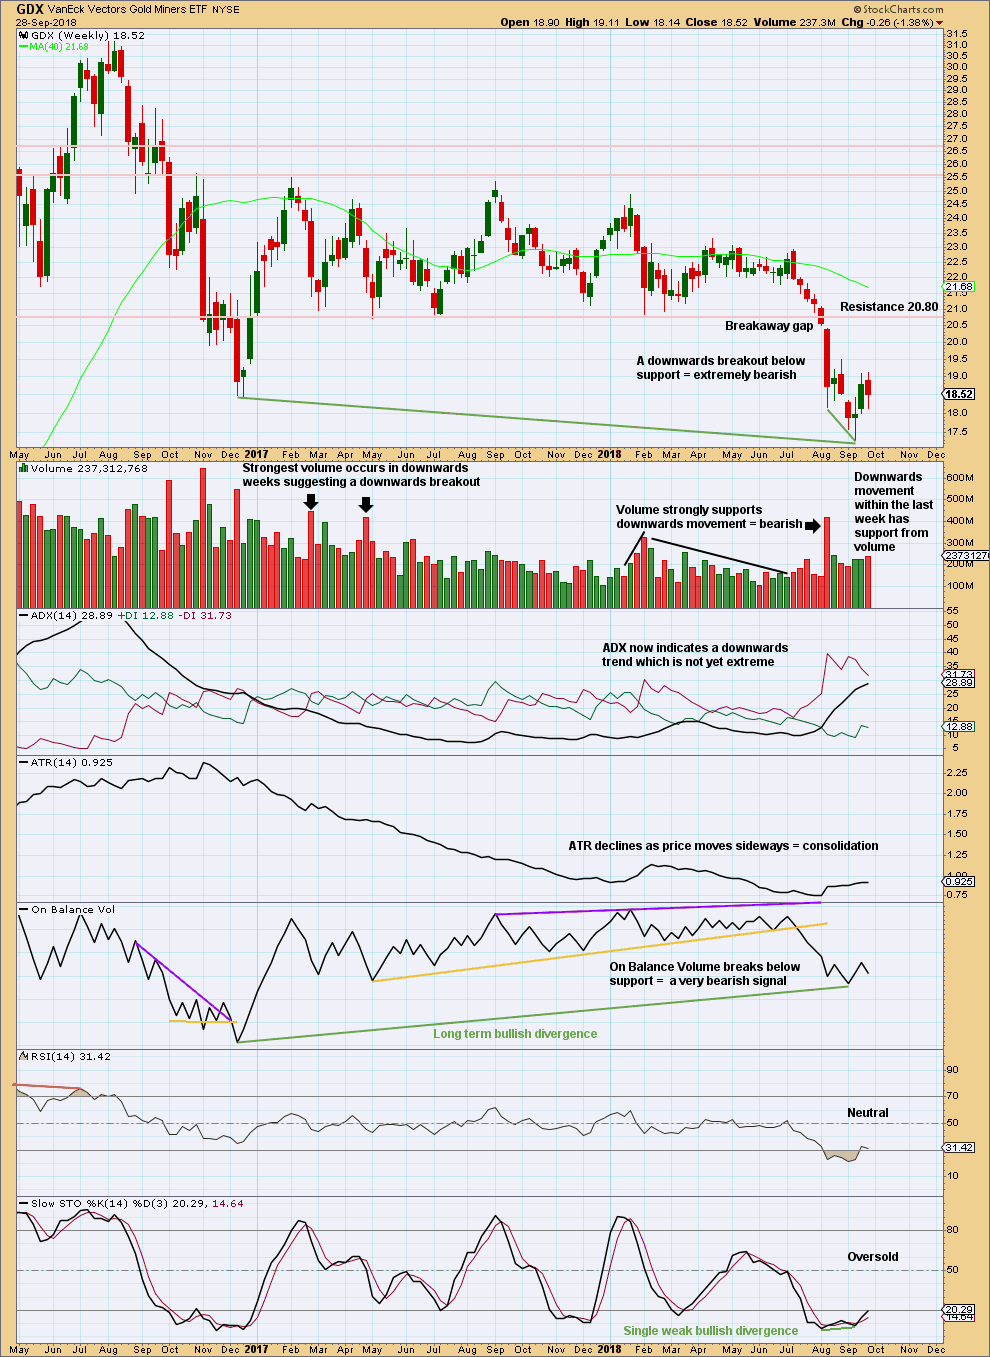
After a breakout, a technical principle is the longer that price consolidates sideways the longer the resulting trend may be expected to be. Also, the longer that price meanders sideways the more energy may be released after a breakout. This is what has happened for GDX.
A target for this downwards trend to end calculated using the measured rule is at 16.02. That is not yet met.
At the weekly chart level, there is a clear downwards breakout with a breakaway gap. As breakaway gaps should not be closed, they may be used to set stops that may be set just above a downwards breakaway gap.
The bullish divergence between price and On Balance Volume noted with green trend lines is also not a strong signal. On Balance Volume is a leading indicator; when it leads, it offers a signal, but it does not always lead price.
There is short term bullish divergence between price and Stochastics. A consolidation may develop here to relieve extreme conditions. The small bounce of the last two weeks has not yet lasted long enough to relieve extreme conditions, so it may continue either higher or sideways.
GDX DAILY CHART
Click chart to enlarge. Chart courtesy of StockCharts.com.
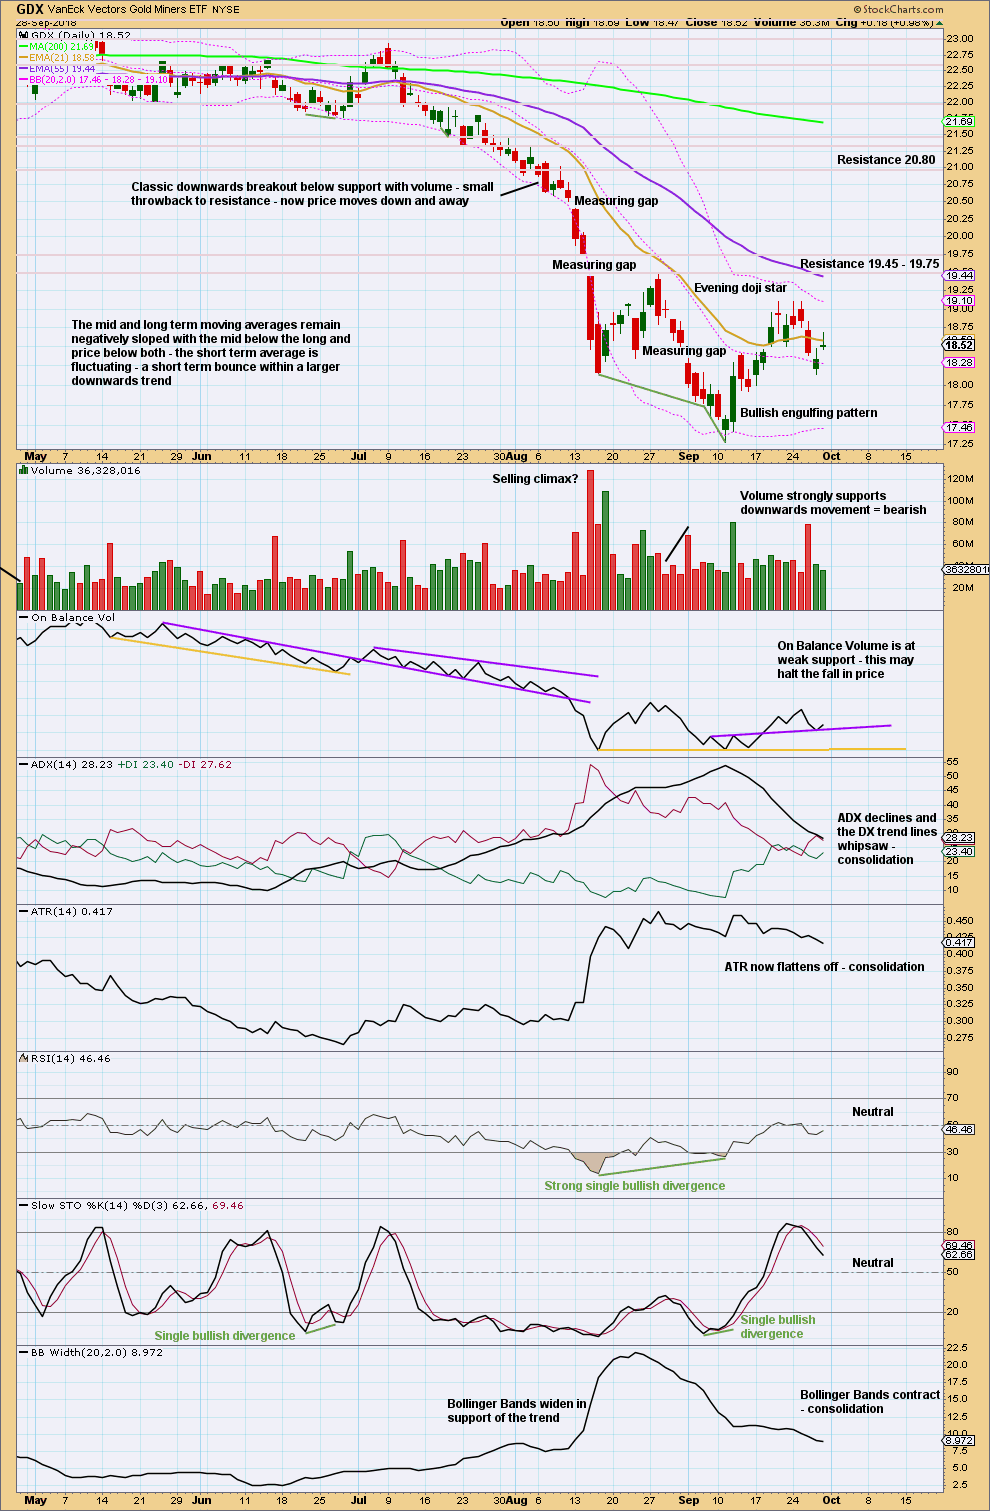
Price is consolidating after a strong downwards trend. Resistance is about 19.45 – 19.75. Support may be about 17.28. Expect price to swing from resistance to support and back again, and to not move in a straight line within each swing. Consolidations are characterised by very choppy overlapping movement.
At this time, expect a downwards swing to support to overall continue next week.
Published @ 12:30 a.m. EST on 29th September, 2018.
—
Careful risk management protects your trading account(s).
Follow my two Golden Rules:
1. Always trade with stops.
2. Risk only 1-5% of equity on any one trade.
I’m going to label minuette wave (ii) as an incomplete double zigzag. Incomplete because I would expect it to last a little longer and move a little higher to test resistance.
The expectation is still for it to reach up to the 0.618 Fibonacci ratio.
And then, down and away.
Thanks Lara. I know you are not getting too many comments on the gold site. The calm before the storm me thinks. I like the variety of charts and level of detail that you have put into this. It could go either way. A spike down might be the buy of a lifetime and a move up could happen at any time. The trigger of 1203.5 or so could be knifed through during after market hours so it is difficult to wait on the sidelines if you believe this is going up.
The silver market seems to have broken its downtrend (for now anyhow) and it is moving opposite to gold right now. Both gold and silver speculators are still net short. Gold specs actually added to their short net position this Friday 9/28. This was reported Friday for positions on Tuesday 9/25. The commercials (banks, jewelers, those in the know) have been adding to their long position. We can be fairly confident that they exited more shorts in the move down from 1203 to 1182 or so. So we should be in the most bullish (for gold bulls) position for a rally if we go by the COTs (more bullish than anytime in the last 17 years or so). Any moves down would only see the commercials add to their longs and specs add to their short positions in all likeliness.
With the upcoming P4 down in the $SPX on the plate one could envision a call from the govt. to stop raising rates. If the stock market correction (?) is bad enough or scary enough calls by politicians and the media to lower rates could light a fire under gold. During this time the specs who are net short will be buying back gold and silver to cover while during the same time there is increased investment demand from the public. This along with the issues in Italy/Iran/Argentina could put gold into the perfect storm.
Just ranting a bit. Keep up the good work and please keep up your vigilance on this as it may be another 2016 all over again. ETF’s like JNUG moved up 10 times from its low to peak in six months or thereabouts during the 2016 rally. One can’t really guess what this rally will be like but it would be nice to think we could have another 10 bagger on JNUG. Picking the optimum entry is the trick of course as this is a leveraged bet so not suggesting anyone to buy until you call the coast clear.
Thanks Keenan for the comment.
I have noticed that when Gold is trending down the membership is quiet, when it trends up the membership is more active. I expect it is a function of how easily members can profit in this market. It seem many cannot profit from going short on Gold.