
Last week’s analysis expected an upwards week as price swings from support up to resistance.
Summary: The Elliott wave structure for intermediate wave (4) does not look complete. It may continue sideways now for another 7 weeks.
For the short term, it looks like upwards movement may halt about here and a small zigzag down may unfold next week. However, there is no reversal signal at this week’s high, so it must be accepted that the upwards swing may not end here; if it continues, it could make a new high above 75.26 but the first target is at 73.10.
The larger trend remains upwards, so pullbacks may be used as opportunities to join the trend.
Always practice good risk management as the most important aspect of trading. Always trade with stops and invest only 1-5% of equity on any one trade. Failure to manage risk is the most common mistake new traders make.
New updates to this analysis are in bold.
MAIN WAVE COUNT
MONTHLY CHART
Click chart to enlarge.
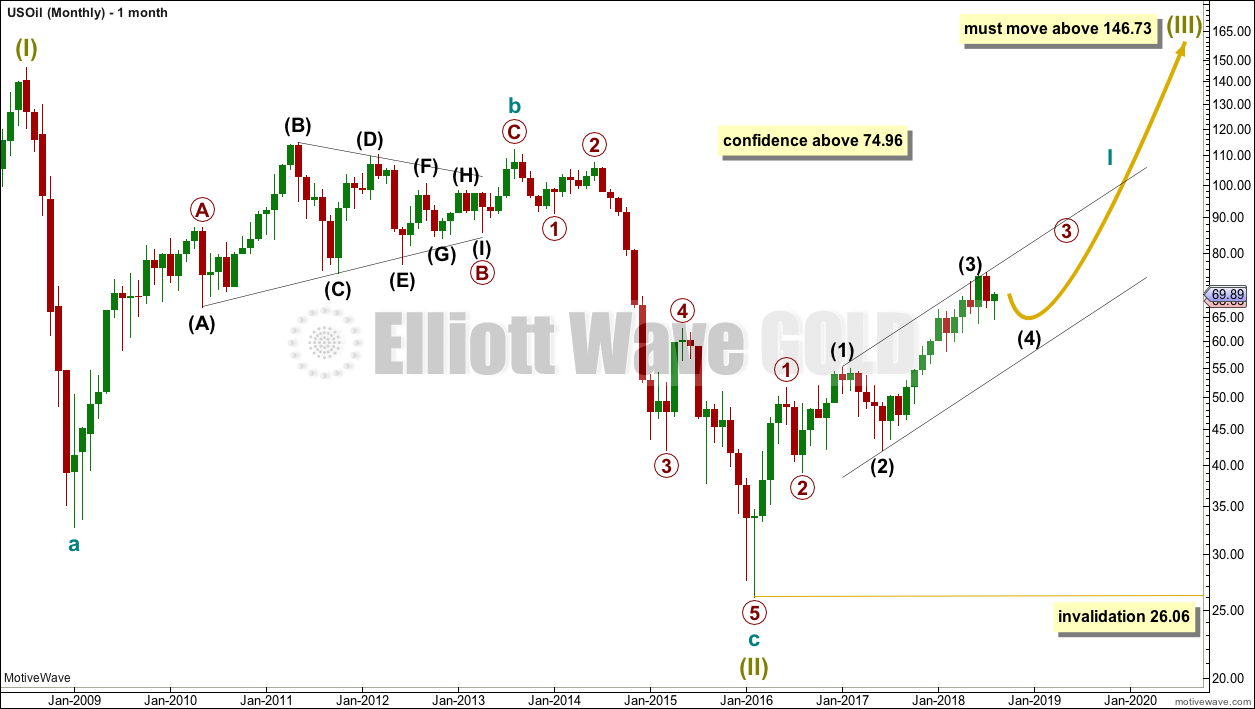
The bear market for US Oil looks to be over and a new bull market looks to be in its early stages. The prior bearish wave count has been invalidated, leaving only this very bullish wave count.
A huge zigzag down to the last low may be complete and is labelled here Super Cycle wave (II).
Cycle wave b must be seen as complete in August 2013 for this wave count to work. It cannot be seen as complete at the prior major swing high in May 2011.
Cycle wave b is seen as a zigzag, and within it primary wave B is seen as a running contracting triangle. These are fairly common structures, although nine wave triangles are uncommon. All subdivisions fit.
Primary wave C moves beyond the end of primary wave A, so it avoids a truncation. But it does not have to move above the price territory of primary wave B to avoid a truncation, which is an important distinction.
If cycle wave b begins there, then cycle wave c may be seen as a complete five wave impulse.
Super Cycle wave (III) must move beyond the end of Super Cycle wave (I). It must move far enough above that point to allow room for a subsequent Super Cycle wave (IV) to unfold and remain above Super Cycle wave (I) price territory.
Cycle wave I may be incomplete. It may be unfolding as an impulse and may have now moved through the middle portion. Commodities have a tendency to exhibit swift strong fifth waves, and this tendency is especially prevalent for third wave impulses. Intermediate wave (5) to end primary wave 3 may be very swift and strong, ending with a blow off top.
When cycle wave I is complete, then cycle wave II may be a deep correction that may not move beyond the start of cycle wave I below 26.06.
Data from FXCM for USOil does not go back to the beginning of Super Cycle wave (I). Without an accurate known length of Super Cycle wave (I) a target cannot be calculated for Super Cycle wave (III) to end using Fibonacci ratios. The target for Super Cycle wave (III) may be calculated when cycle waves I, II, III and IV within it are complete. That cannot be done for many years.
WEEKLY CHART
Click chart to enlarge.
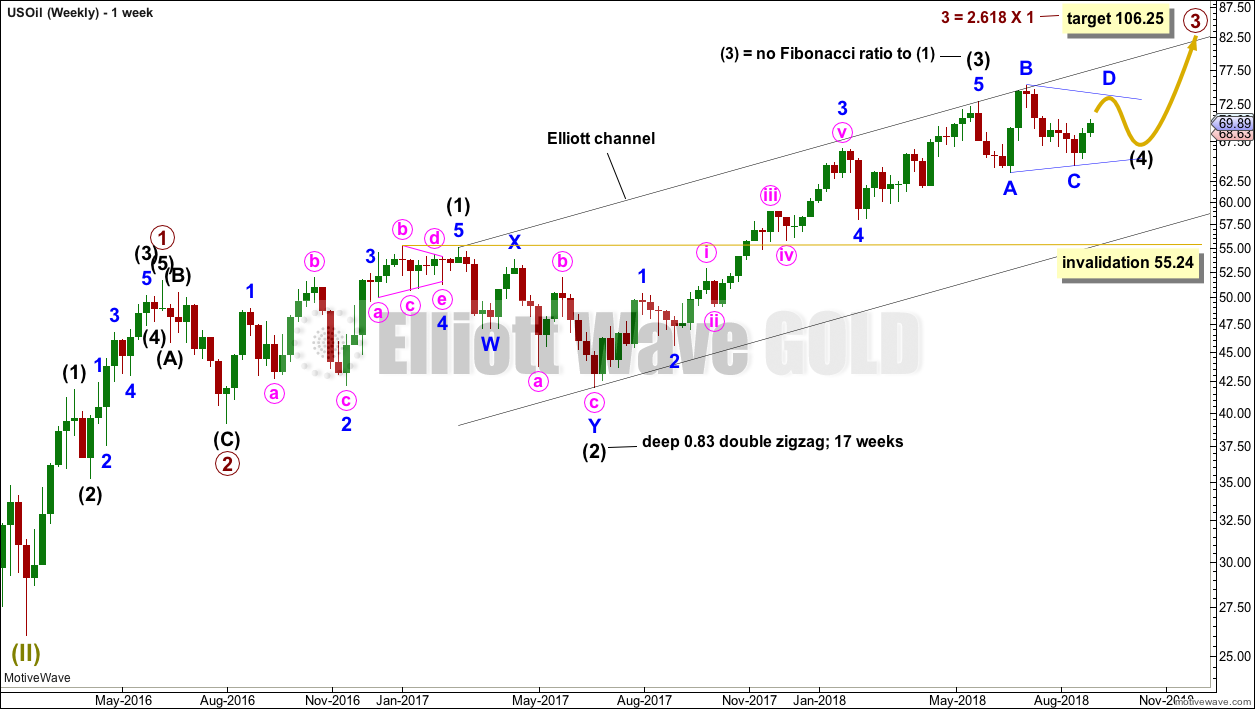
Intermediate wave (3) may now be complete. There is no Fibonacci ratio between intermediate waves (1) and (3), and intermediate wave (3) is longer than 1.618 the length of intermediate wave (1).
This wave count fits with classic technical analysis at the monthly and daily chart levels.
Intermediate wave (2) was a deep double zigzag. Given the guideline of alternation, intermediate wave (4) may be expected to most likely be a shallow flat, triangle or combination. It may be about even in duration with intermediate wave (2), or it may be a little longer because triangles and combinations are more time consuming structures.
Intermediate wave (4) has now lasted 14 weeks. At the daily chart level, at this stage, I cannot see it as a complete corrective structure. The next expectation will now be for it to possibly complete in a further 7 weeks to total a Fibonacci 21. It may not exhibit a Fibonacci duration though (this is a rough guideline only).
Intermediate wave (4) may find support about the lower edge of the black Elliott channel. It may end within the price territory of the fourth wave of one lesser degree; minor wave 4 has its territory from 66.65 to 59.13.
At this stage, only two structural options fit for intermediate wave (4) at the daily chart level: a triangle and a combination. They are both equally valid and have about an even probability.
Because the last wave down to support, ending on the 16th of August, now looks like a complete structure and will only subdivide as a three, it cannot be wave C of a flat correction. For this reason, a flat correction at this time does not fit and has been discarded.
COMBINATION
Click chart to enlarge.
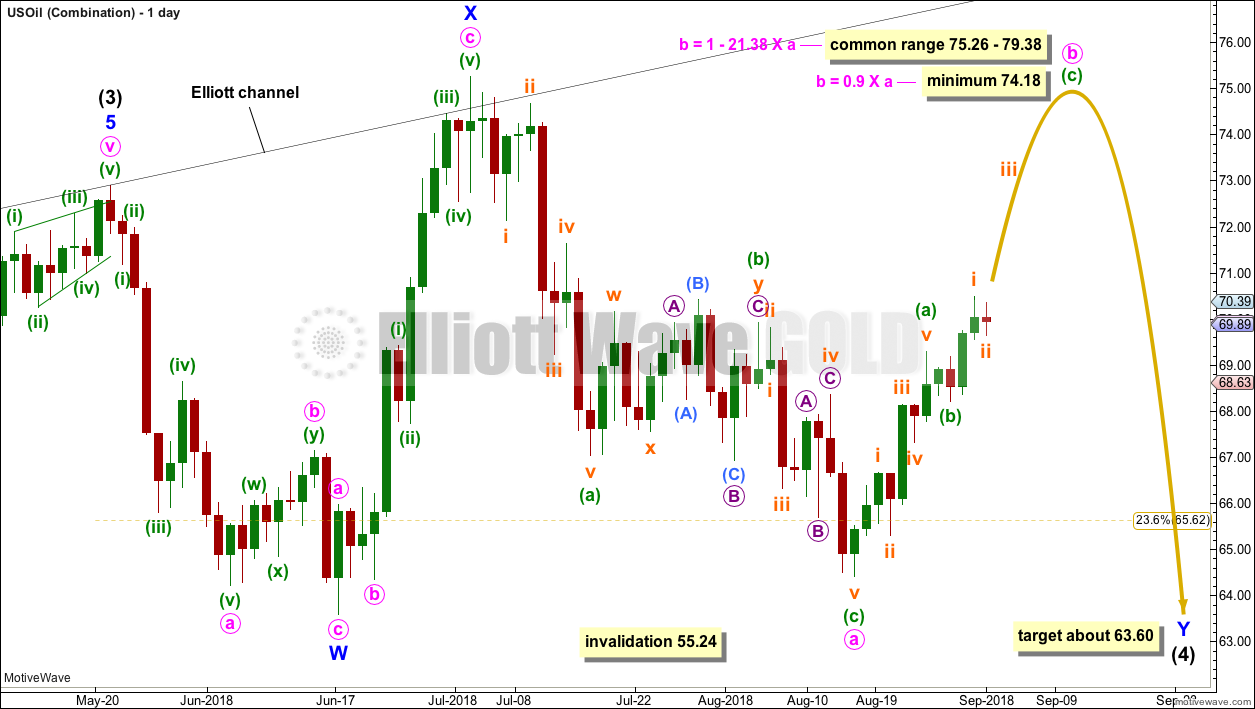
Intermediate wave (4) may be unfolding as a double combination.
The first structure in a double combination may be a complete zigzag labelled minor wave W. There is a little disproportion within minute wave a between the corrections of minuette waves (ii) and (iv), but this is slight enough to be acceptable for this market.
The double is joined by a complete three in the opposite direction, a zigzag labelled minor wave X. X waves within combinations have no minimum nor maximum allowable length, and may make new price extremes beyond the start of wave W as this one does. The only guideline in terms of depth for X waves is that they are normally very deep.
The second structure in a double combination would most likely be a flat correction as the two most common structures in a double combination are one zigzag and one flat.
Within a possible flat correction for minor wave Y, minute wave a looks like a completed three. Minute wave b must now retrace a minimum 0.9 length of minute wave a, and it may move beyond the start of minute wave a as in an expanded flat. Minute wave b should exhibit clear weakness, should exhibit lack of support from volume, and at its end should exhibit some divergence between price and either or both of Stochastics and RSI.
Minute wave b may be subdividing as a single zigzag as labelled, or it may continue as a double zigzag. Both of these structures usually have sharp corrections with steep slopes; they both have the same look.
When minute wave b is complete, then minute wave c would need to end at least slightly below the end of minute wave a at 64.43 to avoid a truncation.
The purpose of the second structure in a double combination is to take up time and move price sideways. To achieve this purpose minor wave Y would be most likely to end about the same level as minor wave W about 63.60.
TRIANGLE
Click chart to enlarge.
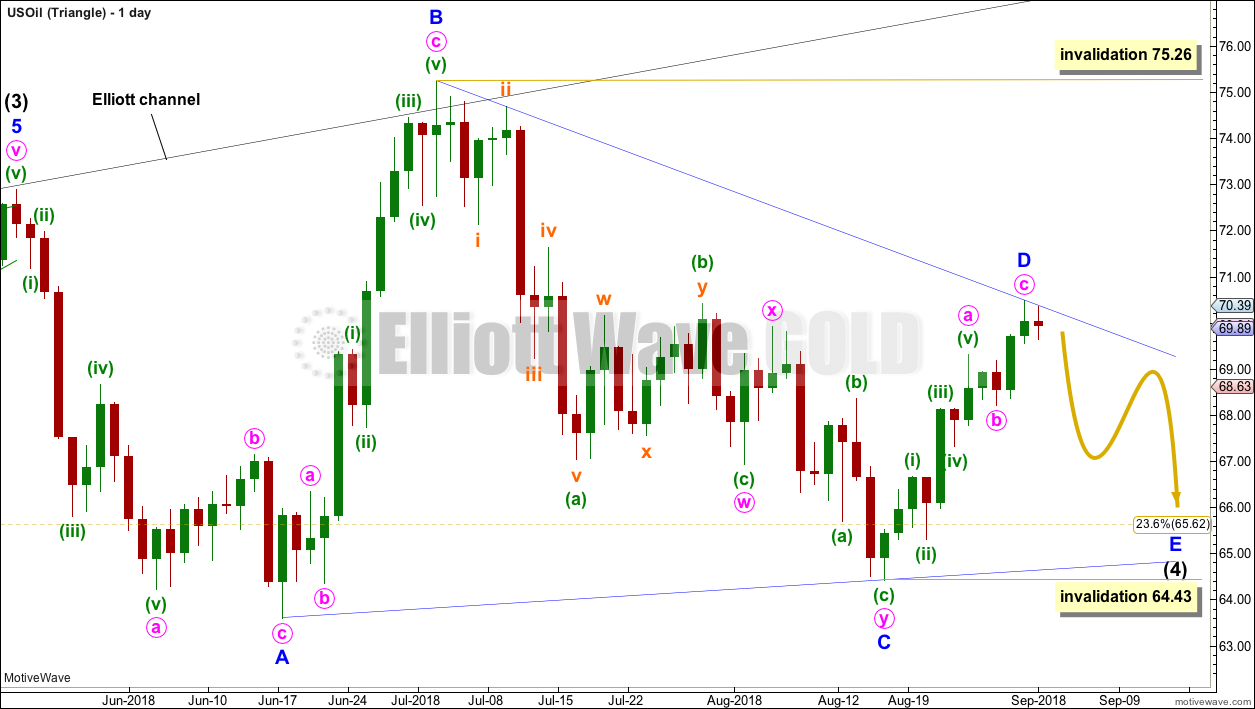
Intermediate wave (4) may be unfolding as a triangle.
Minor wave A is seen as a single zigzag, which has a reasonable look. Minor wave B is also seen as a single zigzag.
Minor wave C may have been a complete double zigzag, which has a very good fit. C waves are the most common triangle sub-waves to subdivide as a multiple, so this labelling fits with a common pattern.
Minor wave D may now be a complete zigzag that has some support this week from classic technical analysis. However, there is no sign of a reversal here, so it must be accepted that minor wave D may also move higher. If it does continue higher, then a reasonable target for it to end would be at 73.10 where minute wave c would reach equality in length with minute wave a. This target would still see the B-D trend line have a reasonable slope and the triangle would have the right look.
Minor wave D within a contracting triangle may not move beyond the end of minor wave B above 75.26. The A-C trend line has a shallow slope, so the upper B-D trend line should have a reasonable slope for the triangle trend lines to have a reasonable rate of convergence. A contracting triangle would have a sloping B-D trend line, so this looks most likely.
Minor wave D within a barrier triangle may end about the same level as minor wave B at about 75.26, so that the B-D trend line is essentially flat. A barrier triangle here would not produce triangle trend lines that converge at a reasonable rate. This would not have the right look. A barrier triangle looks unlikely.
When minor wave D is a complete zigzag, then a final zigzag down for minor wave E would most likely end reasonably short of the A-C trend line. Minor wave E may not move beyond the end of minor wave C below 64.43.
TECHNICAL ANALYSIS
MONTHLY CHART
Click chart to enlarge. Chart courtesy of StockCharts.com.
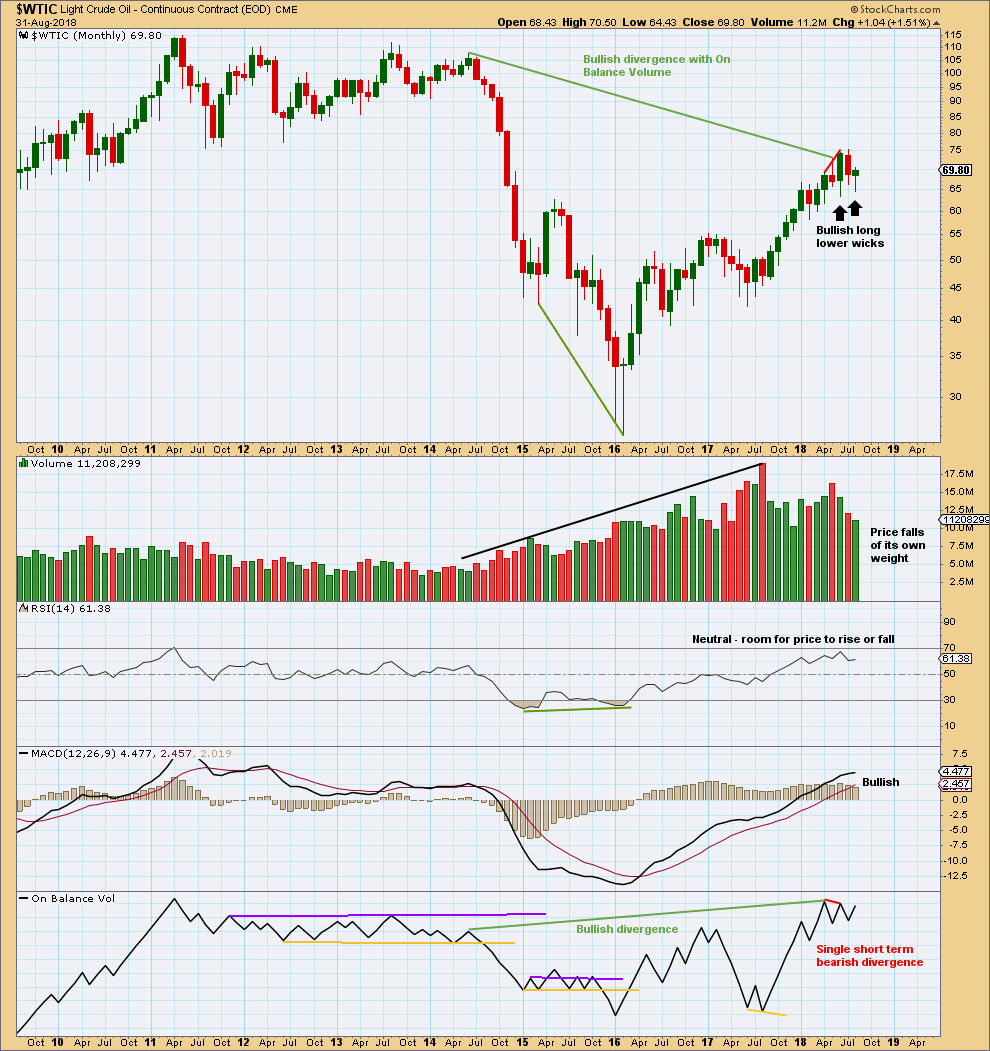
The short term volume profile is bearish: the strongest month in the last few months was the downwards month of May (where the balance of volume was down) and now June shows a decline in volume, so volume has not supported upwards movement here.
July and now also August saw another red monthly candlestick with the balance of volume downwards, but the market fell of its own weight; it was not supported by volume. This is not necessarily bullish, but it does point to a consolidation as somewhat more likely here.
For the short term, On Balance Volume is also slightly bearish. This supports the idea that price may be within a correction and not necessarily a continuation of the larger upwards trend.
However, it is entirely possible that this situation could reverse and volume could start to support upwards movement, as has happened back in January 2018.
The larger trend is upwards.
WEEKLY CHART
Click chart to enlarge. Chart courtesy of StockCharts.com.
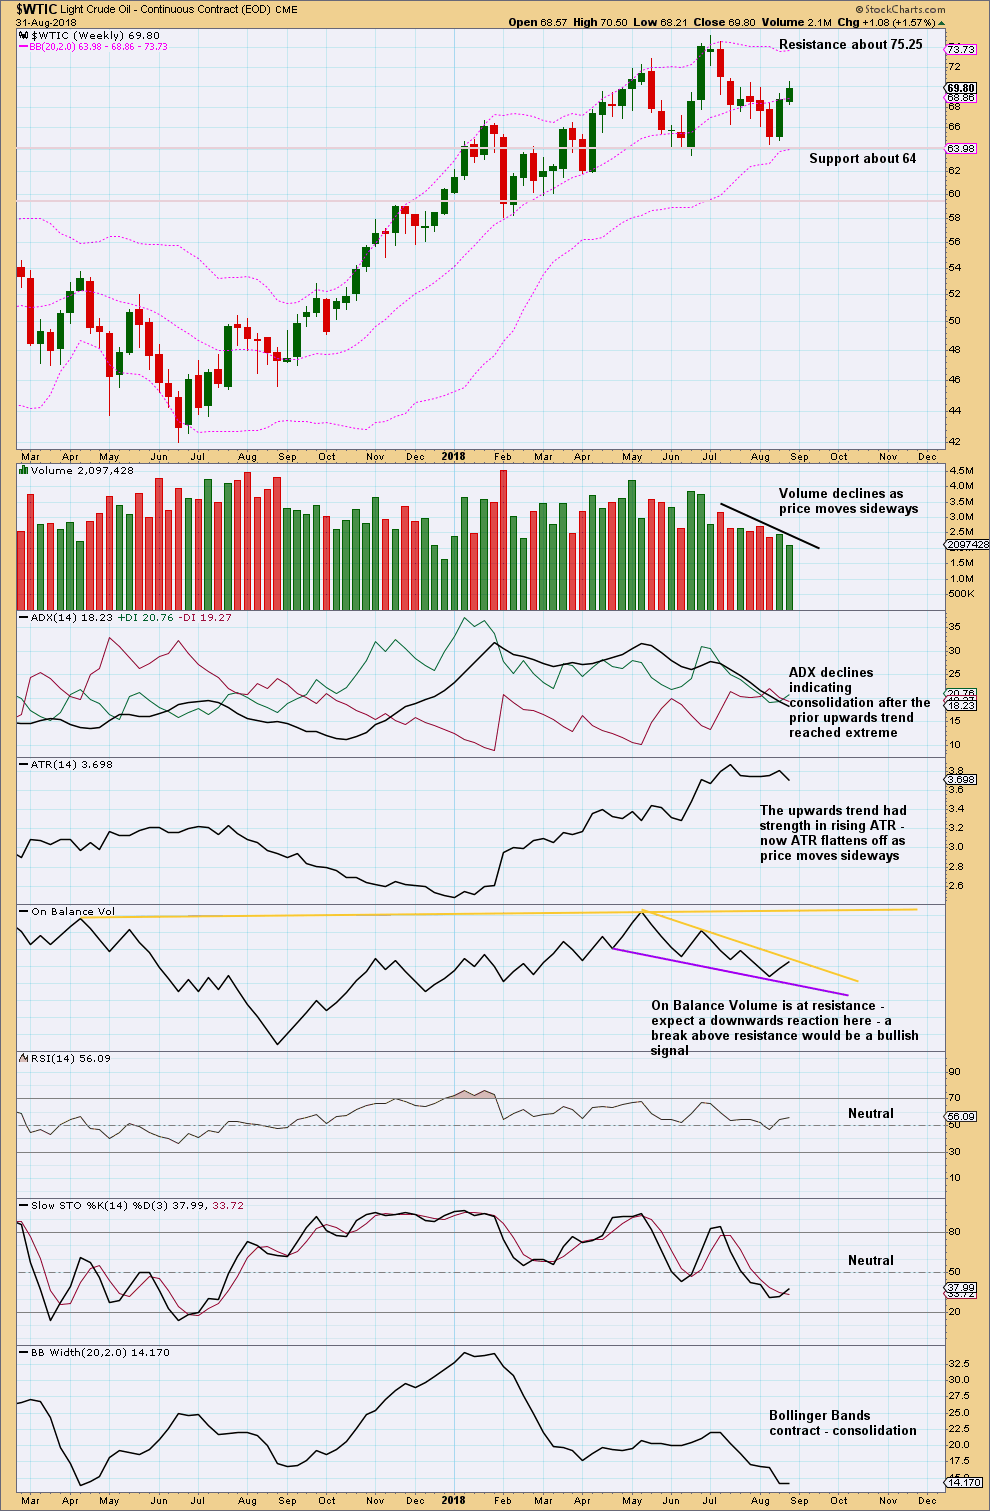
With declining volume now with upwards movement and On Balance Volume at resistance, it looks like upwards movement may end here.
A break above resistance here may favour the combination Elliott wave count.
DAILY CHART
Click chart to enlarge. Chart courtesy of StockCharts.com.
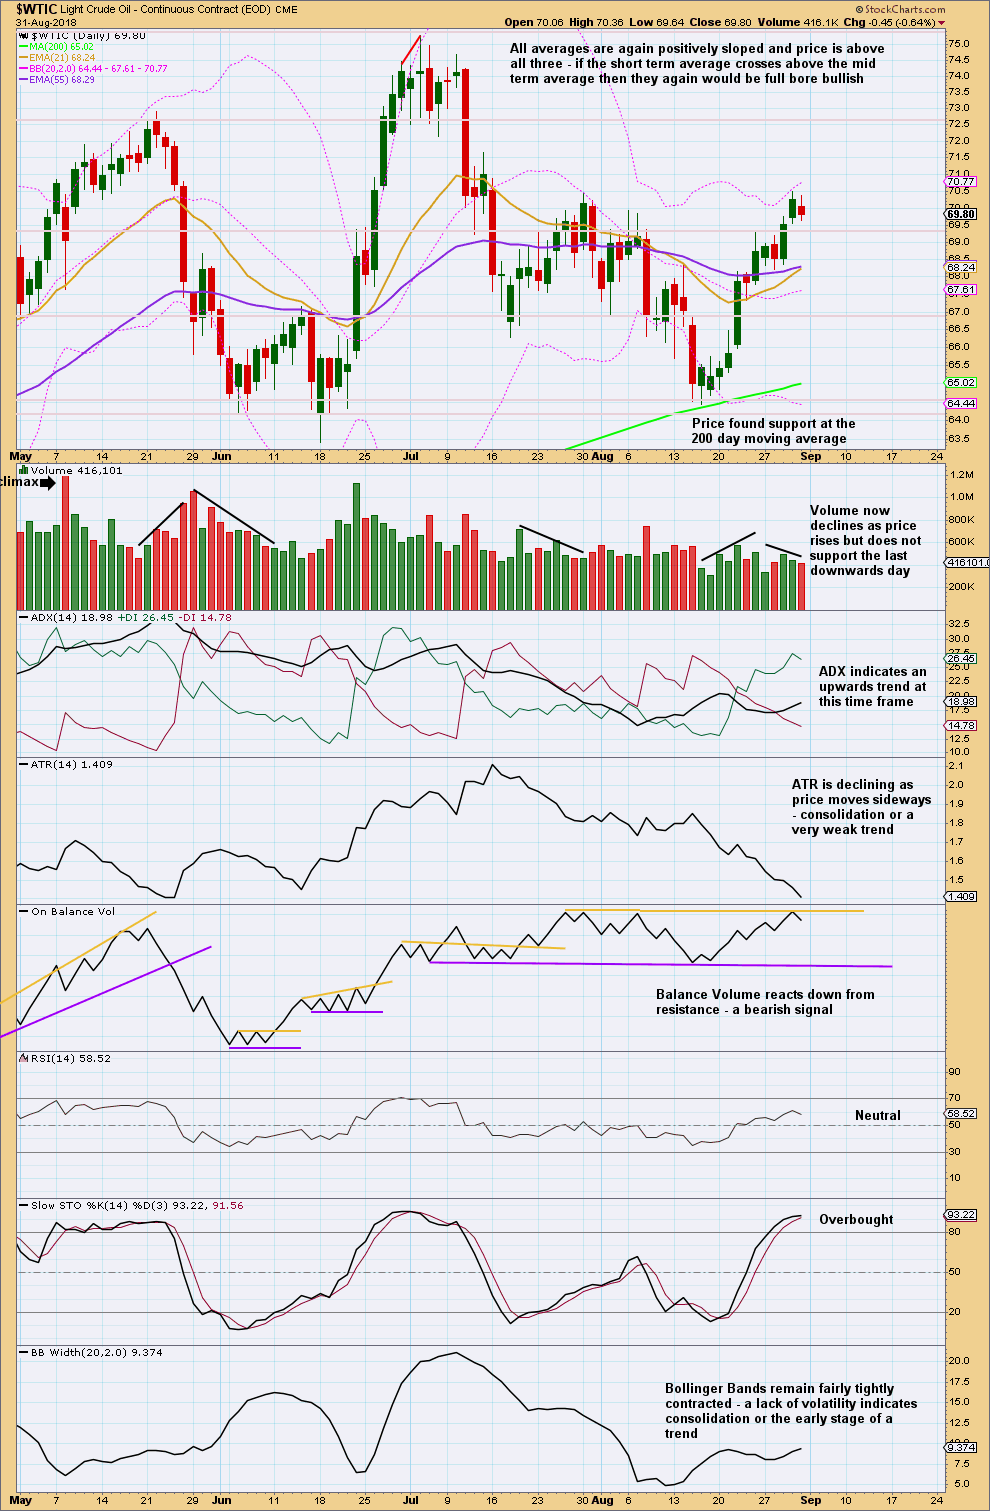
On Balance Volume may now find resistance at the yellow line. A break above this line would be a weak bullish signal. The line has only been tested three times, so it holds only weak technical significance.
With weak volume and Stochastics overbought and On Balance Volume at weak resistance, the upwards swing may end here. Or a sideways consolidation within the upwards swing may unfold before the swing can continue higher to resistance about 75.25.
Published @ 02:50 a.m. EST on 1st September, 2018.