
This is the last analysis prior to the Christmas / New Year break.
Next analysis will be done after market close for Monday, 4th January, 2016.
May you all have a very Merry Christmas and a Happy New Year!
Summary: The trend is down. The question is whether a small correction against the trend is over or not. The main wave count expects it is over, so this should remain the preferred wave count while price remains below the cyan trend line offering resistance on the daily chart. If that line is breached, use the Daily Alternate which expects the correction will move higher to 1,103 – 1,105. This target may be met in six days, if the correction totals a Fibonacci twenty one days. The time guide is rough only and may be too long. The second daily alternate is the ending diagonal idea for primary wave 5, and it too follows the same two ideas at the hourly chart level considering if the correction is over or not.
New updates to this analysis are in bold.
MAIN ELLIOTT WAVE COUNT
Click chart to enlarge.
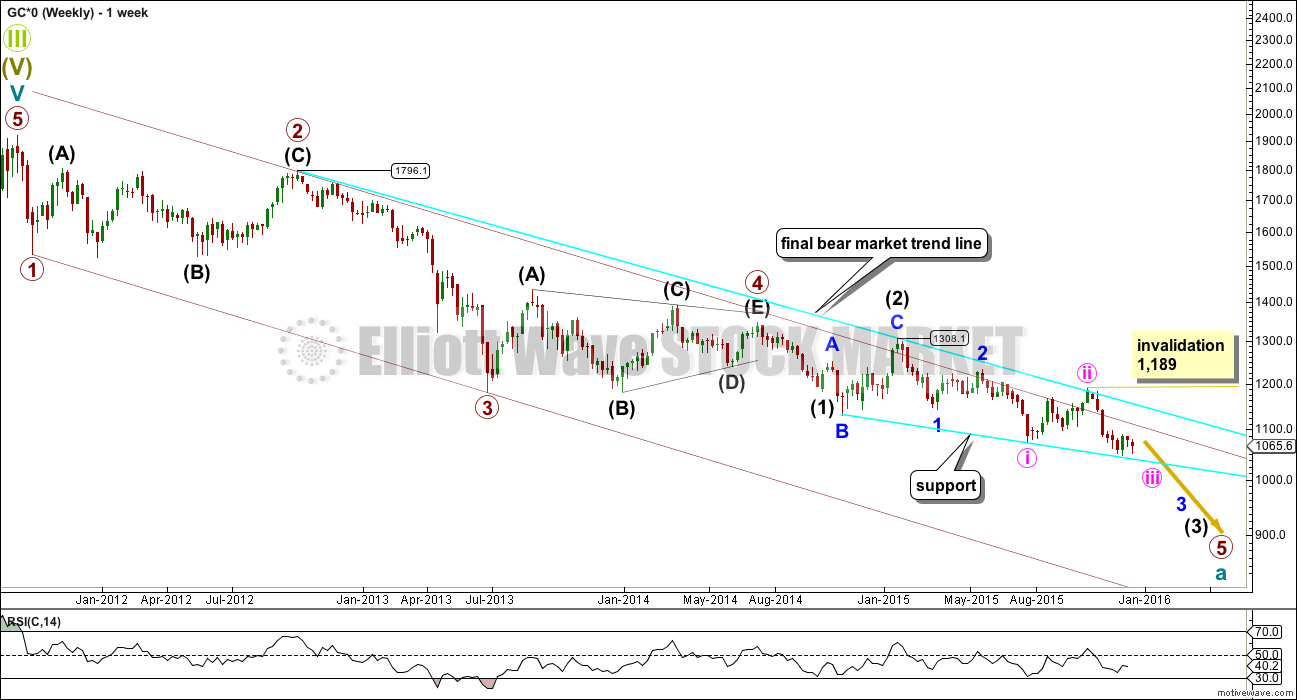
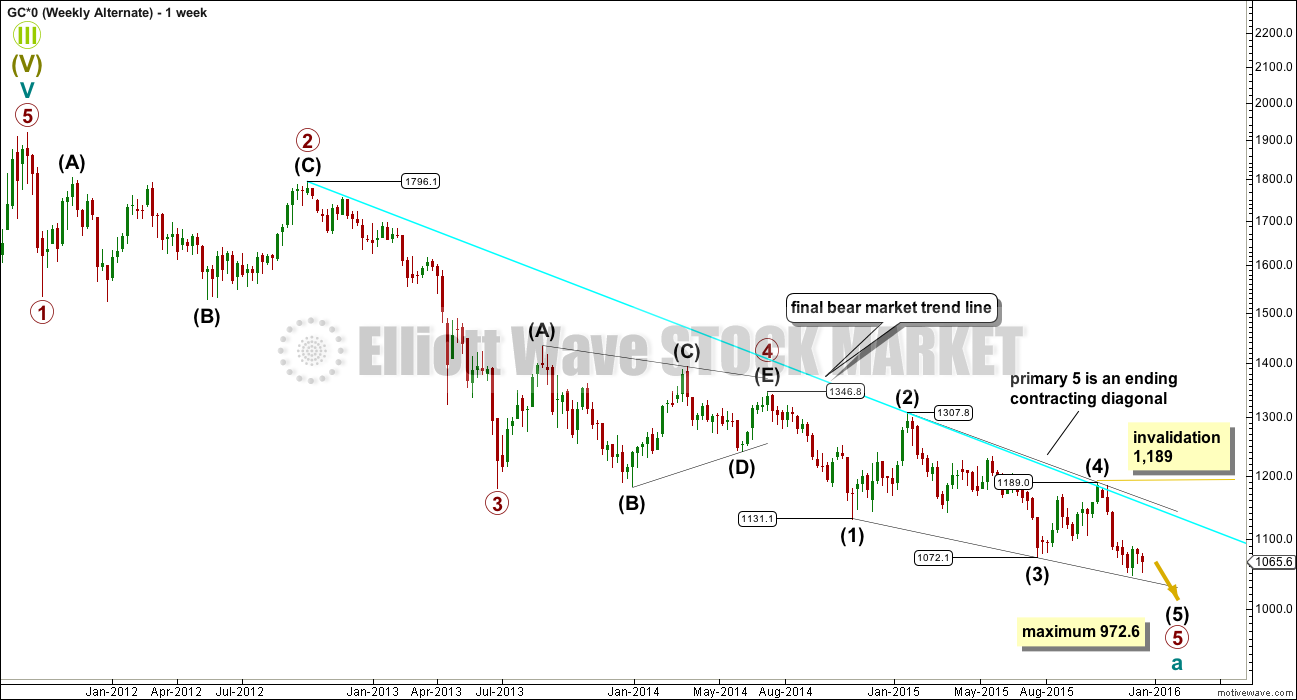
Gold has been in a bear market since September 2011. There has not yet been confirmation of a change from bear to bull, and so at this stage any bull wave count would be trying to pick a low which is not advised. Price remains below the 200 day moving average and below the cyan trend line (copied over to the daily chart). The bear market should be expected to be intact until we have technical confirmation of a big trend change.
A five wave impulse is unfolding lower from the all time high. The subdivisions all fit perfectly.
It is not possible to see primary wave 1 ending any earlier because it must be a five. Primary wave 2 was a deep 0.68 running flat lasting 53 weeks. Primary wave 3 was a perfect impulse and 12.54 short of 1.618 the length of primary wave 1. Primary wave 4 was a shallow 0.27 regular contracting triangle lasting 54 weeks. There is perfect alternation in depth and structure between primary waves 2 and 4. There is almost perfect proportion also, which gives the wave count a textbook perfect look at the weekly chart level. It is the proportion between the corrections of an impulse which give it the “right look”.
Within primary wave 5, there is some concern that intermediate wave (2), minor wave 2, and now minute wave ii are all much bigger and time consuming than these corrections at these degrees normally are. The alternate idea of an ending diagonal for primary wave 5 is considered for this reason.
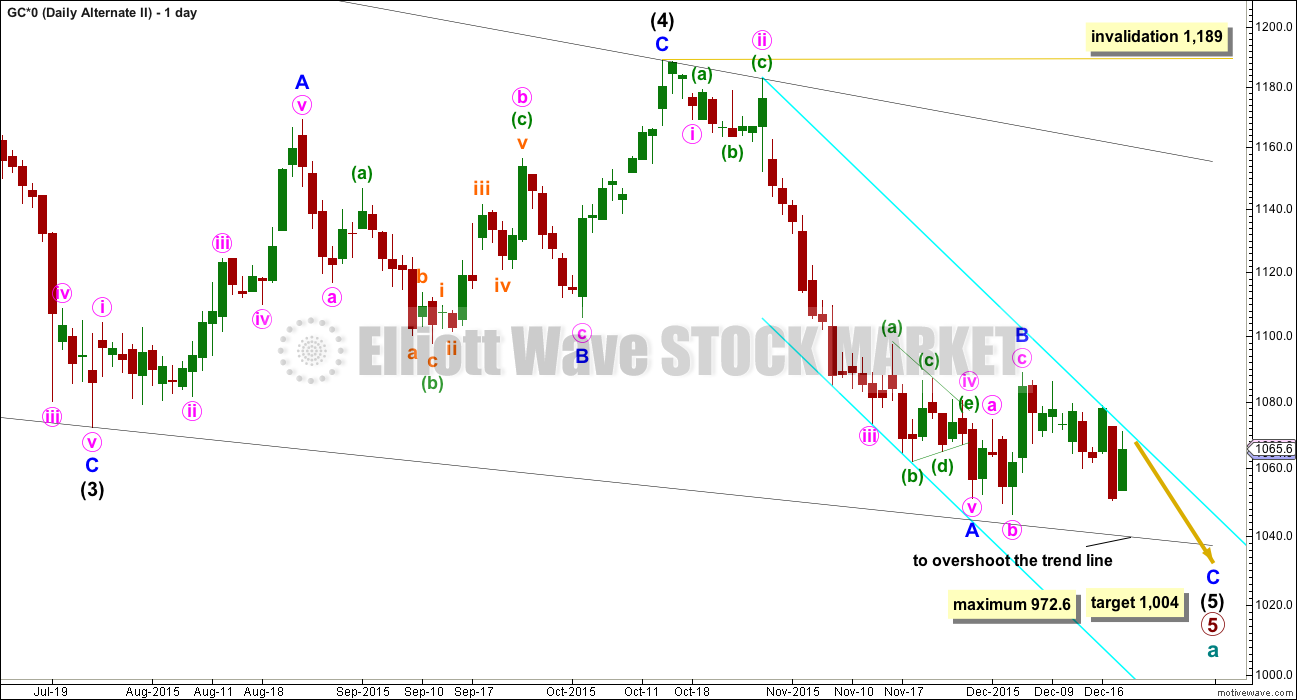
Click chart to enlarge.
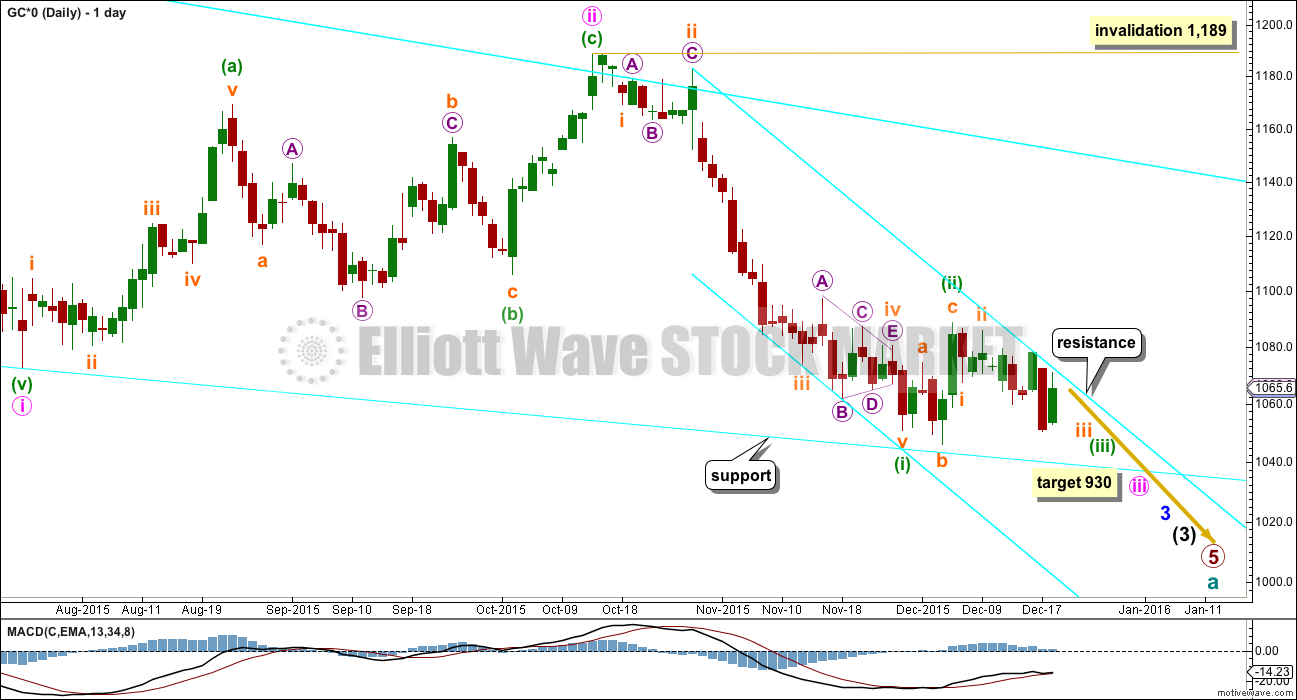
The final line of resistance (cyan line copied over from weekly charts) is only overshot and not so far properly breached. Simple is best, and the simplest method to confirm a trend change is a trend line.
Minute wave ii is a complete zigzag and deep at 0.73 the length of minute wave i.
At 930 minute wave iii would reach 1.618 the length of minute wave i.
Minuette wave (i) is complete.
This main wave count at the daily chart level looks at the possibility that minuette wave (ii) is over as a brief shallow expanded flat. There may now be enough of a strong downwards pull from the middle of a big third wave to force this correction to be more brief and shallow than second waves normally are. Because this main wave count expects a third wave down may be close to the strongest middle part, expect surprises to be to the downside.
I am drawing a best fit channel about this downwards movement in cyan. Along the way down, there will be small upwards corrections which may find resistance at the upper trend line. Expect that this main wave count is most likely correct while price remains below this trend line. If price breaks above that line, then use the daily alternate below.
Both hourly wave counts today will look at price movement since the high of 1,088 on 4th December, when minuette wave (ii) probably ended.
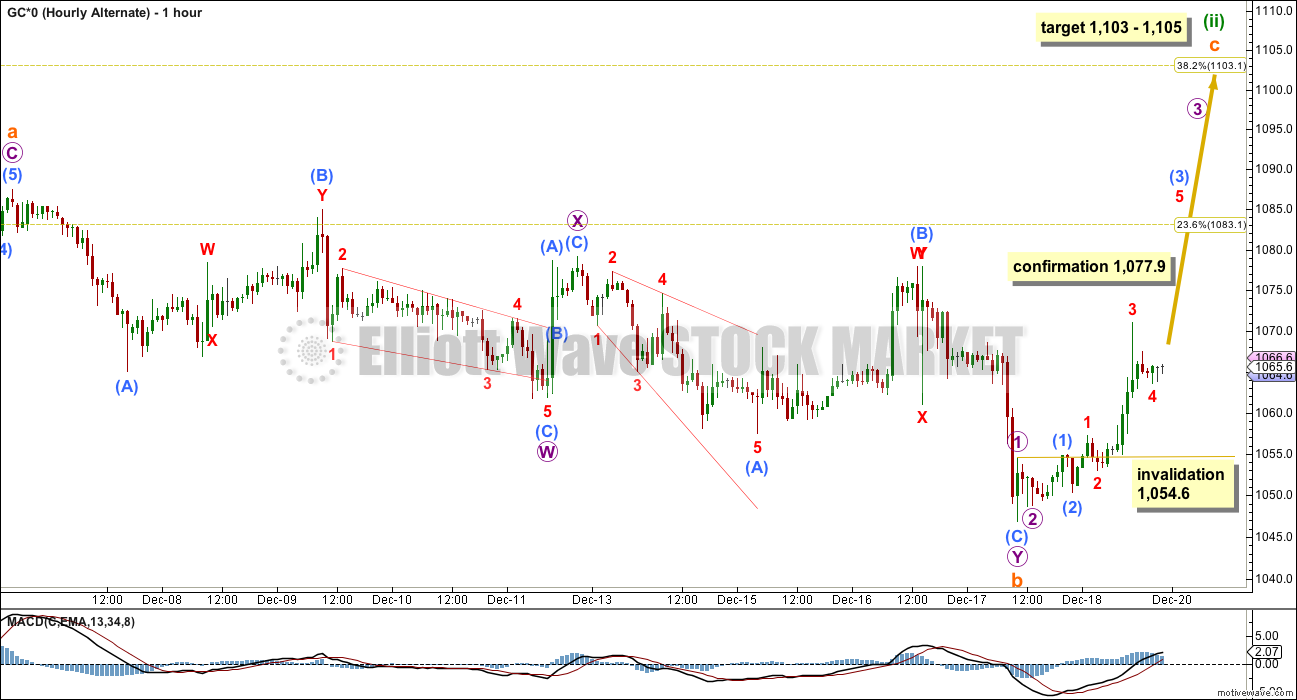
MAIN HOURLY WAVE COUNT
Click chart to enlarge.
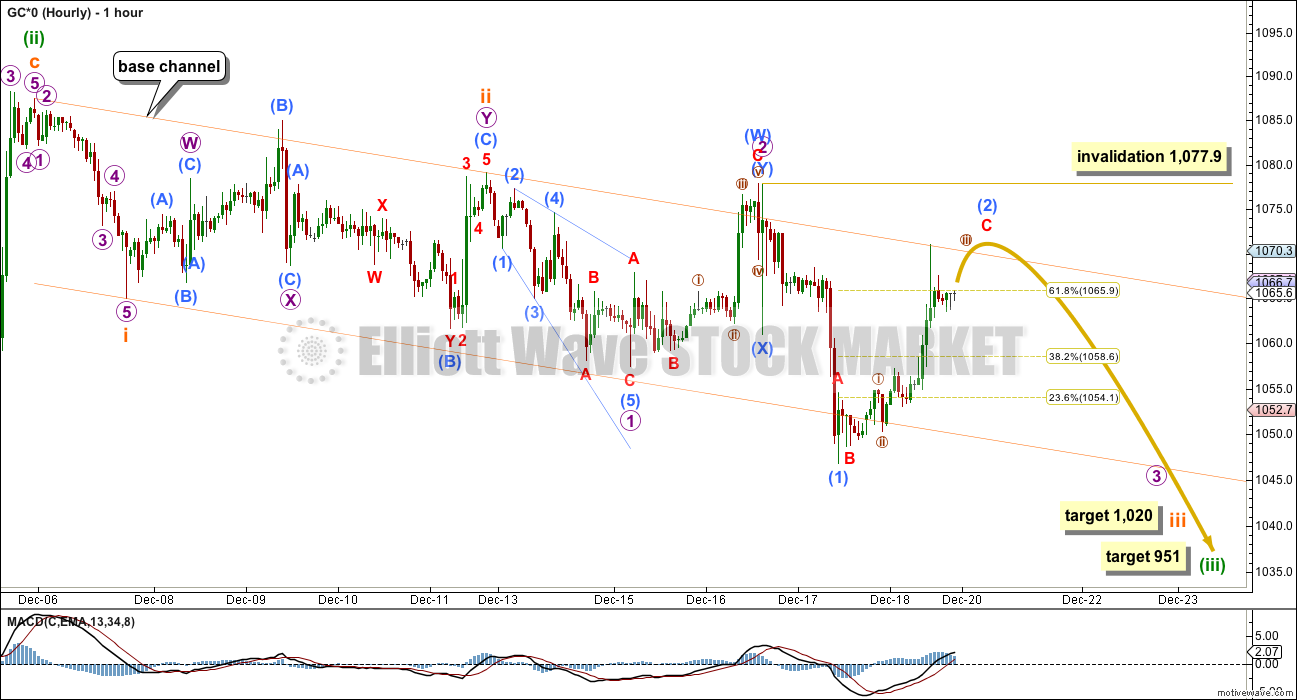
This wave count looks at minuette wave (ii) as a complete expanded flat.
Within minuette wave (iii), another first and second wave could also be complete for subminuette waves i and ii. Subminuette wave ii fits perfectly as a double combination.
Within subminuete wave iii, another first and second wave may be complete for micro waves 1 and 2. Micro wave 2 importantly ends at the second of a double top at 1,077.9. This means that the low of the price shock labelled submicro wave (X) is part of micro wave 2 and not a first wave down. This makes a difference to invalidation points, so makes a difference to risk.
The orange channel is a base channel about subminuette waves i and ii. A third wave should break out of a base channel about its first and second waves.
The lower edge of the base channel was breached, but price has moved back into the channel. Price is finding some resistance at the upper edge of the channel.
Another first wave for submicro wave (1) is complete. The structure for submicro wave (2) looks incomplete on the five minute chart and the hourly chart. It should move at least slightly higher but not beyond the start of submicro wave (1) above 1,077.9.
A new high above 1,077.9 would also mean price would breach the cyan trend line on the daily chart. If this happens, then the correction is clearly not over and price should continue higher for at least one day and most likely a few.
This main wave count should be preferred while price remains below 1,077.9.
At 1,020 subminuette wave iii would reach 2.618 the length of subminuette wave i. The strongest part of downwards movement may come when micro wave 5 to end subminuette wave iii arrives. Gold typically exhibits swift strong fifth waves, especially the fifth waves to end its third waves.
At 951 minuette wave (iii) would reach equality in length with minuette wave (i). Again, the fifth wave of subminuette wave v to end the impulse of minuette wave (iii) may be the strongest part of this downwards movement.
If price makes new lows and an impulse downwards is unfolding, then once the next five down is complete the invalidation points can start to be moved lower. When submicro wave (3) may be complete, then the invalidation point may move down to the low of submicro wave (1) at 1,046.8. The following correction for submicro wave (4) may not move into submicro wave (1) price territory.
Likewise, when subminuette wave iii may be complete, then the invalidation point for subminuette wave iv is at the low of subminuette wave i at 1,065.
To the downside on Monday, if price makes a new low below 1,054.6, then this wave count and its implications of a strong third wave down must be taken very seriously. If that happens, then along the way down use the cyan trend line on the daily chart as a guide to where corrections should find resistance. If that line holds, then each time it is touched it offers an opportunity to join the trend.
ALTERNATE DAILY WAVE COUNT
Click chart to enlarge.
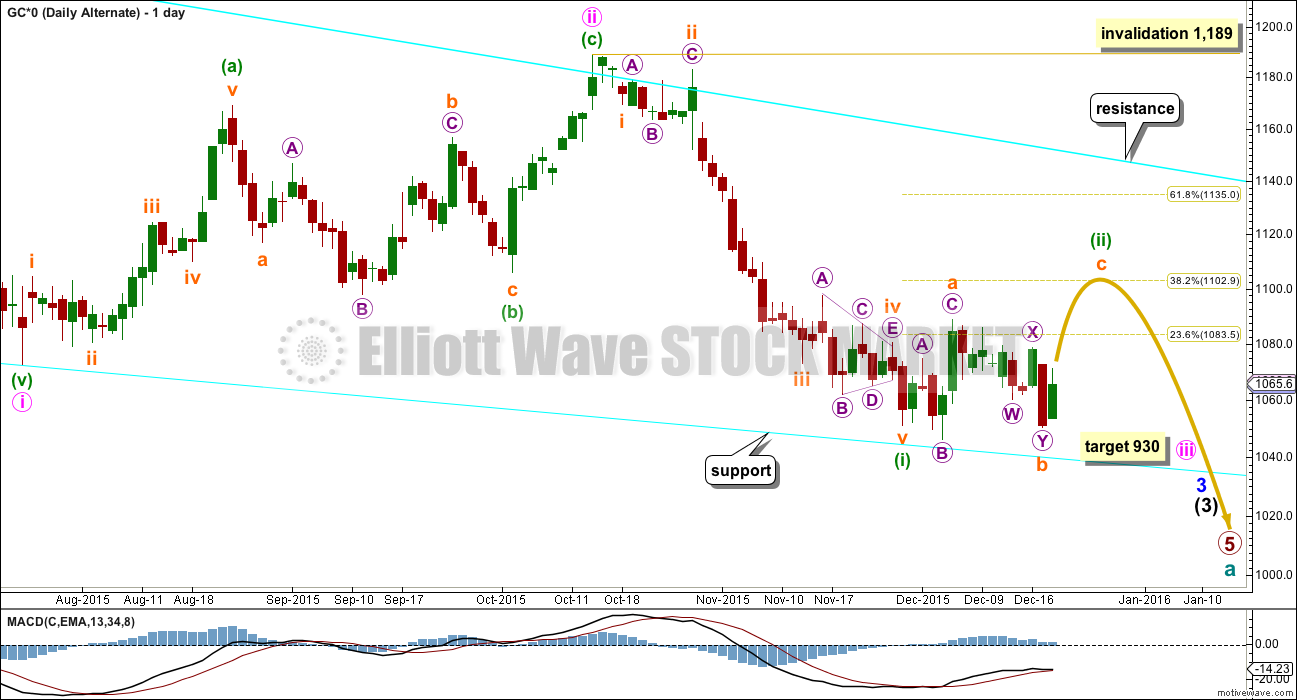
This wave count is identical to the main daily wave count up to the low labelled minuette wave (i).
Thereafter, it looks at the possibility that minuette wave (ii) is not over. This would still see minuette wave (ii) a relatively shallow correction (most likely), but it may be not as quick as the main wave count expects.
Minuette wave (ii) again fits as an expanded flat correction. The first expanded flat may have been a three wave structure for subminuette wave a. Subminuette wave b will fit as a double zigzag and is a 1.06 length of subminuette wave a. This is within the normal range of 1 to 1.38 and just longer than the minimum for an expanded flat which is 1.05.
Expanded flats normally have C waves which move a reasonable distance beyond the end of their A waves. If subminuette wave c takes price up to about the 0.382 Fibonacci ratio then minuette wave (ii) would still be relatively shallow but not as shallow as the main wave count expects. The expanded flat would have a typical look.
The target for minute wave iii is still the same. At 930 it would reach 1.618 the length of minute wave i.
If the target for subminuette wave c is wrong and is too low, then look for price to find resistance at the upper cyan trend line copied over from the weekly chart.
ALTERNATE HOURLY WAVE COUNT
Click chart to enlarge.
I have found a solution for subminuette wave b, as a double zigzag. At 1.06 the length of subminuette wave a, the minimum for an expanded flat was met and passed.
At 1,105 subminuette wave c would reach 1.618 the length of subminuette wave a. This is close to the 0.382 Fibonacci ratio at 1,103, so it gives a $2 target zone for this correction to end.
If price breaks above 1,077.9, then this should be the preferred wave count. The main wave count would be invalidated.
Subiminuette wave c may only subdivide as one of two structures, either an impulse (more likely) or an ending diagonal (less likely). So far it looks like an impulse may be unfolding. If a diagonal unfolds, then it may possibly be time consuming enough to last six days in order for minuette wave (ii) to end in a total Fibonacci twenty one days.
I cannot see a complete five up so far on the five minute chart. There is a series of short first waves and overlapping second waves that need a series of third waves to end and their corresponding fourth waves.
Once an impulsive count up can be seen (an impulsive count is any count of five plus multiples of four which represent extensions, so an impulsive count is any of 5, 9, 13 etc.), then look out for the end of subminuette wave c. Once there is more structure within subminuette wave c, then draw a channel about it. A channel about the C wave should be used to indicate when the correction is over because expanded flats don’t fit well within channels. Once a reasonable channel can be drawn about subminuette wave c, then look for a subsequent breach of that channel to indicate subminuette wave c and so minuette wave (ii) as over.
Subminuette wave c should move at least slightly above the end of subminuette wave a at 1,074.6 to avoid a truncation and a very rare running flat.
Micro wave 4 may not move into micro wave 1 price territory below 1,054.6. If this price point is breached Monday or Tuesday, then the main wave count would be confirmed.
SECOND ALTERNATE ELLIOTT WAVE COUNT
Click chart to enlarge.
I am aware that this is the wave count which EWI and Danerics have. The implications are important, so I will follow this wave count daily for members here too.
Everything is the same up to the end of the triangle for primary wave 4. Thereafter, primary wave 5 is seen as an ending contracting diagonal.
Within the ending contracting diagonal, it is not possible to see intermediate wave (2) as a zigzag and meet all Elliott wave rules. To see an explanation of why see this video at 10:25. (I have checked this structure again with COMEX data and it still violates the rule).
The same problem exists for the ending diagonal of primary wave 5 itself. Intermediate wave (3) is longer than intermediate wave (1) which would suggest an expanding diagonal, but intermediate wave (4) is shorter than intermediate wave (2) and the trend lines converge which suggests a contracting diagonal.
From “Elliott Wave Principle” by Frost and Prechter, 10th edition, page 88: “In the contracting variety, wave 3 is always shorter than wave 1, wave 4 is always shorter than wave 2, and wave 5 is always shorter than wave 3. In the expanding variety, wave 3 is always longer than wave 1, wave 4 is always longer than wave 2, and wave 5 is always longer than wave 3.”
This structure violates the rules for both a contracting and expanding variety. If the rules in Frost and Prechter are accepted, then this is an invalid wave count.
It may be that the rules need to be rewritten to add “sometimes a third wave may be the longest within a contracting or expanding diagonal”. But I have never seen Robert Prechter publish such a rule, I do not know that it exists.
I cannot reconcile this wave count from EWI with the rules in Frost and Prechter.
If an ending contracting diagonal is unfolding, then the (1) – (3) trend line may be overshot signalling the end of intermediate wave (5). If price behaves thus and turns around and moves strongly higher, then this wave count must be accepted and the rules for diagonals will need to be rewritten.
I will continue to follow this possibility as price moves lower.
Click chart to enlarge.
Intermediate wave (5) should be shorter than intermediate wave (1). At 972.6 intermediate wave (5) would reach equality in length with intermediate wave (1). A new low below this point would take this possible diagonal structure too far from the rules. At that stage, it really should be finally discarded.
All sub waves within ending diagonals must subdivide as zigzags. Within the zigzag of intermediate wave (5), minor wave B may either be a complete quick shallow expanded flat as per the labelling here, or it may yet continue further as per the first daily alternate above.
Minor wave B may not move beyond the start of minor wave A above 1,189.
Use the cyan trend line in the same way: expect the trend is down while price remains below it. If price breaks above that line, expect minor wave B is moving higher to the target at 1,103 – 1,105.
For this ending diagonal idea, the final fifth wave of intermediate wave (5) should be expected to overshoot the (1)-(3) trend line, which is a very typical look for contracting diagonals. What that means is if price moves lower and it overshoots the lower black line (which is the same as the lower cyan line on the main wave count), then look out for a possible end to this bear market.
At that stage, any shorts should be carefully handled. Manage risk so that your account is not left exposed at that stage to a potential major trend change.
At 1,004 minor wave C would reach 0.618 the length of minor wave A. If minor wave B does continue and moves higher, then this target must also move correspondingly higher. Minor wave C may be about $84 in length.
The same idea for Silver now works on COMEX data. An ending expanding diagonal, which meets all Elliott wave rules, may be close to completion for Silver. This adds slight support to this alternate idea for Gold.
TECHNICAL ANALYSIS
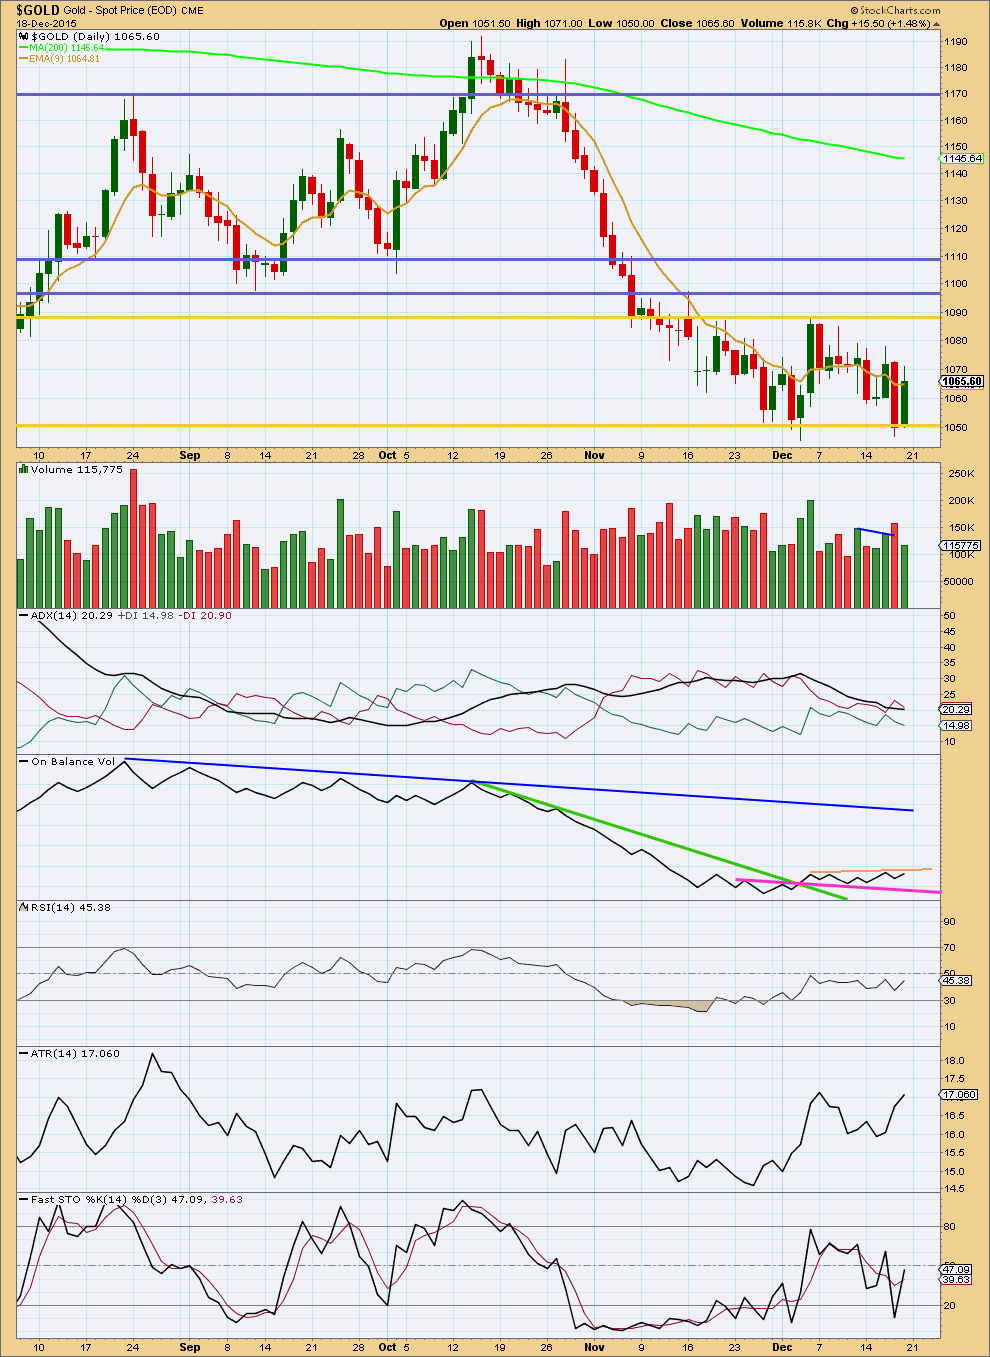
Click chart to enlarge. Chart courtesy of StockCharts.com.
Volume for Friday’s upwards day is lighter than the prior downwards day. This volume profile is short term bearish.
ADX had previously indicated a downwards trend. The -DX line has remained above the +DX line, so no trend change has been indicated, but the decline of the ADX line has indicated a consolidation.
The downwards day of 17th December does look like a downwards breakout may be coming, but it is no longer definitive with the next day moving price back up into the consolidation zone.
A strong downwards day needs to close well below the lower gold line of support for a downwards breakout to be clear. It should do so on increased volume. If that happens, then expect the downwards trend has resumed.
To the upside, any further upwards movement may find resistance at the gold line first and then the lowest blue line after that. Look for any upwards movement to end when price finds resistance and Stochastics is overbought at the same time.
With price now comfortably back within the consolidation zone, we are still waiting for a breakout. Use On Balance Volume as a leading indicator of what direction price may break out. Use the peach and pink trend lines. A clear break above the peach line or below the pink line may be a leading indicator for price. OBV should break clearly above or below the line, and then look for a throwback. If that happens, then expect price to follow in the same direction.
At this stage, the ADX line is still flat to declining indicating the market is not trending but consolidating. If the black ADX line again turns up, then expect the market is again trending.
RSI is neutral. There is plenty of room for this market to rise or fall.
ATR is increasing. This supports the main wave count which expects the trend has resumed.
Once price has broken out and ADX indicates a trend again, then use both the trend lines on price and the 9 day EMA on this chart to show where price should find resistance.
It is expected that the breakout should be down.
This analysis is published about 10:13 p.m. EST.
On further analysis I’m going to stick with the hourly alternate.
Subminuette c is incomplete; micro 1 and now 2 are complete. This upwards move is micro 3. Then we shall need micro 4 to remain above micro 1 price territory at 1,081.4, and finally micro 5 to unfold upwards to the target at 1,103 – 1,105.
Trying to see subminuette b over at the low for 31st December doesn’t work on the hourly chart; the b wave would be only 86% of the a wave, it falls short of the minimum 90% required for a b wave of a flat correction. And this must be a flat because the a wave subdivides as a three, not a five.
Good morning everybody, and a Happy New Years to you all.
Gold is still range bound. This sideways move of the last 19 days looks like a B wave. It will just fit if we are seeing a regular flat unfold.
I still expect it to end only when price makes a slight new high above 1,088.8, so that C moves slightly above A and avoids a truncation.
My main wave count today will see C almost complete, a final fifth wave up to go to end just above 1,088.8.
When that is done then the correction may be over and the downwards trend may resume.
From a classic TA point of view Gold is range bound and we are still waiting for a breakout. Either above 1,088.8 (which must come on an upwards day with an increase in volume for confidence in an upwards breakout) or below 1,052.8. During the consolidation it is a downwards day (17th December) which has strongest volume, and so a downwards breakout is indicated as more likely than upwards.
This supports the EW count.
So maybe one more day now to reach above 1,088.8 and then it could finally be over. Its lasted 25 days so far, it may not end with a Fibonacci number. The next in the sequence is 34, but at this stage I’m not seeing how it could continue for a further 9 days.
For my own trading I have no position on Gold and I will not enter short until I am confident the correction is over. Today I expect it is not over.
Happy New Year!
No positions for me yet, but I think it’s coming this week.
Here is to a great 2016!
Wishing a Happy and Prosperous New Years to Lara and all her subscribers and thanks to all who post their comments and charts here. May gold and Lara’s EW analysis align for increased accuracy, probability and trading success.
Gold and Silver Stocks Bottom – Are We There Yet?
Dec 16, 2014 – 12:32 PM GMT
By: Rambus_Chartology
http://www.marketoracle.co.uk/Article48668.html
The above article is 2014, my mistake, sorry.
Big Picture, Big Moves Brewing Thursday, 31 December 2015 RAMBUS
http://news.goldseek.com/GoldSeek/1451573529.php
ONLY 1st chart applies to gold.
Bullish Expectations In The Metals In 2016
Avi Gilburt December 29, 2015
http://www.gold-eagle.com/article/bullish-expectations-metals-2016
Wishing Everyone a blessed Happy New Year’s celebration and a wonderful year all 2016. 🙂
Wishing Lara and all the members a Very Happy and Prosperous New Year. Personally 2015 was the best trading year for me. Thanks for all the awesome analysis I find here.
Saurabh, great to hear 2015 was best trading year for you.
Myself and I’m sure other members would appreciate if you could please share a few investment tips or strategies that enabled that trading success to happen for you.
Updated COT analysis. I haven’t taken any positions yet, it feels like Gold and Silver have some more room to go on the downside.
Blue line is almost same level as Jul 20th. On Jan 4th (Dec 29) Are you expecting blue line to turn up????
That should set up gold up for few weeks to target 1120????
Since COT day was yesterday, the blue line (when the report comes out on Monday) will be around -220,000 or potentially much lower. The bottom of the blue line will occur on the COT report ending 1/5 (reported on 1/8). It will turn up significantly the 3 COT weeks following.
As of this moment, it sure seems like Gold/Miners want to move lower over the next week or so. Then, this blue line would move quite a bit lower, but that wouldn’t surprise me, because if it did, we would likely be in the ending diagonal count and the COT would have the SWAPs loaded on longs with the MM’s loaded on shorts which would drive some firepower for a launch up to begin the B wave finally.
It’s been very interesting sitting and watching this with no positions. The more I watch this COT analysis I have in the background, the more I sense it’s weight in where gold price is. My assessment has been that the gold COT was revealing that gold was not likely to move up much and would be weighted down. And it sure seems like there has been a lid put on gold for a while now. I am anticipating what might happen is a 2 to 3 week short squeeze into Gold Options expiration at the end of January. But, i think they sucker some shorts in first with a drop down first.
Or, I could have it all wrong. 🙂
Can’t say what the longs are thinking; additional price weakness (break below 1059) is the way this ought to be headed…. let’s see how far up (past pivot/1065?) a possible rally takes Gold price with 50% retrace of H 1088 /1046 and 20dma in the way providing resistance….Keeping it short, no interest in Buy.
Dreamer, wondering what is your wave perspective on this move to 1060 level? Can you chart upward movement left in B or (ii)? Thanks for your input over these past days as well.
Today’s move down was unexpected. A new low into the 1,030’s is needed for the Second Alternate ending diagonal scenario or much lower for Lara’s main count, so the safer bet is to be bearish. That said, it’s still possible that we move up to a target of 1,094 for B or ii before we head lower. Tomorrow’s action should help clarify the short term direction. Posting an update for the short term bull scenario that has been my preferred count. It’s a bit challenging to chart the chop with the free tool I’m using.
Good luck all and Happy New Year!
Thank you Dreamer. Wishing you a Happy New Year too!
There may be year end tax loss sell off of gold then climb back up in January like past 4 years.
Gold is on the edge of a major breakdown
http://dragonflycap.tumblr.com/post/136255157622/gold-is-on-the-edge-of-a-major-breakdown
Looks unlikely now for Gold price to drive through 1069-72 range on any bounce back up….
I agree and think it would take a miracle for it to happen this year.
Although Lara did say Dec 18th “The target may be met in 6 days or sooner.”
10:30 am today is important Oil Inventory report
U.S. stocks edge lower as oil rout resumes and
http://www.marketwatch.com/story/us-stocks-eye-lower-open-as-oil-drops-2015-12-30
Traders are now watching for official inventories data from the Energy Information Administration that’s expected at 10:30 a.m. Eastern Time.
There is “only one thing” on the minds of traders on Wednesday, and that’s “the commodity market and how it will pan out next year,” said Naeem Aslam, chief market analyst at AvaTrade, in a note. The “highlight for the day” will be the EIA report on crude supplies, he added.
Oil futures extend sharp drop as U.S. crude stockpiles rise –
Dec 30, 2015 10:39 a.m. ET
http://www.marketwatch.com/story/oil-futures-extend-sharp-drop-as-us-crude-stockpiles-rise-2015-12-30
Last 4 years gold dropped about December year end. Although this year may be the exception.
Where is Alan???
No contact for weeks with Alan Tham that I have noticed.
Dreamer=Gold! is not going down and it is not going up! So what happens to your scenario?
All of this sideways movement is testing our patience. looks like a bull flag on a 5 hour / and hour chart
I think we are still on track. If my scenario is correct, then we just completed a time consuming wave 2. Tomorrow should be a strong move up for a wave 3 into the 1,080’s.
Zoomed in look at wave c of Y of B. Wave 1 is a clear 5 up, followed by a completed a-b-c expanded flat down for wave 2.
What is Max pain for option expiry??? Market maker just let all option expire worthless.
COT – Commercials increased shorts by a small amount last week.
Thanks. Per MTLSD important one is today’s COT. This will be published on Monday 2016.
Ted Cruz’s gold standard push is not a good idea – Dec. 28, 2015
http://www.money.cnn.com/2015/12/28/investing/ted-cruz-gold-standard/index.html
Here’s my take. The Daily count that I posted on Dec 23 is still in play. This is an update at the hourly level. The move down may be close to complete, then we go up to at least 1,088.94 with an actual target of 1,098. That will complete a very time consuming W-X-Y correction which started in late November. Then we go down to a new low in the 1,03x range or even lower. This may complete the large ending diagonal and Cycle Wave a (Lara’s second alternate count). All of this sideways movement is testing our patience. We should know soon if this scenario is correct.
What is your approximate time frame for the 11 waves you have outlined in your scenario? Tuesday Dec. 29 to Thursday Dec 31. OR Dec.29 to Tuesday Jan. 5th? or WHAT? Thank You
Good question. I think the move up to 1,098 could end this week in 2-3 days, and then the move down to new lows around 1,03x’s would last maybe 2 weeks until mid January.
Gold falls to start final week of 2015
Dec 28, 2015 11:38 a.m. ET
Gold futures were negative territory Monday, mirroring a broader slump in commodities that saw oil and copper prices lower in the final trading week of 2015.
http://www.marketwatch.com/story/gold-falls-to-start-final-week-of-2015-2015-12-28
Syed , where is your JUST A VIEW for the day?
Thanks, Happy new year
Hello Robert. No view really, just keeping it short with upside risk 1083-84. No interest in Buy lol…. Gold price has not yet penetrated below 20dma thus gives it bullish bias. However, coasting below 1072 opens up risk 1064 and lower provided gold price can break below 50% retrace of H 1088 / L 1047 at around 1067…. The Gold bulls must be wondering if a bounce off the Monday lows will be able to take out 1075-76 for a test of 1080-81… Looks unlikely at this stage…. On a weekly outlook basis, Gold price is bearish down trending but oversold and can be expected to rally. Just depends on how far up the rally can take Gold price, past and above the upper band? How far up above the upper band? Should be a good place to short it in any case…. Happy Holidays and best wishes for the New Year //// p.s. a cycle turn is in play now with Gold price trapped in a narrow range, let’s see where Gold price ends up~!
The Market Correction In Metals Is Long In The Tooth But Not Likely Over
Wednesday December 23, 2015 15:35 – Avi Gilburt – EW
http://www.kitco.com/commentaries/2015-12-23/The-Market-Correction-In-Metals-Is-Long-In-The-Tooth-But-Not-Likely-Over.html
Same article from AVI on Goldseek.com
Read interesting comments at the bottom!!!!!
http://news.goldseek.com/GoldSeek/1450887900.php
EWG ship is drifting w/o an anchor/captain? Any wave count???
Gartman pumping Gold because of bullish COT.
http://www.cnbc.com/2015/12/22/something-enormously-rare-is-happening-in-gold-gartman.html?utm_content=bufferd7148&utm_medium=social&utm_source=twitter.com&utm_campaign=buffer
Gold and GDX very bullish all MACD time frames today in fact since Wednesday also.
From 1 minute all the way up to daily time frame bullish.
12:00 pm EST was selling time for miners today when 5 minute MACD GDX and NUGT crossed over to sell and party really ended when 15 minute MACD crossed over to sell at 12:26 pm EST.
Now 12:59 GDX & NUGT spiked up in rush to buy miners again last call before 1:00 pm market close for Christmas.
We have made a bottom in gold ,bouncing twice off the high 1040’s and now in the 1070,s. ANY PULL BACK ,IF THERE IS ONE IN HERE, SHOULD BE BOUGHT. lmho Cycle low at 255 in 2001 ,then high in 2011 at 1924 equals difference of 1669 ,multiplied by .618 equals 1035. CLOSE ENOUGH !!! sTRENGTH IN MINERS FOLLOWED BY GOLD ACTION UP TODAY. Merry XMAS and HAPPY GOLDEN NEW YEAR!. Rabbit
Rambus has turned short term bullish on miners
http://rambus1.com/2015/12/23/wednesday-report-100/
Note my opinion..
January 1st week
Cride oil 43$
Gold 1104$
Its on the way
Any clarity on this down move since the highs of 12-21? I’m thinking its still a 4th wave correction with one push up left.
Per one tradingview.com posting by Lana Hunt:
” The ratio of long to short positions in the XAUUSD stands at 2.62 as 72% of traders are long. Yesterday the ratio was 2.05; 67% of open positions were long. Long positions are 7.1% higher than yesterday and 9.5% above levels seen last week. Short positions are 16.4% lower than yesterday and 16.3% below levels seen last week. ”
daily fx info
The move down for the last two days is looking less like a wave 4. On the daily chart, if gold continues higher, this move up will look like a 3, now that there are 2 red daily candles. If that’s the case, the overall correction up may be a W-X-Y (3-3-3). With low volume on these down days, that’s very possible. Miners were strong today which is short term bullish for gold also.
Interesting thanks for your count.
NYSE closed Dec 24th at 1:00 pm and closed Dec 25 and Jan 1 st
Each market will close early at 1:00 p.m. on Thursday, December 24, 2015.
NYSE: Holidays and Trading Hours
https://www.nyse.com/markets/hours-calendars
With an inside day on Tuesday, a pullback (drop) is expecting on Wednesday. Remains to be seen if can break below 1062 and subsequently 1053… Will it be worth it Buying the pullback (drop)? Upside appears limited to 1085-86 with the upper band at 1084-87. Gold price was unable to break above 1080-81 and may have topped here already?~!
As Corey states, the correction may be over, but I think it’s equally possible that we still need one more high to finish the correction.
Wave c impulse could have completed as a rare running flat.
I can count 13 up. Not sure how to label this 1st wave down – it has breached the wave c channel. Maybe a leading diagonal in the 1 position? Maybe a couple of 1-2, 1-2s?
Either way, I’m looking for a break below 1054.60 (where wave 4 can’t move into wave 1 territory) as first indication of momentum to accelerate down.
Volume is lighter than yesterday, which gives pause to the idea that minuette wave (ii) is over.
As a side note, Friday was an inside day with a low of 1050.00. If we break below 1050.00 by Thursday of this week, then that sets up a downside pattern called a bear Hikkake ($31-$62 of downside potential).
Corey thanks for the informative update.
Note my opinion..
January 1st week
Cride oil 43$
Gold 1104$
Gold Miner 3x ETF – Follow The Pattern
Dec 21, 2015 7:52 PM : NUGT, DUST
http://seekingalpha.com/instablog/172149-jsira/4654126-gold-miner-3x-etf-follow-the-pattern
Easier pattern to trade NUGT and DUST.
We may only need one more 5 wave move up to above 1,088.94 to end the correction, then the next move down will determine whether or not cycle wave a is coming to an end with the second alternate ending diagonal count or not. Going down into 12/31 makes sense with tax selling season. My target is somewhere in the 1,03x range, but we could go lower. Once we go below the diagonal trend line, if we get a sharp reversal back up, then the bottom may be in for multiple months.
Upside move for topping is expecting… With the upper band at 1085-87, lets see how far up Gold price gets….
Crazy scenario for $USD…or not?
On the hourly, I can count 13 up at 1081.40, although I can also see it as 13 with one more 5th wave up (unless of course it keeps extending!).
I’m sure there’s a way the structure could take us up to 1095-1105, so I’m going to use a break of the channel and a break of 1057.20 as a guide.
Also, I’m layering in some Dec. 28 puts as potentially a low cost/high return scenario if momentum swings to the downside.
Is anyone going bullish on gold overnight considering that the bearish Hourly Alternate wave count was confirmed today and the target is $1,103 – 1,105 and subminuette wave c should move at least slightly above the end of subminuette wave a at ‘1,088.94’ to avoid a truncation and a very rare running flat?
Or staying in cash or bearish because breakouts tend to be the the downside?
Regarding Lara’s second hourly count, she states “Subminuette wave c should move at least slightly above the end of subminuette wave a at 1,074.6 to avoid a truncation and a very rare running flat.”
However, my data shows Subminuette wave a ended at 1088.30 AND also her chart shows the orange “a” above 1080 for sure. Is this simply a mistake, or am I reading her chart wrong? Can somebody else verify?
The impulse so far looks incomplete, with another 4-5, 4-5 to come to finish the impulse. Interesting that this move up is coming from an inside day yesterday…could be a false breakout (which also follows her count).
Another note is the 50 DMA will be sitting under 1105 after today, which matches her target range.
Corey it is a mistake. I believe Lara pulled the subminuette wave a amount from the wrong daily chart. It should be 1,088.94 for the daily alternate not 1,074.76.
Daily Alternate subminuette wave a ended at 1,088.94 on December 4th.
Main Daily subminuette wave a ended at 1,074.76 on December 1st.
As per pmbull.com
I changed the amount on Lara’s note on Hourly Alternate.
Subminuette wave c should move at least slightly above the end of subminuette wave a at ‘1,088.94’ to avoid a truncation and a very rare running flat.
Thank you!
Liquidating Gold Longs Push Short Positioning Back To Record Levels Ahead Of FOMC Meeting – CFTC
Monday December 21, 2015 12:35
http://www.kitco.com/news/2015-12-21/Liquidating-Gold-Longs-Push-Short-Positioning-Back-To-Record-Levels-Ahead-Of-FOMC-Meeting-CFTC.html
Technical Trading: Choppy Range For Gold Into Year-End
Monday December 21, 2015 09:59
http://www.kitco.com/news/2015-12-21/Technical-Trading-Choppy-Range-For-Gold-Into-Year-End.html
Price invalidation of main hourly wave count just happened at 9:50 am above 1,077.90 went to 1,078.06.
But main daily is still be valid until daily breach above cyan upper trend line.
Ok, coming up fast on the 1077.9 validation / invalidation
Matt, nice call on the bounce last week. Looks like the USD gap is about closed.
Gold outlook for January 2016 – GUNNER24 – 12/20/2015
http://www.gunner24.com/newsletter/nl-122015/
Good read. His target could very well match the second alternate ending diagonal count.
Martin Armstrong:::: Commodity-Based Countries to Liquidate Wealth Funds & Gold
http://www.armstrongeconomics.com/archives/40593
While it’s possible that GDX is forming another H&S pattern, this is the first time in 3 years that GDX has significantly diverged with Gold in price. Miners historically bottom before gold. This adds a little more support to the ending diagonal second alternate count.
JUST A VIEW: Three weeks of lower highs 1088-89; 1086-87, 1078-79…. Will any or / either or be taken out? I don’t think so. With an inside day on Friday, range expansion can be expected to follow on Monday. An early break below pivot 1062 on Monday may hold the key but looks unlikely in the early going with Gold price bottomy for a likely short term up move to occur…. Gold price is in neutral territory with a bullish close above pivot and bearish bias below 20dma. A cycle turn is due next week…. Let’s see how this plays out. Keeping it short….
Have a wonderful holiday Lara! See you in 2016!
Bullish COT data again this week.
Large commercial shorts: 233150 net shorts 15769 only.
May be MTLSD’s view that few more weeks need for average down before gold reacts to COT.
I think we are only a few days away. Attached is my updated analysis. Blue line will still be dropping on the 22nd report (Which is measured on Tuesday close) and the 29th report. Because of the COT structure that makes up my analysis, the blue line will be dropping quite a bit because in these COT reports from 9 and 10 weeks ago, there was a positive divergence of over 110,000 which is currently holding this blue line UP. As those drop off and are replaced with new divergent numbers for current weeks, this blue line will spike down, and I am fully expecting an extreme low reading at this point. Because of the extreme low reading, I am leaning towards the second alternate count as this may be a fundamental transition in the COT structure. When you remove spreads, the SWAPs are currently net long 33,000 contracts, but in addition to that, they ONLY HAVE 35,000 contracts short in total! I have 10 years of data and that 35K is the lowest they have had as a gross short position. Managed Money is currently net short the most in 10 years. So what is fascinating about this to me is that the price of gold is down $900 all while the swaps exited hundreds of thousands of short contracts and transitioned them to the managed money. Masterful in a way.
Now, the commercial number is deceiving in total, because the producers added short while the swaps went 10K net long, i place my bets on the swaps being the smart money.
We have had 4 weeks of flat open interest, I am expecting that the next week or two continues that trend with gold price moving down, managed money going more short, swaps adding longs, and setting up a bullish move in early 2016 with the blue line bottoming with the 12/29 COT report. GOLD DOES NOT HAVE TO BOTTOM WHEN THE BLUE LINE DOES. Summer of 2014 is a good example of this.
This will be the first time I have trusted this COT analysis with so much weight. Therefore, in the next two weeks I am testing a trading plan that has been successfully backtested 15 out of 16 times in the last 4 years. I have $3500 that I will be using to purchase March expiration call options. I will likely purchase at the money or up to 2 strikes out of the money, and I will layer in with 2 tranches each of GDX and GLD, with a little left in reserve for adding once it gets moving. I am expecting that this will return between 2.5x and 3.5x within 60-90 days.
Full transparency – I am 100% willing to lose all of this money as this is a test and I need to experience the full nature of the trading psychology of the trading plan implemented in order to learn what I assumed is working and to see what I missed if this doesn’t work.
Finally, I am not blindly using just this analysis, EW is primary, techincals are supportive, and this COT analysis I do is like the final timing confidence I am using. So if EW and/or techincals are suggesting something different is going on than what I am expecting, I will either use a smaller position or delay the trades.
Have a great weekend everyone!
One other thing, the weeks between blue line peaks and gold troughs have averaged 9 weeks, with the gold troughs to blue line peaks having averaged 10.5 weeks. Tuesday Dec 22nd will be 9 weeks and Tuesday Dec 29th will be 10 weeks so we are right in the zone.
And here is the traditional COT chart. Commercials still showing bullish numbers.
Silver getting slightly less bearish.
Dreamer
Thanks for posting Daneric idea. What he is assessing is that Lara’s cycle wave a or pm wave 5 is over and gold is now entering cycle wave b of expanded flat.
Lara has discarded that cycle wave a is not complete.
Once Lara is back we will know.
I would be waiting for an overshoot of the lower diagonal trend line before considering it may be complete.
I don’t think Danerics chart is detailed enough to say the bottom is in. I do however, like the diagonal count until proven wrong by price. I also agree with Lara, that even the diagonal count needs one more low, probably to the 1,03x.00 or maybe lower range. If we then get a sharp reversal, an intermediate bottom may be in.
Daneric update on ending diagonal. If it plays out, upside target for cycle wave b may be 1,500
Close up view with target zone.
Great charts, thank you.