
In the short term, a small correction to about 1,325 was expected.
Price moved lower, reaching 1,320.
Summary: The correction still looks like it is over. A short term target for a strong third wave up is at 1,515.
New updates to this analysis are in bold.
Grand SuperCycle analysis is here.
WEEKLY ELLIOTT WAVE COUNT
Click chart to enlarge.
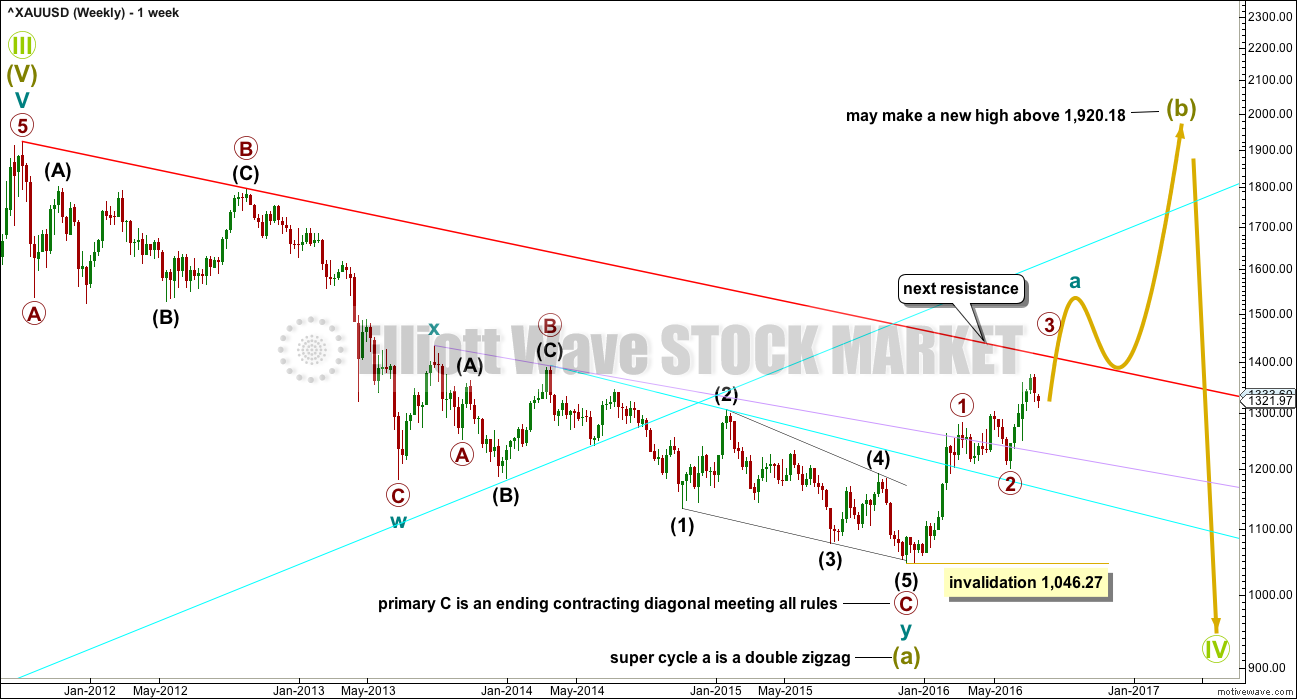
This downwards movement labelled super cycle wave (a) subdivides as a double zigzag from the all time high.
Within the first zigzag labelled cycle wave w, primary wave C is 10.13 short of 1.618 the length of primary wave C.
Within the second zigzag labelled cycle wave y, there is no Fibonacci ratio between primary waves A and C. Primary wave C is an ending contracting diagonal which meets all Elliott wave rules.
For this downwards movement this is the only wave count that I have been able to see so far which meets all Elliott wave rules. I remain aware that Elliott Wave International and Danerics have this downwards movement as a five wave impulse which ends with a contracting diagonal for the fifth wave, but that wave count violates the rule for wave lengths within a contracting diagonal. I will keep that wave count in mind, but for now I do not want to publish a wave count which does not meet all Elliott wave rules as laid out in Frost and Prechter.
Grand Super Cycle wave IV may not be a combination because the first wave subdivides as a multiple, and the maximum number of corrective structures within a multiple is three. To label multiples within multiples increases the maximum beyond three, violating the rule.
It may not be a zigzag because Super Cycle wave (a) subdivides as a three and not a five.
This leaves two groups of corrective structures: flats or triangles.
Within an expanded flat or running triangle, Super Cycle wave (b) may make a new high above the start of Super Cycle wave (a) at 1,920.18.
Within a flat, Super Cycle wave (b) must retrace a minimum 90% of Super Cycle wave (a) at 1,833.71.
Within a triangle, there is no minimum nor maximum requirement for Super Cycle wave (b). The only requirement for a B wave within a triangle is it must be a corrective structure.
Super Cycle wave (b) may be any one of 23 possible corrective structures. First, a move of this size should have a clear five up on the daily and weekly charts.
After consideration of how far up this wave has travelled at the weekly chart level, the degree of labelling within the new upwards wave is moved up one degree at the end of this week.
So far there is a five up on the weekly chart that is now labelled primary wave 1. This was followed by a shallow three down labelled primary wave 2, which should be followed by another five up that is for now labelled primary wave 3 but may also be labelled primary wave C.
When this next five up is complete, then an alternate wave count at the weekly chart level would be required. Cycle wave a is most likely to unfold as a five wave structure, but it may also be a three. When a 5-3-5 up is complete, then two wave counts at the weekly chart level would be required: one for cycle wave a as a continuing impulse and the other for cycle wave a as a completed zigzag.
DAILY ELLIOTT WAVE COUNT
Click chart to enlarge.
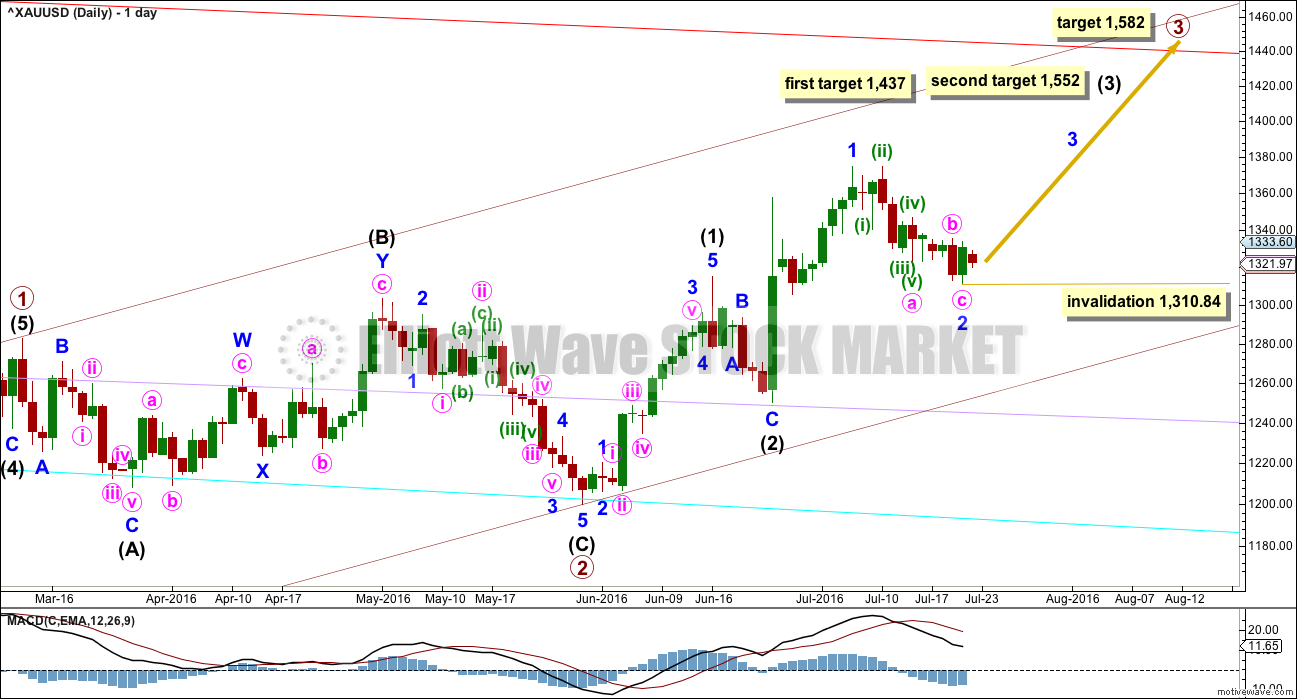
Primary wave 2 is a complete expanded flat correction. Price from the low labelled primary wave 2 has now moved too far upwards to be reasonably considered a continuation of primary wave 2. Primary wave 3 is very likely to have begun and would reach 1.618 the length of primary wave 1 at 1,582.
Primary wave 3 may only subdivide as an impulse.
So far intermediate waves (1) and (2) may be complete within primary wave 3. The middle of primary wave 3 may have begun and may also only subdivide as an impulse.
Within intermediate wave (3), the end of minor wave 1 is moved up to the last high. This fits on the hourly chart although it looks odd here on the daily chart. There was a small fourth wave correction up at the end of minor wave 1 and it subdivides on the hourly chart as an impulse. Minor wave 2 may be a complete zigzag, also subdividing as a zigzag on the hourly chart. If minor wave 2 is over, it would be 0.50 the depth of minute wave i.
No second wave correction may move beyond the start of its first wave below 1,310.84 within minor wave 3.
At 1,437 intermediate wave (3) would reach 1.618 the length of intermediate wave (1). If price keeps going upwards through this first target, or if it gets there and the structure is incomplete, then the next target would be at 1,552 where intermediate wave (3) would reach 2.618 the length of intermediate wave (1).
HOURLY ELLIOTT WAVE COUNT
Click chart to enlarge.
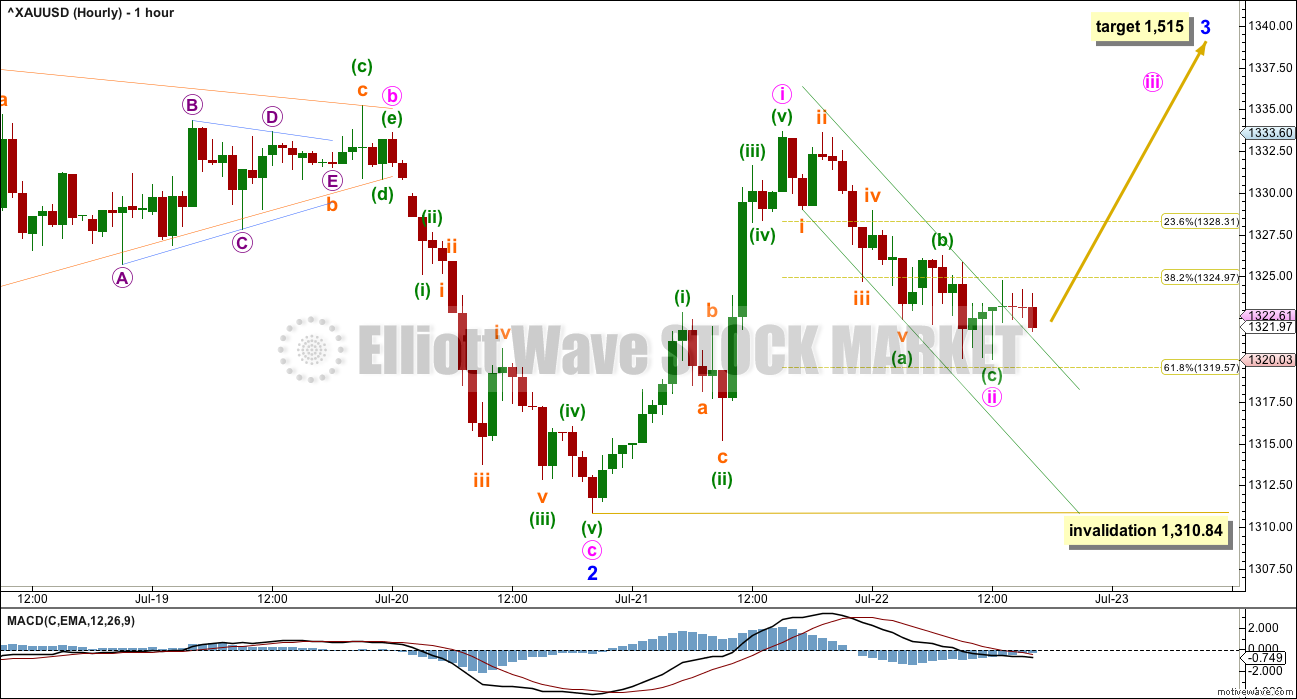
Minute wave ii moved lower, ending just short of the 0.618 Fibonacci ratio of minute wave i. The subdivisions all fit on the five minute chart level. This structure may be a complete zigzag.
A small best fit channel about downwards moment for Friday’s session is breached by upwards movement. The last hour downwards on Friday may be a throwback to support at this trend line.
Risk and the invalidation point must remain the same. If minute wave ii continues lower, then it may not move beyond the start of minute wave i below 1,310.84.
At 1,515 minor wave 3 would reach 1.618 the length of minute wave i. This target fits only with the second higher target for intermediate wave (3) on the daily chart.
Minor wave 3 should have support from rising volume and it should exhibit stronger momentum than minor wave 1.
Intermediate wave (1) lasted a Fibonacci thirteen days. Minor wave 1 lasted a Fibonacci eight days. Minor wave 3 may be expected to last longer, about a Fibonacci thirteen or maybe twenty one days.
TECHNICAL ANALYSIS
WEEKLY CHART
Click chart to enlarge.
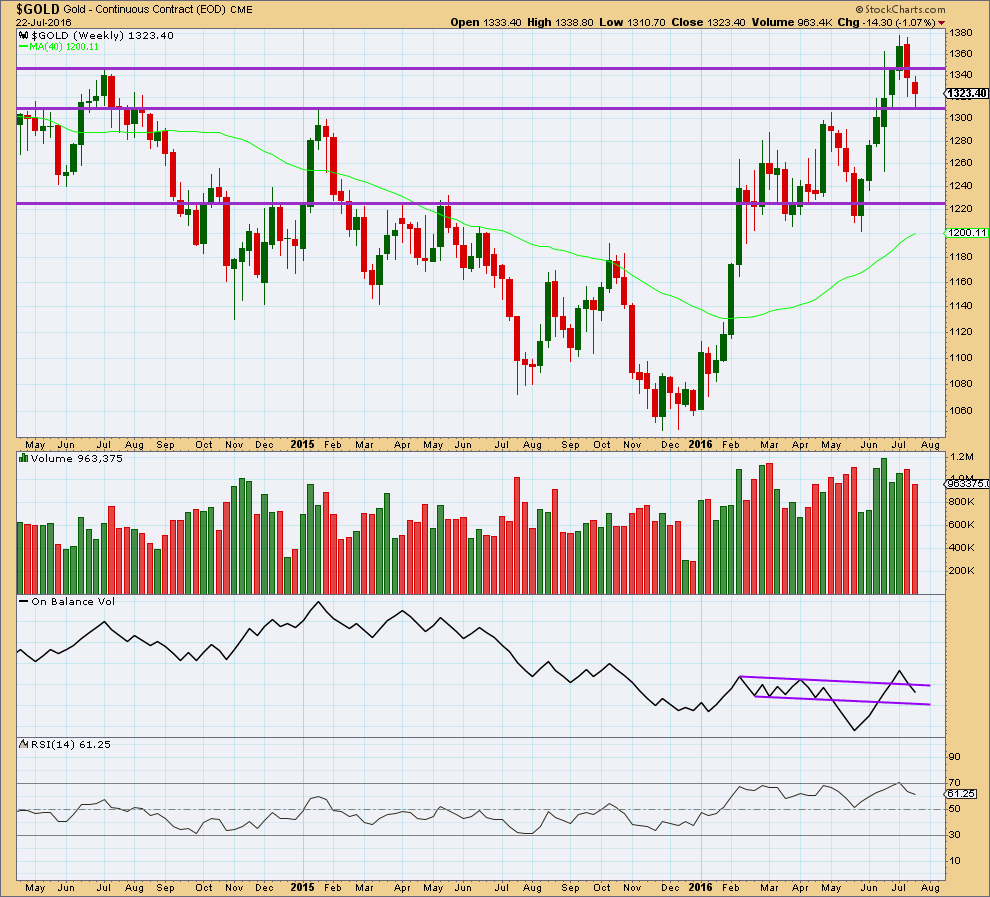
Last week completed a bearish engulfing candlestick pattern that was supported by an increase in volume. This bearish reversal pattern indicated a trend change from up to either down or sideways.
This weekly candlestick completes another red candlestick with lighter volume than last week. The fall in price this week was not supported by volume. Volume this week was lightest for six weeks, so this decline is significant. This downwards week looks like a countertrend pullback within a larger upwards trend. The prior rise in price was supported by volume.
The reversal implications of the bearish engulfing candlestick pattern may now be fulfilled. A reversal pattern only indicates a trend change and gives no indication of how far or for how long the next trend should be. It also does not mean a change from up to down or down to up but may also mean a change from up to sideways or down to sideways.
Price may be finding support at the horizontal trend line about 1,310. Two weeks in a row with longer tails on these candlesticks is slightly bullish.
On Balance Volume is not working with the upper purple line, because it broke above the line giving a bullish signal only to turn and break below the line. The lower line so far should provide support if OBV moves lower.
DAILY CHART
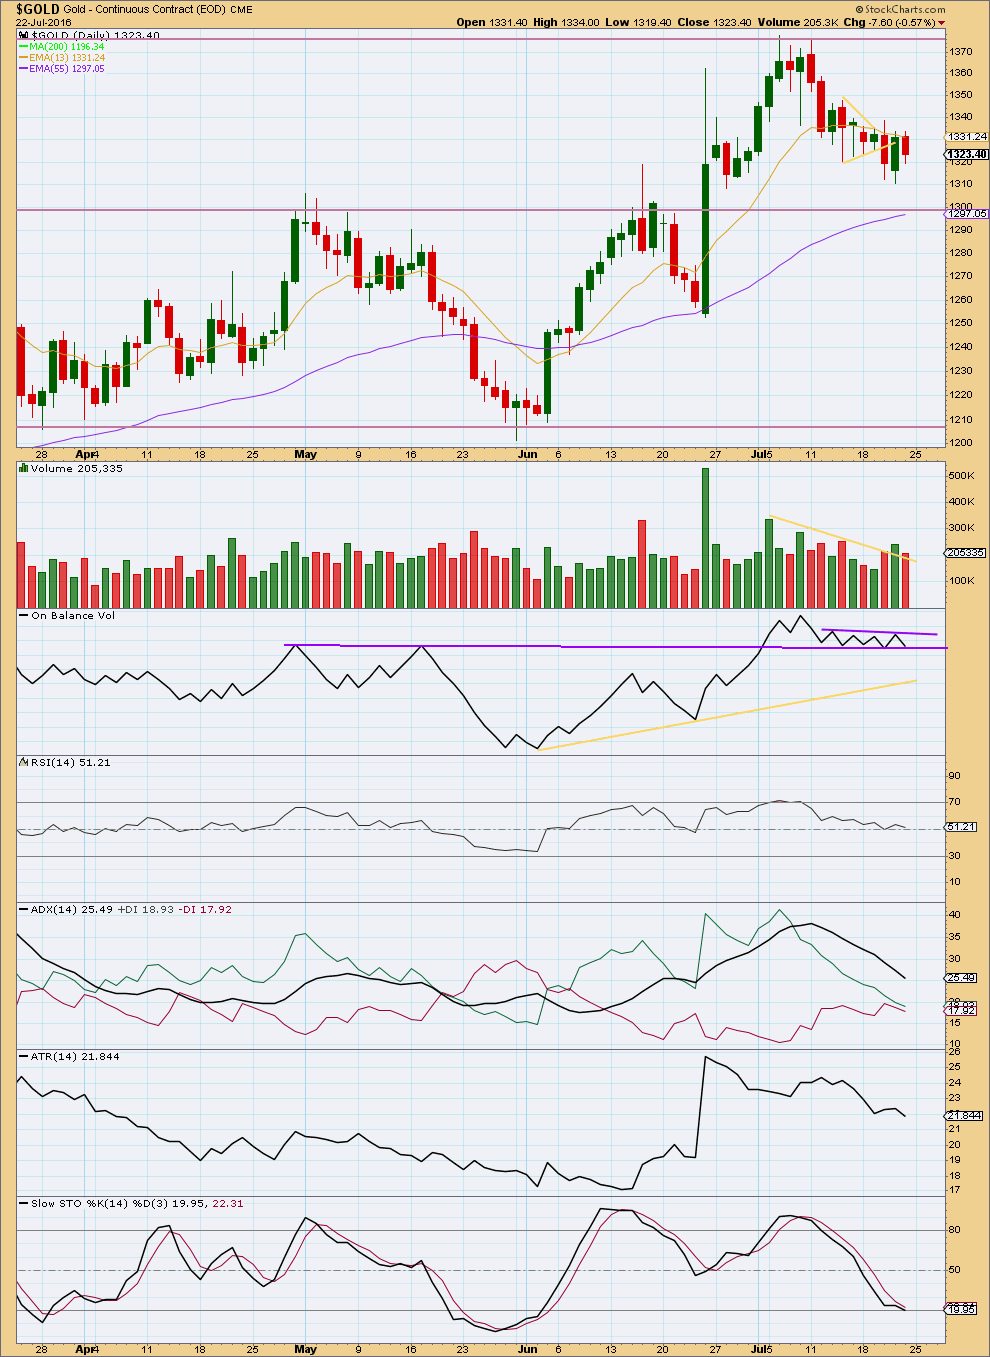
Click chart to enlarge.
Volume for Friday’s smaller range downwards day is lighter than yesterday’s upwards day and also lighter than the last downwards day. There was not adequate support for the fall in price on Friday, so it is suspicious. It should be expected to most likely be a counter trend pullback.
On Balance Volume at the daily chart level remains constrained between two trend lines. It has not yet broken out to indicate a price direction.
RSI remains neutral. There is plenty of room for price to rise or fall.
This pullback has brought ADX right down from extreme levels. There is again room for a trend to develop. Currently, ADX is still declining, indicating the market is not trending. No trend change is indicated: the +DX line remains above the -DX line. If a trend resumes at this stage, it would be upwards.
ATR is in agreement with ADX as it too is declining.
Stochastics is just short of oversold and price is reasonably short of support. There is still a little room for price to move lower before this pullback is complete. If it does, then this classic analysis would expect price to find support about 1,300.
This analysis is published @ 10:26 p.m. EST.
Alternate hourly count update.
Today’s sideways move fits very nicely as an expanded flat. I like this part of the wave count, it really looks right.
That means Gold could be ready for a small third wave down. If the main count is invalidated I’ll be considering a short scalp to the downside, target 1,296 to balance out my small loss from a long position I’m holding.
My stop for my long is the invalidation point on the main wave count 1,310.84 (well, very slightly below).
I always add 3X the normal spread and set my stop that far away, so that I’m not stopped out by a whipsaw during a volatile news event. Broker spreads tend to widen during those times.
Main wave count hourly update.
I’ve played with the move labelled subminuette b triangle. This is the best fit, the trend lines look right, I think there is a triangle in there. Trying to see that any other way just doesn’t have as good a fit.
Minute ii should be over as a double zigzag.
The only thing I don’t like about this is the second zigzag has barely deepened the correction, although it did fit neatly within the channel.
Also minute ii is very deep, that was unexpected.
The invalidation point is holding so far. Downwards move is a small range and so far cannot make a new low.
I am concerned though that this correction is very deep. Sometimes this can happen, but at this point in the wave count I did not expect to see it.
The alternate posted in comments below will be in the analysis today.
Wave count anyone?
Gold may now be in the 5th wave down now of a 2nd wave to retest the day low of 1312.25 at 9:36 am.
Unless 1322.27 12:15 pm high was only the top of the 3rd wave and not the 5th wave up then now may only be a 4th wave down.
If it breaks the invalidation point of 1310.84 then it’s abort time for the bulls.
working on it now Richard….
Here is some interesting support for the bullish case in gold. It seems that historically there is a strong inverse relationship between the return on TIPS (inflation protected treasuries) and the price of gold, and just recently the rate on TIPS went negative:
http://blog.gavekalcapital.com/?p=11396
If the wave count is invalidated then this is the alternate I would use. It would be possible minor 2 could be moving lower. If it does then the 0.618 Fibonacci ratio would be a target at 1,296.
Daily chart of this alternate idea:
Hourly chart of this alternate idea:
The problem with this wave count is it would see minor wave 2 longer in duration than intermediate (2) one degree higher. Intermediate (2) lasted six days. So far minor 2 would be thirteen days and not complete.
Updated main hourly chart
Thanks for the timely updates. Always good to have an option in case of invalidation.
Yes, with price moving lower if the main wave count is right it’s going to be a nerve wracking end.
I want us to have a road map in case of invalidation.
Lara, these updated charts are simply fabulous. I’ve had occasion to want this in the past and chickened out of asking thinking you’d just be way too busy. It really is helpful having your input on what structure occurs with an invalidation.
As for GDX I’m happy to know the minor 4 invalidation is 26.89, even though Avi Gilbert puts his stop at 27.70. (thanks Dreamer)
Keep up the good work. We like it. 🙂
P.S. How’s your neck doin?
July Fed meeting has no press conference scheduled, but of course a statement will be released that could cause a “blip” in the markets and/or gold. The next meeting is in September and that meeting will have a press conference.
Just speculation, but I think it is more likely for a potential rate increase at a meeting with a press conference than one without.
And of course, remember that gold seasonality is strong in August/September.
What makes me very cautious at this time is that it seems everyone is expecting gold to take off much higher right about here… When everyone is on the bandwagon, and ready to take the ride together, that’s when a big corrections shows up…
I like silver more than gold, and they usually go up and down together… Following the SLV options action I saw tons of calls being bought going into the weekend (I bought some myself). The call/put ratio for August and September expiration is around 10:1.
The stage is set up nicely for a long trade, I agree. We’re going into the best 2 months historically for gold prices: August and September. The CB’s around the world are on stimulation mode, and the charts also saying its a go… Being burned by this types of set-ups many times in the past, I get more cautious on a trade perspective when everyone expects a powerful wave up…
Gold scaring bulls…
If the hourly chart is invalidated im actually concernd that where to re enter again on long side…should we wait for 1250 odd levels or buy just below 1305.5 again..??
Alan good call on gold retracing to 1,317 it just hit low of 1,317.19 Sunday 8:40 pm.
“Alan Tham July 22, 2016 at 4:18 pm
I concur.
I estimated minuette ii to end about 1317 – 1315.
The drop is not over yet.
Reply”
It’s only a good call if gold reverses from near those levels. Let’s see how it plays out
Chart by Gary Savage
Thx, Dreamer. I’m not sure what T1 pattern is, but I’m glad he’s bullish on it in his owned method. 🙂
Q&A from Gold expert Larry Edelson
Does Edelson reveal anywhere how his model is constructed, or at least give any indication how accurate it has been in the past? (I don’t place the green line, above, in the latter category, since its just too easy to recompute such a line in hindsight.)
Without more info on this “model” or at least its past performance, its just noise to me.
It seems to me that at this point the risk is in missing the move up. Another indicator that points that way is the enormous imbalance in open interest between calls and puts on GLD. You rarely see it so far out of whack (about 10:1!) and its usually a very good indicator of imminent direction. Another thing that’s really interesting about these (Sep) calls is that the market makers have only priced in about a 7 point move. If Lara is right then her near term gold target of 1515 corresponds to a GLD price of about 144, a total move of about 18 from the present position. That would mean a substantial increase in premium and a further big gain for option holders.
I also like that the spread is so very tight on these heavily traded GLD options. You can use stops without leaving big percentages on the table.
The risk/reward ratio on the Sep 140 calls looks good, and they should end up ITM if Lara’s target is met. I usually don’t go for OTM calls, but it seems to me a good bet here for some of the reasons already noted. I’ll be looking for a good entry. Anybody else?
My thoughts exactly, Thomas. I am actually holding a handful of OTM calls on the GC futures options (SEP expiration) at the 1450 strike. These cost me only $2.20 on Friday and would stand to be worth about $35-40 per contract if the 1515 target is hit sometime in the next month. That is a massive potential gain for a small investment. Also, I can meet Lara’s rules of investing no more than 3-5% on the trade if I do lose 100% on these contracts.
Correction: The contracts would be worth closer to $55-60 each if 1515 target is hit before expiration (not $35-40 as stated above).
And always use stops. The market could prove me wrong.
🙂 🙂
Nice idea Geoffrey. I’ll take a look at those.
This is a 2yr weekly GLD chart. I’m not a member of stockcharts so can’t show you the horizontal line I would draw at $124.50. It’s obvious GOLD/GLD has broken out. However, it’s my suspicion GLD is on its way to backtest the $125ish level which corresponds to the 200dma. A successful retest should lead to a strong move up in GOLD. A few posters have mentioned the COT report still indicating a strong commercial net short position. I agree completely and do not think it corresponds to this EW wave count of a third of a third upon us. The weekly bearish engulfing candlestick a couple of weeks ago usually leads to a stronger correction than $67. I suspect the correction will last a few more weeks with more sideways moving price action with a slight downward bias. My suspicion is $1345ish will be seen early next week which would be a good spot to short for aggressive traders like myself.
http://stockcharts.com/h-sc/ui?s=GLD&p=W&yr=2&mn=0&dy=0&id=p93617891245
We could go sideways or even spike down slightly next week with the Fed meeting, but with a very large iH&S in play here, I think the risk/reward ratio favors the bulls. So far, the 200 MA has stopped the decline. As we have seen, the COT is unreliable as the Commercials can stay very bearish for weeks on end. The trend is up.
Agree. Trend is our friend. Embrace it.
Yep, concur. Also, if Lara’s count is correct, we should soon see a third wave within a third wave within a third wave within a third wave…should be fairly apparent if correct!
I think everyone is missing the pt I’m trying to make. I’m simply suggesting gold needs more time to consolidate sideways with a downwards bias before resuming the upwards trend. As I’ve pointed out, it’s always dangerous to look for a third wave at any degree. They pan out far less than you expect.
As far as the IHS, no offense but doesn’t look like one at all. no symmetry whatsoever. Even it is, not uncommon to backtest neckline which is exactly What I said using A different chart
I see your point, and I entirely agree.
I did spend some thought trying to see a wave count that would fit it… but I have not seen it yet.
I could be wrong and if I am the market will show us Monday / Tuesday.
If the wave count is invalidated below 1,310.84 then it may be minor 2 moving lower as a double zigzag.
I can’t find a wave count which fits either, but it will come. A nice bounce towards $1345ish on Monday where a=c looks probable.
While I absolutely agree gold has a long way to go up I’m hesitant to jump in With any new positions since the commercials are still net short about 300k contacts. I’ve been burnt by going against them before. They may have covered a bit since the drop from Tues when cots are reported. This market is in a favorable position long term with neg rates in Germany and japan. Short term I’m not convinced. I think a safer way to play this is with some longer term calls. I would like to see the commercials below 200k though. There is a risk of waiting too long and missing a huge move up. Lots to consider.
I’m thinking the same thing, the COT is on the very high side, and it did come down a bit this past week, but still over 300k… The only way gold can correct though IMO is if the fed actually increases rates by 1/4% this week, which is what no one expects… That would def make the gold correction much deeper than where it is now…
I’ve entered a small long position in silver yesterday, and waiting to see if I should add to the position… If the fed surprises with a rate increase, the drop in the metals initially will be huge…
Good points….guess we will see…I think silver commercials went more neg….but holding some long term calls too. Increase in rates would definitely surprise and could happen
Thank you lara..
In your last analysis I commented on usd being bullish…ive said that on the information i got from other sources and your usd jpy analysis gave me cofidance to believe it…yaa im sorry for that…but after you replied that you seeing usd being in int4 it gave me lot of relief and also the answer of my confusion…thank u againn…
James(jimmy)
TBH I’m not entirely confident of my USDJPY analysis.
The last move down doesn’t fit very well as a five, but it fits nicely as a three. Which means USDJPY may need more downwards movement before it turns.
I would only have confidence in that analysis if a trend line is breached upwards.
Not much to add for the GDX count today, but notice the slanted rectangle in blue. This highlights the gap on the way up and then on the way down. There’s a possibility that early next week GDX could gap up again creating an island bottom. Something to watch for anyway.
Thank you Dreamer, most excellent!
Have a fabulous weekend 🙂
It may be better to put stops below 26.9 to allow a little more down in case gold moves a bit lower. Minor 4 could morph into a w-x-y above that invalidation point.
GDX keeps shaking the tree. It’s been up 147% this year though…. 🙂