
The target zone at 1,204 – 1,199 was almost met. Price made a low at 1,204.05 for Friday.
Summary: Upwards movement is expected from here. The target at 1,533 may be met in about six months time. There is divergence with price and Stochastics and RSI indicating bears are exhausted.
New updates to this analysis are in bold.
Grand SuperCycle analysis is here.
Last monthly and weekly charts are here.
MONTHLY ELLIOTT WAVE COUNT
Click chart to enlarge.
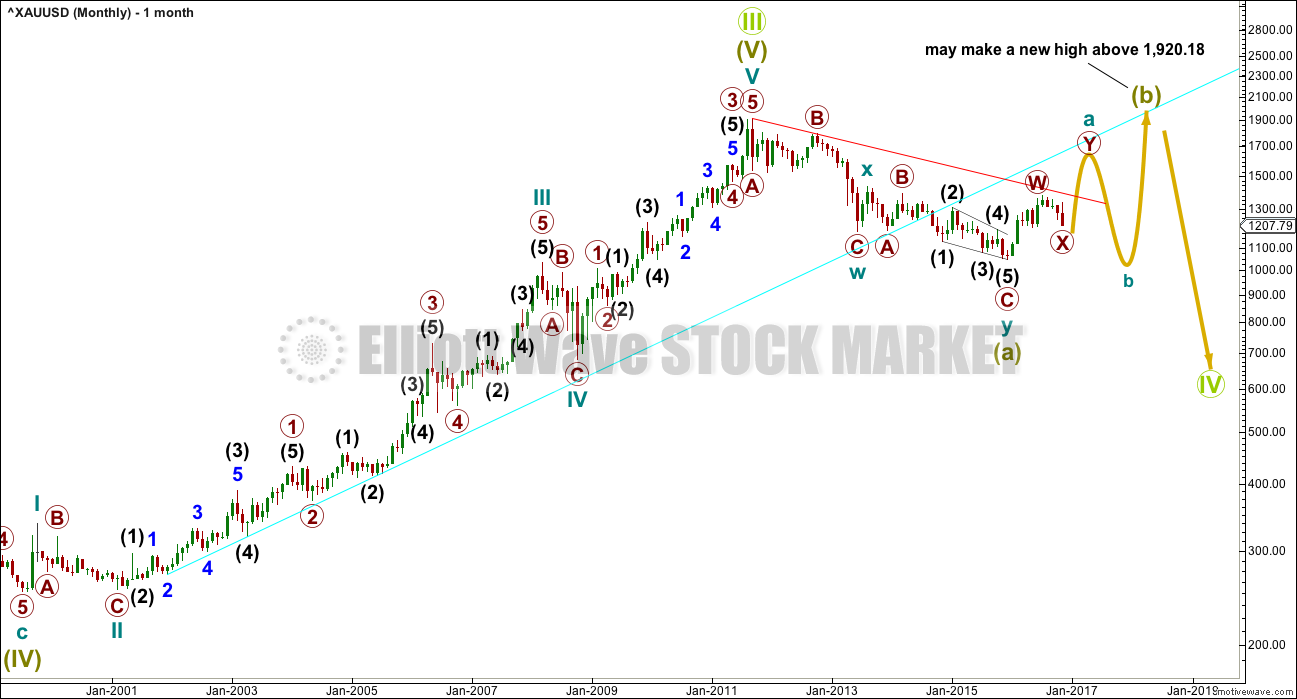
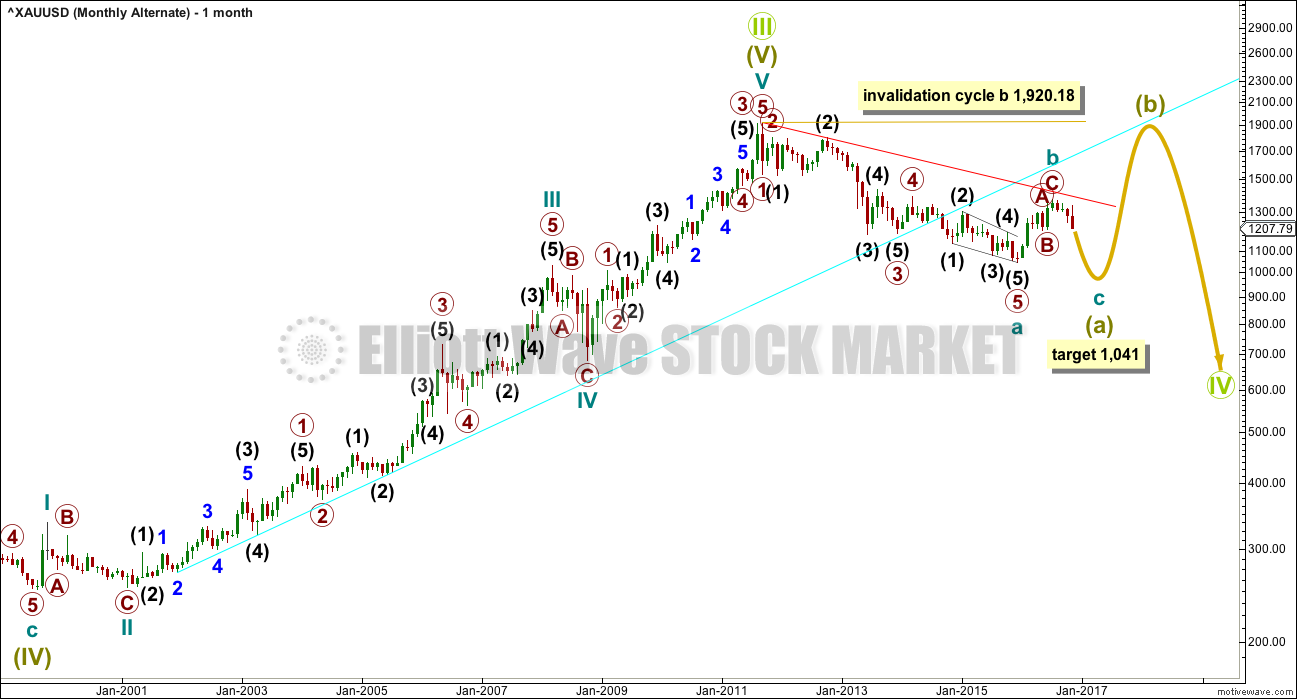
The large wave down labelled Super Cycle wave (a) may be seen either as a three or a five. It fits best as a three.
If Super Cycle wave (a) is a three, then Super Cycle wave (b) may make a new high above its start at 1,920.18.
The larger structure is seen as Grand Super Cycle wave IV. When a fourth wave begins with a three wave structure for its A wave, then a flat, combination or triangle is indicated. In this case, with Super Cycle wave (a) a double zigzag, a combination for Grand Super Cycle wave IV may be eliminated because multiples may not subdivide into multiples. This leaves two possible structures for Grand Super Cycle wave IV: a flat or a triangle.
If Grand Super Cycle wave IV is unfolding as a flat correction, then within it Super Cycle wave (b) must retrace a minimum 0.9 length of Super Cycle wave (a) at 1,832.78.
If Grand Super Cycle wave IV is unfolding as a triangle, then there is no minimum requirement for Super Cycle wave (b) within it. While there is no minimum, Super Cycle wave (b) is highly unlikely to be over here because it should be deeper. A common range for subwaves of triangles is about 0.8 to 0.85 the prior wave; this is from 1,745 to 1,789. For a triangle to have the right look, Super Cycle wave (b) should be only about half way through.
Super Cycle wave (b) must subdivide as a three wave structure.
WEEKLY ELLIOTT WAVE COUNT
Click chart to enlarge.
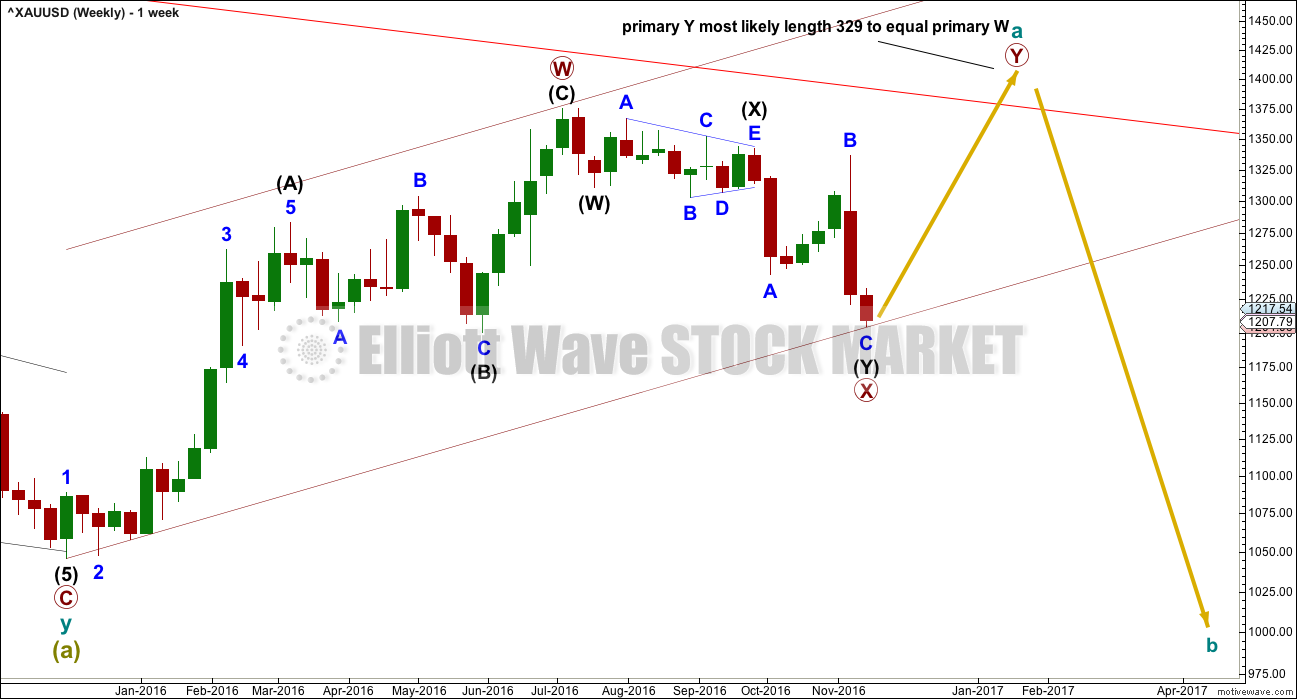
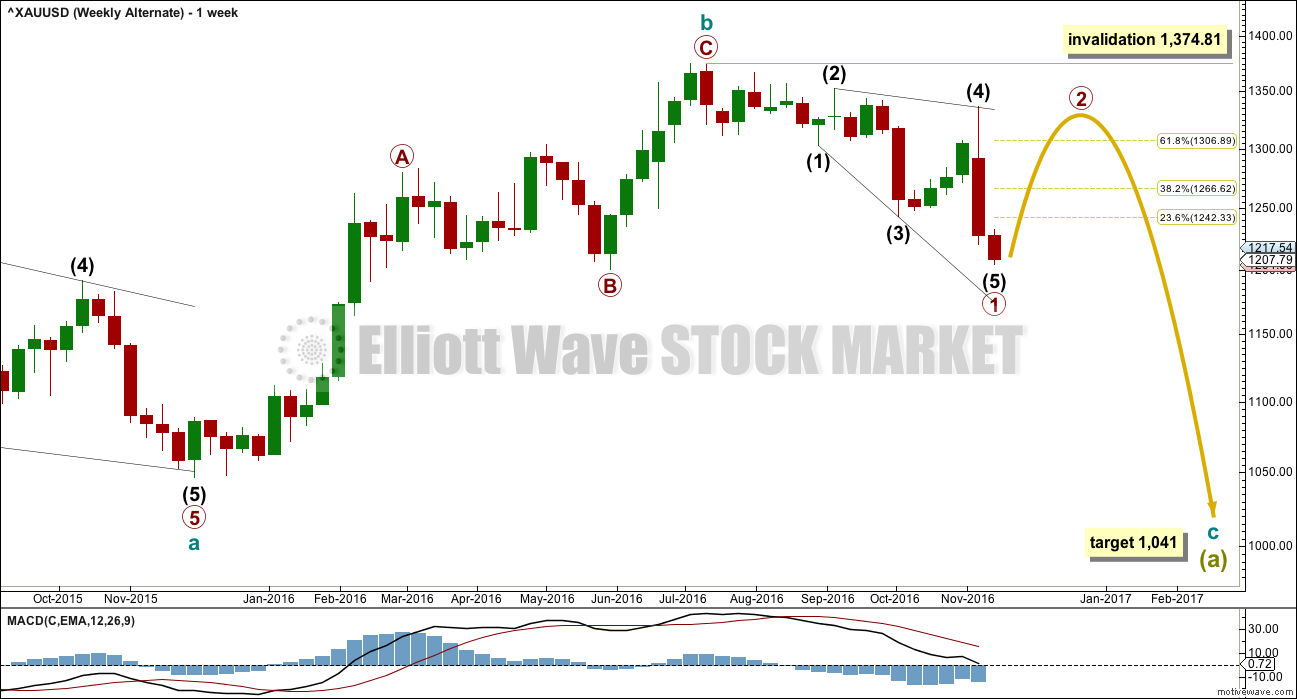
The wave up from the low on the 3rd of December, 2015, fits best as a three and looks like a zigzag. It is possible (just) that it may be a five and this idea is outlined in an alternate below.
If cycle wave a is subdividing as a three, it may be an incomplete double zigzag. The first zigzag in the double is labelled primary wave W and the double is joined by an incomplete three in the opposite direction labelled primary wave X.
The maximum number of corrections within multiple corrective structures is three. To label multiples within multiples increases the maximum beyond three violating the rule. Within each of W, Y and Z, they may only be labelled simple corrective structure A-B-C (or A-B-C-D-E in the case of triangles). X waves however are not included in the maximum; they are joining structures in the opposite direction and may subdivide as any corrective structure including multiples.
DAILY ELLIOTT WAVE COUNT
Click chart to enlarge.
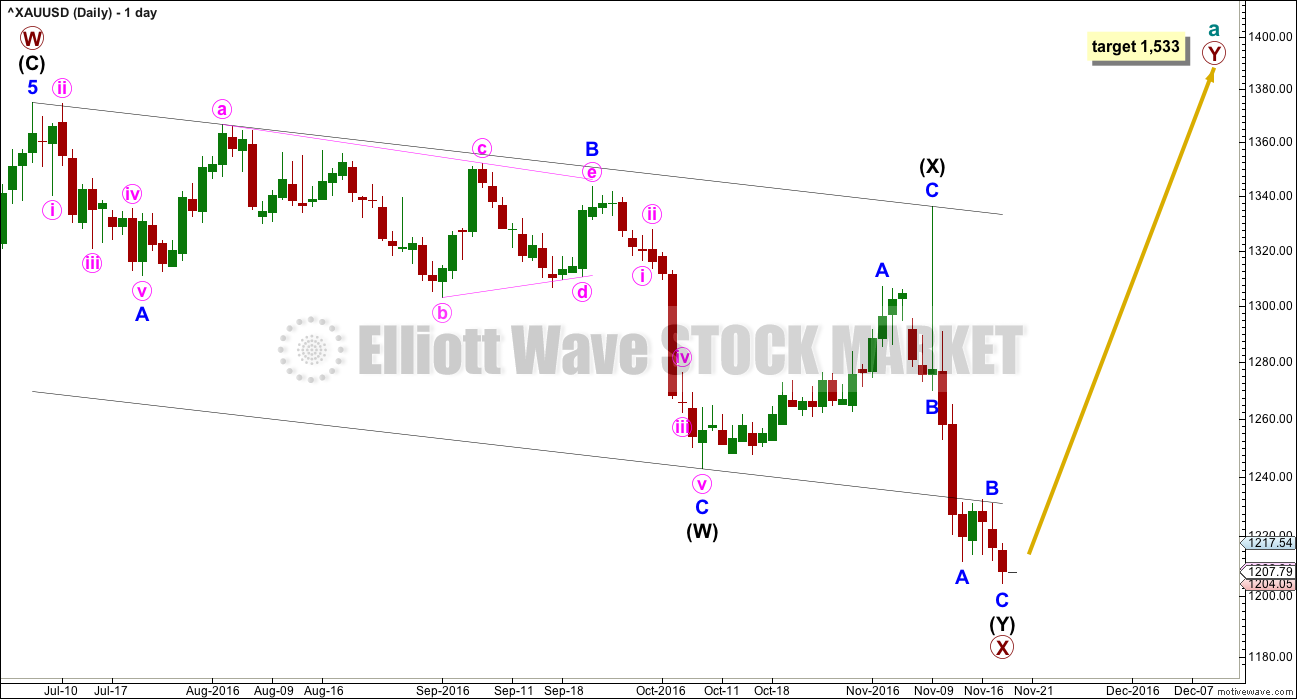
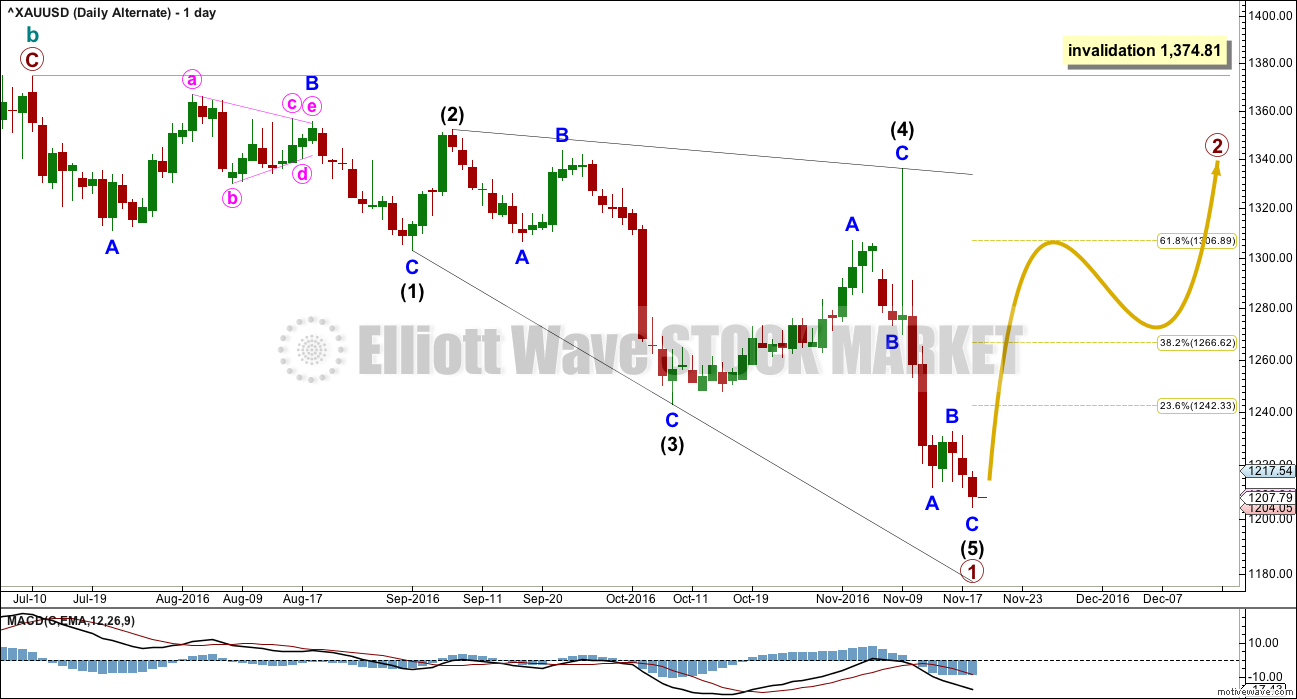
The larger structure of primary wave X may be either a double zigzag or a double combination. The second structure in this double for primary wave Y may be either a zigzag (for a double zigzag) or a flat or a triangle (for a double combination).
It is my judgement at this stage that it is more likely primary wave X will be a double zigzag due to the relatively shallow correction of intermediate wave (X). Although intermediate wave (X) is deep at 0.71 the length of intermediate wave (W), this is comfortably less than the 0.9 minimum requirement for a flat correction. Within combinations the X wave is most often very deep and looks like a B wave within a flat.
However, there is no minimum nor maximum requirement for X waves within combinations, so both a double zigzag and double combination must be understood to be possible. A double zigzag is more likely and that is how this analysis shall proceed.
Within the second structure, minor wave A should be a five wave structure. This now looks complete.
Minor wave B found resistance at the lower edge of the wide parallel channel about primary wave X. Minor wave C may now be complete at the hourly chart level. Minor wave C has no Fibonacci ratio to minor wave A. Intermediate wave (Y) is just 0.02 longer than equality in length with intermediate wave (W).
At 1,533 primary wave Y would reach equality in length with primary wave W.
Primary wave W lasted seven months. Primary wave Y may be expected to be about even in duration.
HOURLY ELLIOTT WAVE COUNT
Click chart to enlarge.
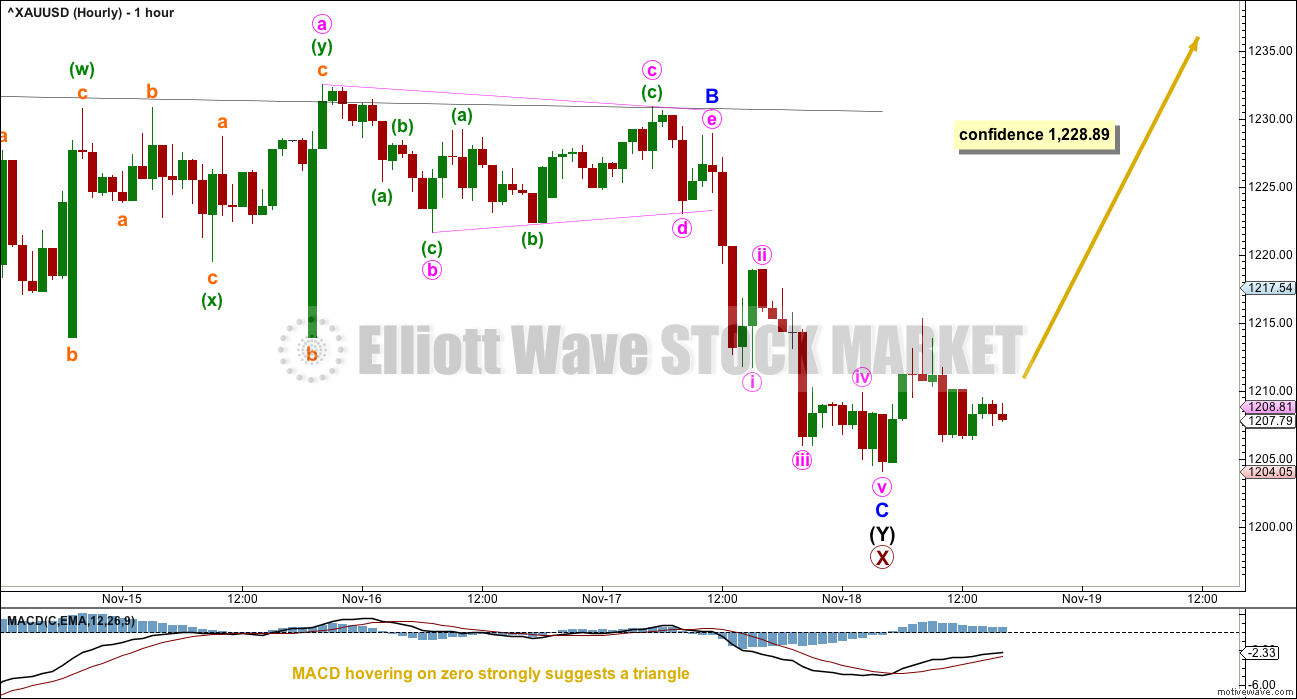
Minor wave B completed as a regular contracting triangle. Gold often exhibits surprisingly short waves out of its triangles.
Minor wave C has moved slightly below the end of minor wave A, avoiding a truncation. The structure now looks complete at the hourly chart level.
Within minor wave C, there are no adequate Fibonacci ratios between minute waves i, iii and v.
A new high above 1,228.89 could not be a second wave correction within minor wave C, so at that stage minor wave C would have to be over. This would add confidence to the wave count.
ALTERNATE MONTHLY ELLIOTT WAVE COUNT
Click chart to enlarge.
It is also possible to see the large downwards wave from the all time high as a five wave structure. Super Cycle wave (a) may be an incomplete zigzag, to subdivide 5-3-5.
Problems with this wave count:
1. Within cycle wave a, intermediate wave (2) lasted nine months where primary wave 2 one degree higher lasted only two months. This gross disproportion is highly unusual for Gold, especially at such a large degree. This substantially reduces the probability of this wave count.
2. Primary wave 3 ends with a slight truncation of 1.96. This is entirely acceptable, and it barely reduces the probability of this wave count.
If cycle wave a is a five, then cycle wave b may not move beyond its start above 1,920.18. Cycle wave b may now be a complete single zigzag ending just below the 0.382 Fibonacci ratio of cycle wave a. Cycle wave b is 0.376 the length of cycle wave a. Cycle wave b may have ended close to resistance at the red trend line.
At 1,041 cycle wave c would reach 0.382 the length of cycle wave a.
ALTERNATE WEEKLY ELLIOTT WAVE COUNT
Click chart to enlarge.
If the last high was a trend change at cycle degree, then a five wave structure downwards should develop from there.
Cycle wave c must subdivide as a five wave structure. It may be either an impulse or ending diagonal. Within cycle wave c, the first wave of primary wave 1 must also be a five, either an impulse or a leading diagonal.
It is possible that primary wave 1 completed as a leading expanding diagonal. However, while these are not rare structures they are not very common either. When first waves subdivide as diagonals, they are most often contracting and not commonly expanding. This further reduces the probability of this wave count.
When first waves subdivide as leading diagonals, they are then typically followed by very deep second waves. Primary wave 2 would most likely be deeper than the 0.618 Fibonacci ratio of primary wave 1.
Primary wave 2 may not move beyond the start of primary wave 1 above 1,374.41.
ALTERNATE DAILY ELLIOTT WAVE COUNT
Click chart to enlarge.
Within leading diagonals, sub-waves 2 and 4 must subdivide as zigzags. Sub-waves 1, 3 and 5 are most commonly zigzags but sometimes may also appear to be impulses.
Within this structure, all sub-waves subdivide as zigzags. This wave count meets all Elliott wave rules. This diagonal looks correct.
Primary wave 1 lasted 94 days. Primary wave 2 may initially be expected to last about a Fibonacci 55 or 89 days. It should be a big three wave structure.
At this stage, there is no divergence in expected direction between this alternate and the main wave count. The structure of upwards movement, if it is clearly a three or five, may assist to tell us which wave count is correct in coming weeks. For now this alternate must be judged to have a low probability due to the problems outlined. It is published to consider all possibilities.
TECHNICAL ANALYSIS
WEEKLY CHART
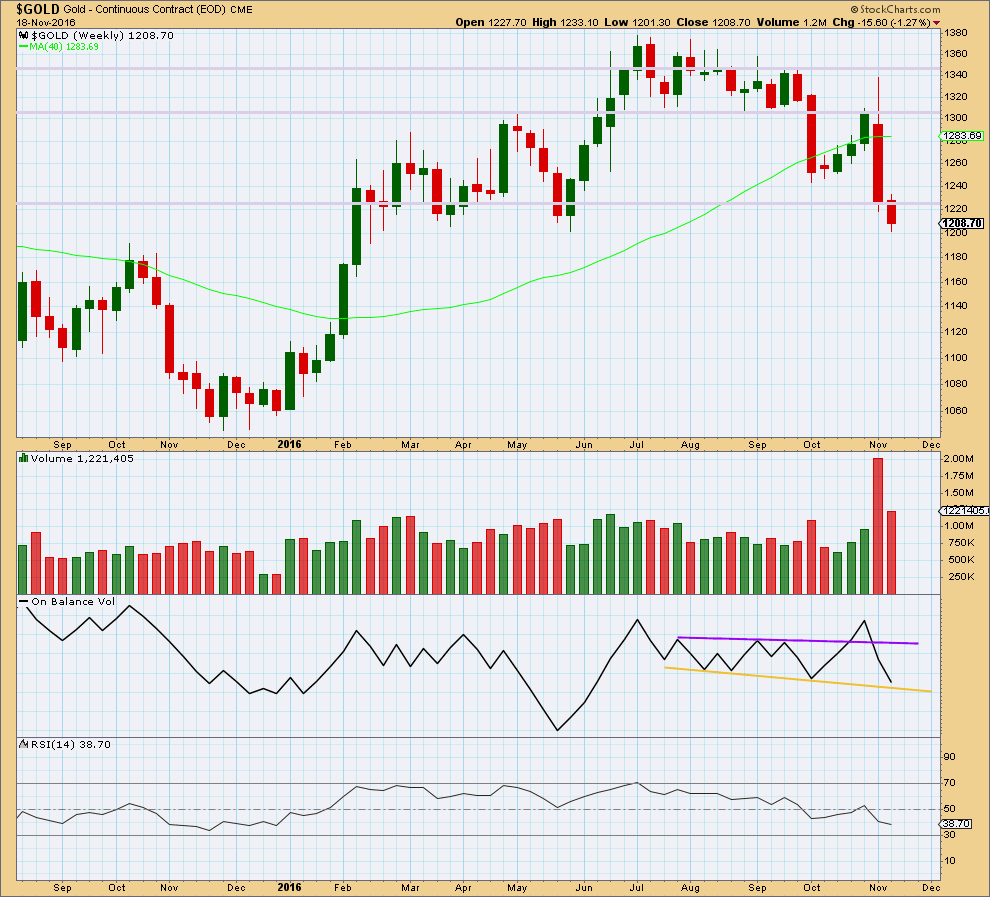
Click chart to enlarge. Chart courtesy of StockCharts.com.
This week completes with a smaller range and a substantial decline in volume. The fall in price is not supported by volume, so it is suspicious. It looks like bears are tired.
Price may find support here about 1,200.
On Balance Volume has come down to almost touch the yellow support line. There is a very little room for more downwards movement. This line should be expected to provide support and assist to halt the fall in price either here or very soon.
RSI is not extreme and does not exhibit divergence with price. There is room still for price to fall further.
DAILY CHART
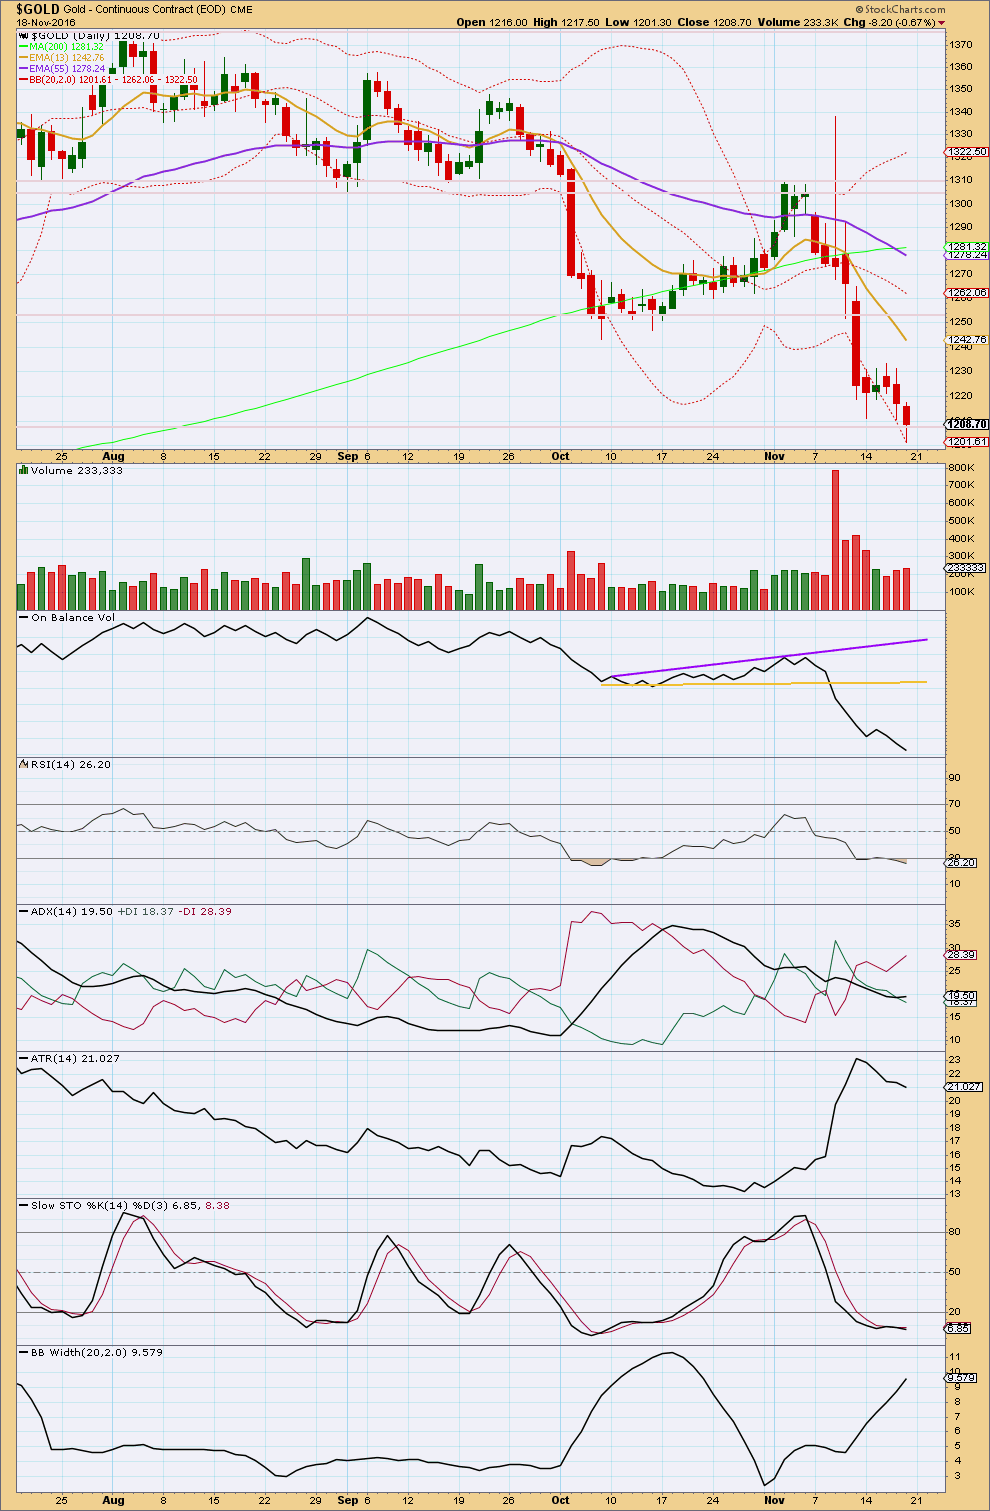
Click chart to enlarge. Chart courtesy of StockCharts.com.
Two days in a row of downwards movement now comes with slowly increasing volume. There is some support short term for the fall in price. Volume is still much lighter than the strong downwards day of the 9th of November though.
At the daily chart level, there is no support line close by for On Balance Volume. There is no divergence between price and OBV either to indicate weakness. There is room for price to fall further.
RSI is oversold. There is mid term divergence between the lows for price and RSI from the 6th of October to Friday’s session: price has made a lower low, but RSI has made a slightly higher low. This is regular bullish divergence and indicates bears are exhausted.
ADX is now slightly increasing and the -DX line is above the +DX line. ADX now indicates a downwards trend is in place. Bollinger Bands agree as they continue to widen.
ATR disagrees as it is declining. With two of these three indictors suggesting a downwards trend, it should be assumed that this is what is happening. However, none of these indicators will indicate when that trend may change.
Stochastics is oversold and now exhibits divergence with price between the low for Friday and the prior low of the 6th of October. This indicates bears are exhausted and a trend change is reasonably likely here. This supports the Elliott wave count. I would prefer to see also short term divergence between price and Stochastics, and this may still develop if price moves slightly lower for Monday and / or Tuesday but Stochastics moves higher. There is still the risk to any long positions that the low is not yet in place.
As always, if choosing to enter a long position here, it is essential that members manage risk. Always use a stop loss, even if it is only mental. Trading without a stop exposes the full equity in your account to risk. Do not invest more than 3-5% of equity in your account in any one trade. Risk management is the single most important aspect of trading. Please take this warning very seriously, particularly inexperienced members.
This analysis is published @ 09:11 p.m. EST on 19th November, 2016.
Looks like Stockcharts has the late afternoon spike in their data.
The move up today was very weak on low volume. Also, the dreaded “death” cross of the 50 & 200 MA just occurred. Not exactly what you want to see in a bull market.
Gold is really testing everyone. If the bottom is in, it’s getting off to a very slow start…
Hourly update: I’m not sure what to make of this big spike up and back down on the hourly chart. I’m wondering if that is going to disappear shortly?
A series of three overlapping first and second waves may be complete.
No spike on Investing.com, PMBull, or Kitco. May be fantom.
Nor on my broker CMC either. Yeah, I think it’s a phantom.
Rambus has turned rather bearish on gold.
https://rambus1.com/2016/11/20/weekend-report-118/
That’s a good report, thanks Dreamer.
There’s some good support there for the alternate bearish EW count.
Lara, forgive me if my eyes aren’t seeing this right, but it looks like you’ve got your weekly labeled differently than on your daily. For example intermediate W on weekly ends in July, but on daily that is minor A and the intermediate W ends in October. Weekly intermediate X is minor B on daily and the intermediate X on daily ends in November as opposed to October.
Also, did the weekly alt IV from Nov 11th get thrown out? Wondering if that is still valid.
First question: you’re absolutely right. I did not update my weekly chart. Thank you.
Second question: No. Not yet. As it does not diverge at all in terms of structure of downwards movement (I would change this to seeing a leading expanding diagonal now complete down) with the new alternate, I did not want to publish two wave counts which expect exactly the same direction next.
COT is at levels similar to those at the time of the last major bottom in May. This may be enough for gold to start the next leg up.
Lara, as a student of the markets, you may find this 1937 document of interest.
https://goldtadise.com/?p=387859
Thank you very much for uploading this Dreamer. Yes, I do find it very interesting.