**Edit: This wave count has been clearly invalidated. I will use my prior wave count found here.
Sometimes it takes someone pointing out a different way of seeing things in order for one to remove one’s blinkers. I was having difficulty with my count for gold, and maybe I have a bias towards trying to always see extended third waves. Either way a most helpful comment from a viewer at just the right time leads me to rework my count for gold.
I will not publish my previous wave count, but I will retain it just in case price starts to fall with an increase in momentum.
Click on the charts below to enlarge.
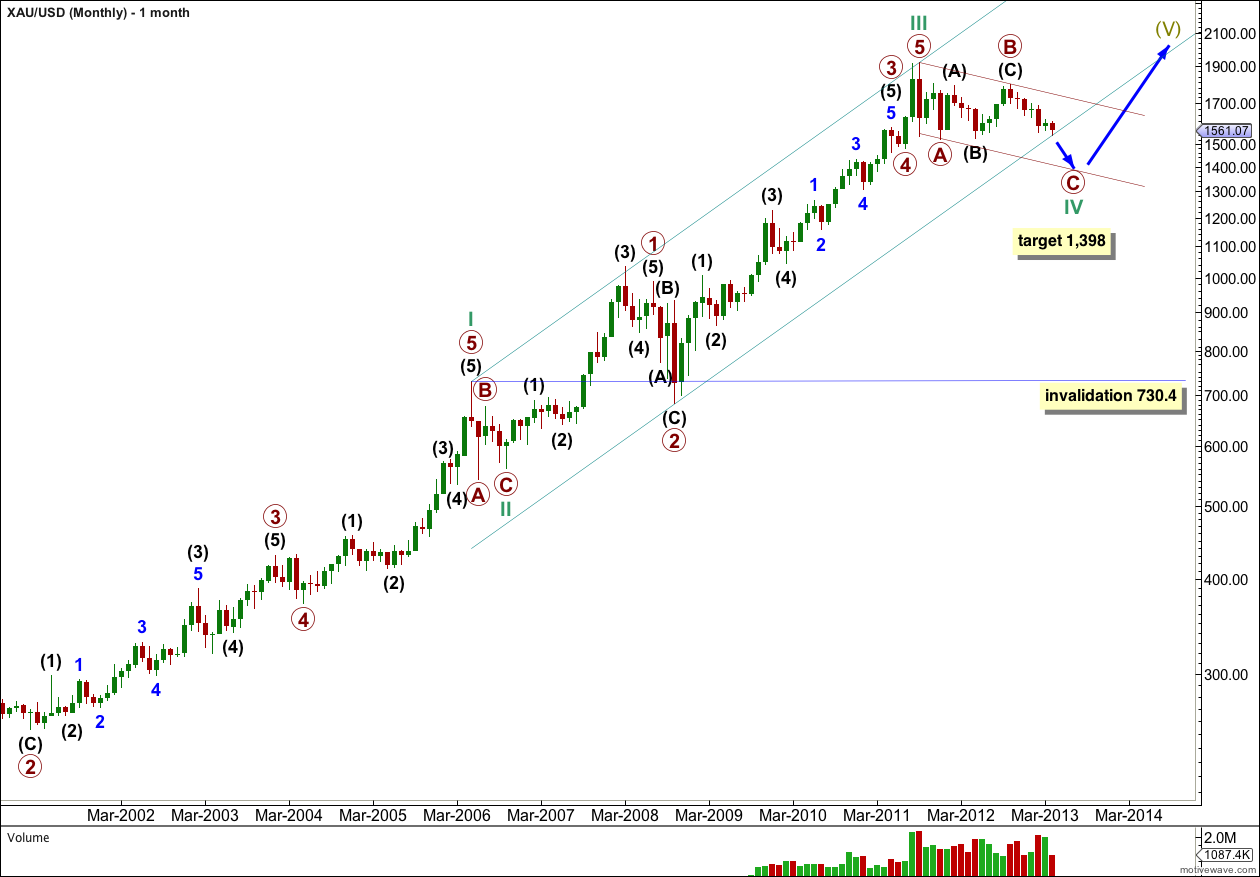
I expect gold is within a large cycle degree fourth wave correction. When this first zigzag structure is complete I will have an alternate wave count which sees it as just primary wave A within a flat for cycle wave IV. When the zigzag is complete this main wave count will see cycle wave IV as complete.
I will not cover all the Fibonacci ratios within this monthly chart again, they may be seen here.
This chart is viewed using a semi-log scale.
I have drawn a best fit parallel channel about this movement. The first trend line is drawn from the highs of cycle waves I to III, then a parallel copy is placed upon the low of primary wave 2 within cycle wave III. At this time price has found a little support about the lower edge of this channel.
I have also drawn a channel about the zigzag for cycle wave IV. The first trend line is drawn from the all time high, the start of primary wave A, to the end of primary wave B. Then a parallel copy is placed upon the end of primary wave A. I would expect primary wave C to be very likely to find strong support about the lower edge of this channel.
At 1,398 primary wave C would reach equality in length with primary wave A.
Cycle wave IV may not move into cycle wave I price territory. This wave count is invalidated with movement below 730.4.
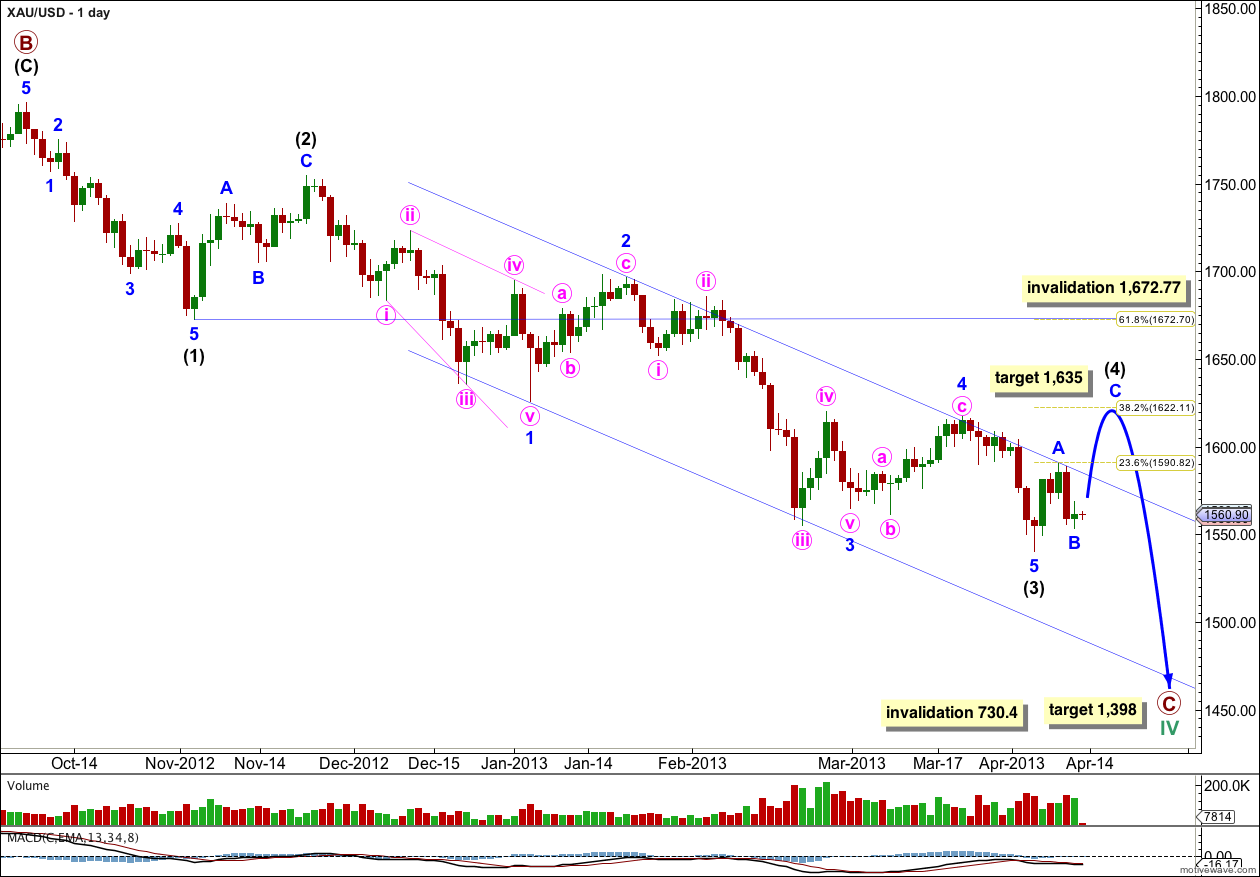
This daily chart shows the structure of primary wave C.
Within primary wave C intermediate waves (1) through to (3) may be complete.
Intermediate wave (3) is 14.86 longer than 1.618 the length of intermediate wave (1), a 6.9% variation which is acceptable.
Intermediate wave (3) shows an increase in momentum as indicated by MACD.
Ratios within intermediate wave (3) are: minor wave 3 is just 2.66 longer than equality with minor wave 1, and minor wave 5 is 4.99 short of 0.618 the length of minor wave 1.
Within minor wave 3 there are no adequate Fibonacci ratios between minute waves i, iii and v.
Within intermediate wave (3) minor waves 2 and 4 show perfect alternation; minor wave 2 was a relatively deep zigzag correction and minor wave 4 was a relatively shallow flat correction.
Minor wave 5 may have ended midway within the parallel channel containing intermediate wave (3), a common place for fifth waves to end.
We need to see this channel breached clearly by upwards movement to have confidence that intermediate wave (3) is over and intermediate wave (4) is underway.
Within intermediate wave (4) minor waves A and B may be complete, or this may only be the start of minor wave A. At 1,635 minor wave C would reach 1.618 the length of minor wave A and intermediate wave (4) would reach to just above the 0.382 Fibonacci ratio of intermediate wave (3).
Intermediate wave (4) may not move into intermediate wave (1) price territory. This wave count is invalidated with movement above 1,672.77.


