
Last week’s analysis of gold expected downwards movement. We have seen some downwards movement, but before price moved lower a breach of 1,485.49 invalidated the hourly wave count.
Price remains below the invalidation point on the daily wave count. I have adjusted the wave count to see better proportions within this third wave. This affects targets.
Click on the charts below to enlarge.
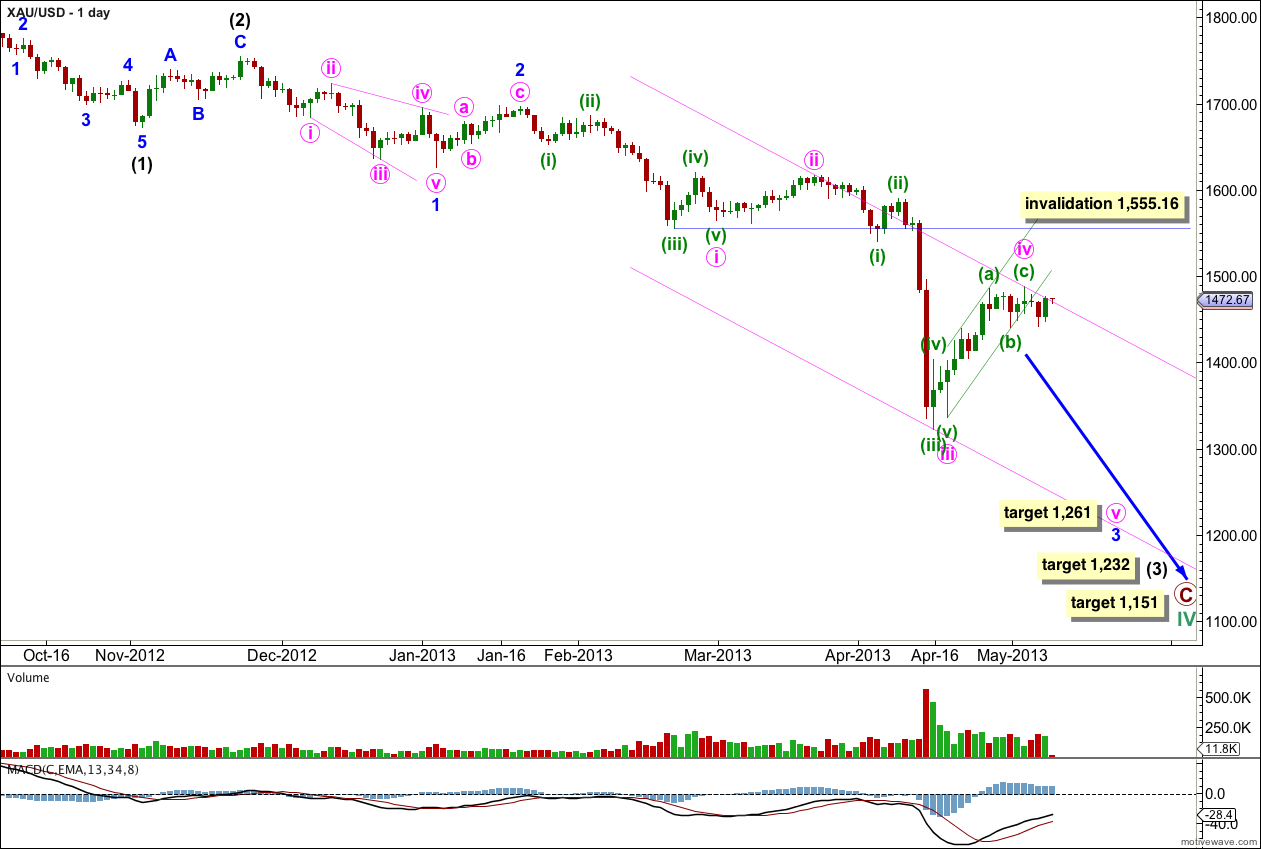
This daily chart focuses on the new downwards trend of primary wave C.
Last week’s analysis saw upwards movement from the low at 1,321.86 as a fourth wave at minuette degree. This now looks too much out of proportion for the daily chart; it no longer has the right look. I have moved the degree of labeling for this correction up one degree.
Within primary wave C intermediate waves (1) and (2) are complete. Intermediate wave (3) is underway and may have just passed the middle of it.
Within intermediate wave (3) minor waves 1 and 2 are complete and minor wave 3 may have just passed its middle.
Within minor wave 3 minute waves i, ii and iii are complete. Minute wave iv is most likely complete.
Ratios within minute wave iii are: minuette wave (iii) has no Fibonacci ratio to minuette wave (i), and minuette wave (v) is 3.91 longer than 0.236 the length of minuette wave (iii). Minuette wave (v) is slightly truncated.
At 1,261 minute wave v would reach 1.618 the length of minute wave i. Because there is no Fibonacci ratio between minute waves i and iii I expect we shall see a Fibonacci ratio between minute wave v and either of iii or i.
Draw a channel about minor wave 3 using Elliott’s second technique. Draw the first trend line from the highs of minute waves ii and iv, then place a parallel copy upon the low of minute wave iii. Expect minute wave v to end midway within this channel most likely, or to find support at the lower edge if it gets down there. When this channel is breached by subsequent upwards movement then minor wave 3 should be over and minor wave 4 should be underway.
At 1,232 intermediate wave (3) would reach 4.236 the length of intermediate wave (1).
At 1,151 primary wave C would reach 1.618 the length of primary wave A.
If minute wave iv continues further it may not move back into minute wave i price territory. This wave count is invalidated with movement above 1,555.16.
Draw a small parallel channel about minute wave iv. Draw the first trend line from the truncated end of minute wave iii to the low of minuette wave (b). Place a parallel copy upon the high of minuette wave (a). This channel shows where price found support and resistance during the upwards movement of minute wave iv very nicely. Copy this channel over to the hourly chart.
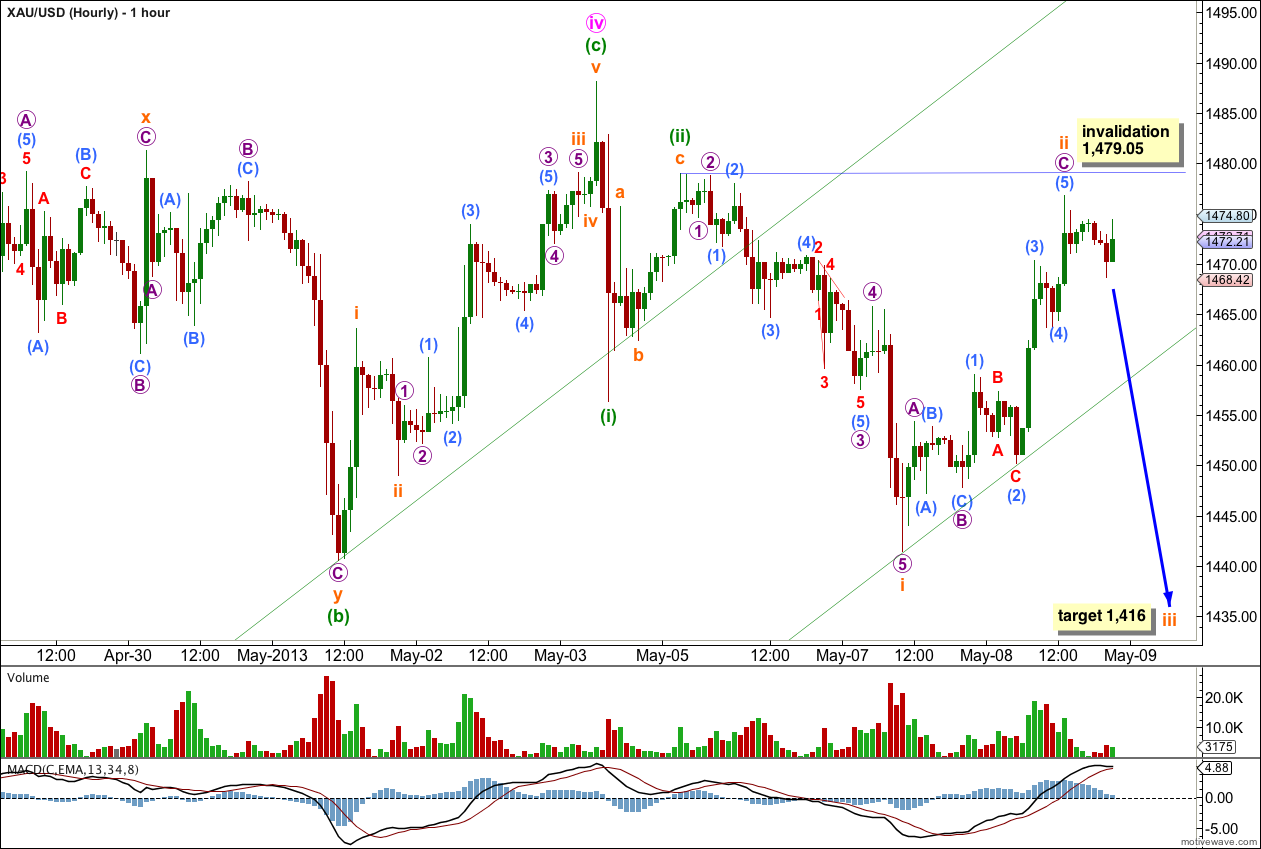
The higher green trend line is the lower edge of the channel copied over from the daily chart. Create another parallel copy and place it upon the low of submineutte wave i downwards. This third trend line shows where price is finding support over the last couple of days. When this trend line is breached by downwards movement I will have more confidence in the target here.
Within minute wave iv there is no Fibonacci ratio between minuette waves (a) and (c).
Minuette wave (b) subdivides into a combination: flat – X – zigzag.
Ratios within minuette wave (c) are: subminuette wave iii has no Fibonacci ratio to subminuette wave i, and subminuette wave v is just 0.87 longer than 0.382 the length of subminuette wave iii.
Ratios within subminuette wave iii of minute wave (c) are: micro wave 3 has no Fibonacci ratio to micro wave 1, and micro wave 5 is just 0.04 short of equality with micro wave 1.
Ratios within micro wave 3 of subminuette wave iii of minuette wave (c) are: submicro wave (3) has no Fibonacci ratio to submicro wave (1), and submicro wave (5) is 0.34 short of 0.618 the length of submicro wave (3).
Within the new downwards trend ratios are:
There is no Fibonacci ratio between submicro waves a and c within minuette wave (ii).
Within subminuette wave i there are no adequate Fibonacci ratios between micro waves 1, 3 and 5.
Ratios within micro wave 3 are: submicro wave (3) has no Fibonacci ratio to submicro wave (1), and submicro wave (5) is 0.12 short of equality with submicro wave (3).
Within subminuette wave ii there is no Fibonacci ratio between micro waves A and C.
Ratios within micro wave C are: submicro wave (3) is 1.95 longer than 1.618 the length of submicro wave (1), and submicro wave (5) is 1.13 longer than equality in length with submicro wave (1).
At 1,416 subminuette wave iii would reach 1.618 the length of subminuette wave i. This target should be met about mid next week (or earlier).
If subminuette wave ii continues further it may not move beyond the start of subminuette wave i. This wave count is invalidated with movement above 1,479.05.
If this wave count is invalidated with upwards movement then it may be minute wave iv moving higher as a double zigzag or double combination. The invalidation point on the hourly chart would move up to the same point as on the daily chart at 1,555.16.