
Last week’s analysis expected a triangle to complete and a sharp upwards thrust to follow it. The triangle did complete and remained valid as price remained above 1,388.88. The sharp upward thrust did happen but it did not reach the expectation of 1,475. A subsequent breach of the parallel channel indicated a trend change.
Click on the charts below to enlarge.
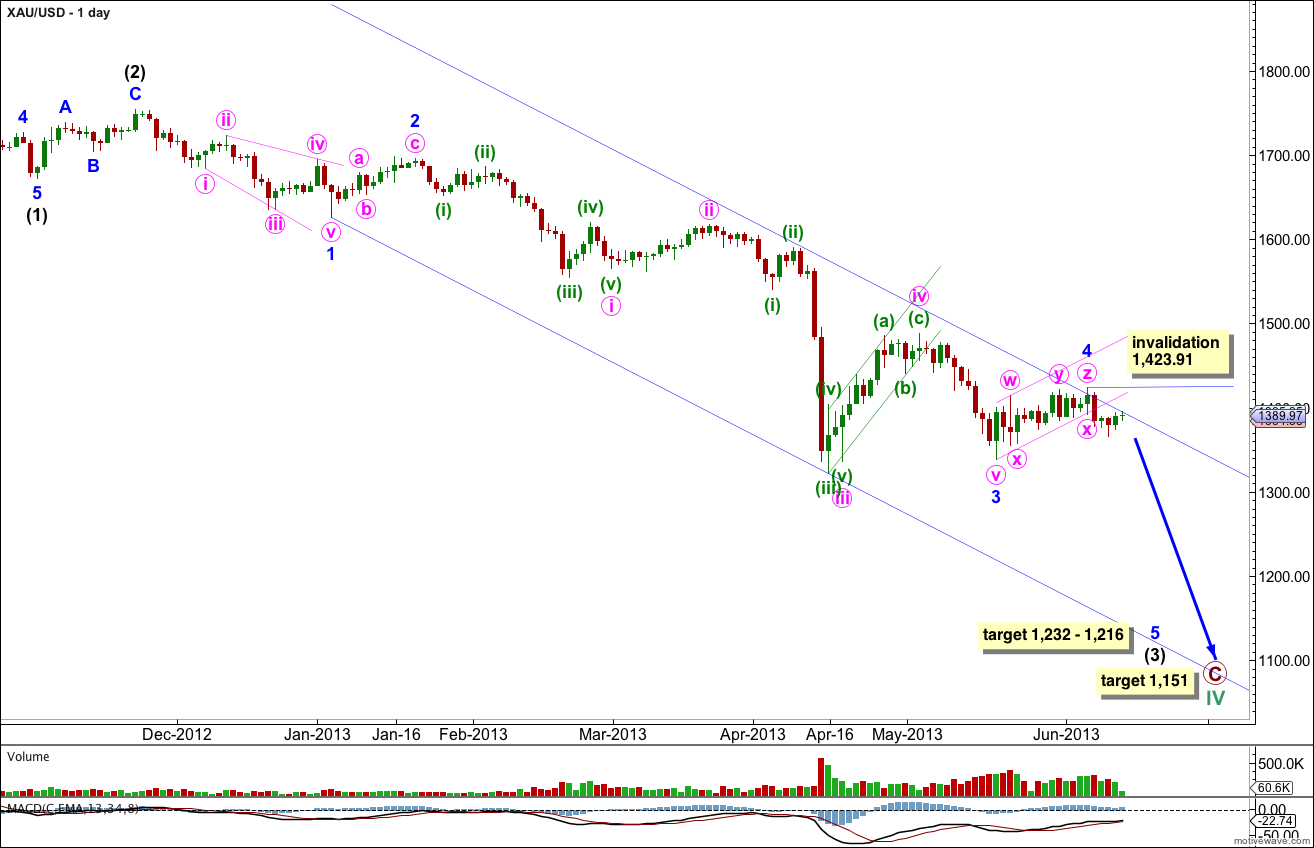
This daily chart focuses on the new downwards trend of primary wave C.
Within primary wave C intermediate waves (1) and (2) are complete. Intermediate wave (3) is underway and may have just passed the middle of it.
Within intermediate wave (3) minor waves 1, 2 and 3 are complete. Minor wave 4 is now probably complete also.
At 1,232 intermediate wave (3) would reach 4.236 the length of intermediate wave (1). At 1,216 minor wave 5 would reach 1.618 the length of minor wave 1. This gives a $16 target zone which should be about 6 weeks away.
At 1,151 primary wave C would reach 1.618 the length of primary wave A.
A small parallel channel drawn about minor wave 4 is now clearly breached by downwards movement. This is an indication that minor wave 4 should be over and minor wave 5 should not be underway.
Three is the maximum number of corrective structures within a multiple and so far three structures have unfolded within minor wave 4. If my analysis of this fourth wave correction is correct then we should not see movement above 1,423.91.
Minor wave 4 ended with a clear three wave structure upwards for a final zigzag in the multiple. Thereafter, the channel containing it is clearly breached by downwards movement.
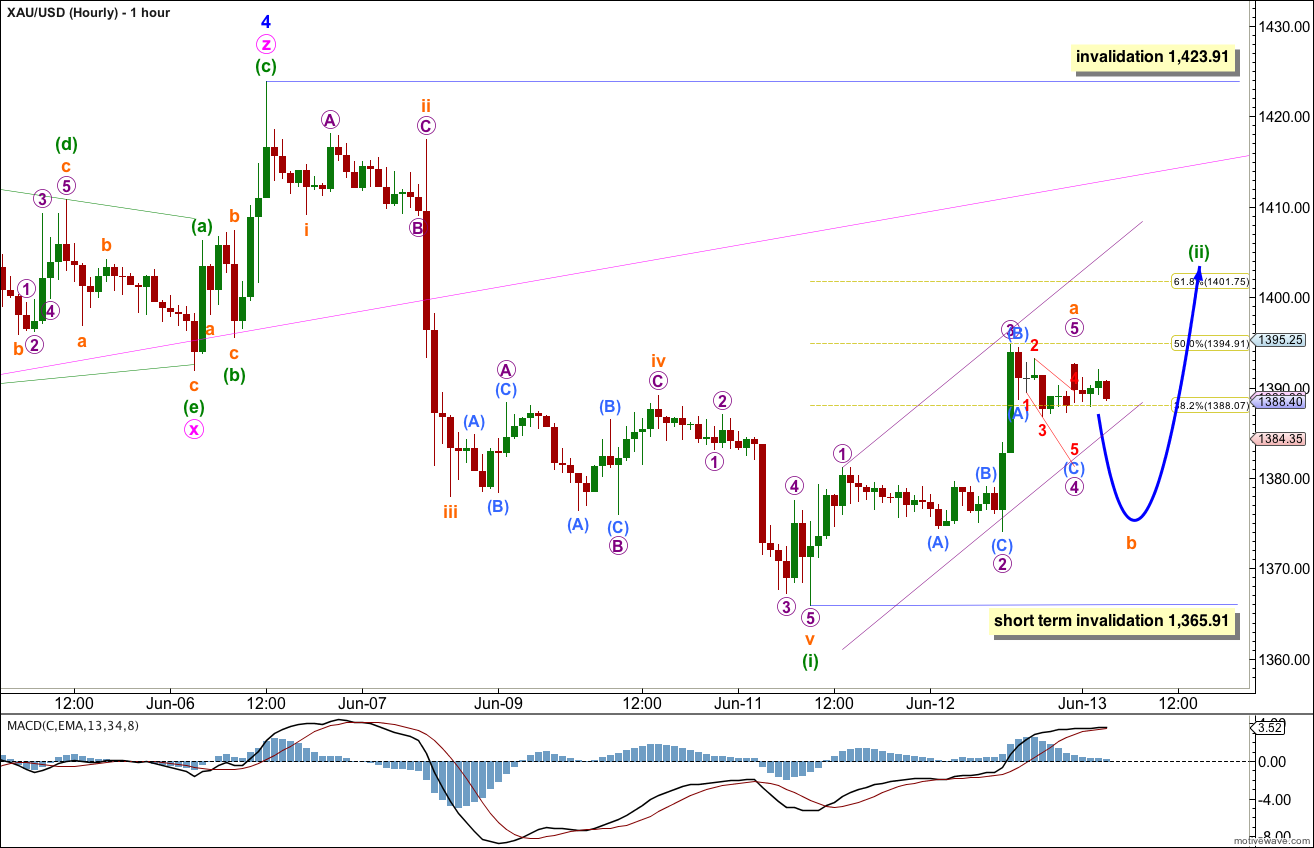
So far we have a clear five down on the hourly chart. This is further confirmation that we have seen a trend change.
Ratios within minuette wave (i) are: subminuette wave iii is just 0.75 longer than 2.618 the length of subminuette wave i, and subminuette wave v is just 0.71 short of 1.618 the length of subminuette wave i.
So far minuette wave (ii) looks like it is unfolding as a simple zigzag. Within it subminuette wave a is a clear five wave structure.
Ratios within subminuette wave a are: micro wave 3 has no Fibonacci ratio to micro wave 1, and micro wave 5 is 0.98 longer than 0.618 the length of micro wave 1.
I would expect subminuette wave b to breach the small channel containing submineutte wave a. Subminuette wave b may not move beyond the start of subminuette wave a. This wave count is invalidated in the short term with movement below 1,365.91.
Subminuette wave b should unfold as a three wave structure.
Thereafter, subminuette wave c upwards should unfold as a five and is highly likely to make an new high above the end of subminuette wave a at 1,395.02. It may end about the 0.618 Fibonacci ratio of minuette wave (i) at 1,401.75.
Minuette wave (ii) may not move beyond the start of minuette wave (i). This wave count is invalidated with movement above 1,410.92.
Minuette wave (ii) may be completed within another one or two days. We may see a trend change back to the downside during the next week, before next analysis. The next wave down is a third wave so we should see some increase in downwards momentum.
When minuette wave (ii) can be seen as a complete three wave structure the lower short term invalidation point no longer applies.