
Last analysis expected choppy overlapping movement to 1,192.45 or below in the short to mid term. Overall the wave count expected further upwards movement for a fourth wave correction at intermediate degree.
Price did not move lower, it moved higher. The most likely structure, a flat correction, is not the structure unfolding for this fourth wave.
Click on the charts below to enlarge.
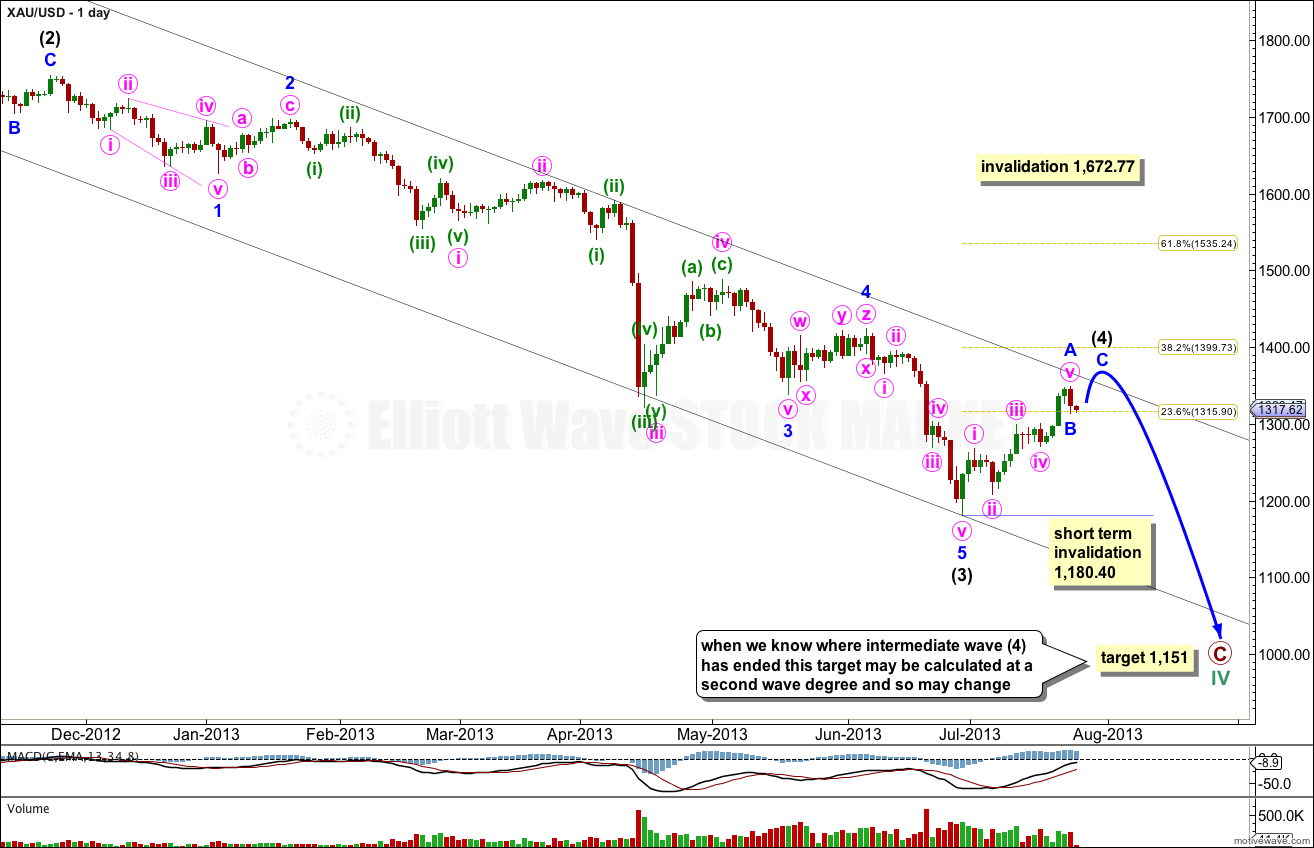
This daily chart focuses on the new downwards trend of primary wave C.
Within primary wave C intermediate waves (1) through to (3) are complete.
Intermediate wave (4) may last about three to six weeks, depending upon what structure it takes. Intermediate wave (2) lasted three weeks and was a deep 66% zigzag. Intermediate wave (4) so far has lasted almost three weeks and I would expect it is incomplete.
Intermediate wave (4) may end at either the 0.236 or 0.382 Fibonacci ratios. When there is more structure within this fourth wave to analyse then a target for it to end may be calculated.
Intermediate wave (4) may find resistance at the upper edge of the parallel channel drawn here using Elliott’s first technique. Draw the first trend line from the lows of intermediate waves (1) to (3), then place a parallel copy upon the extreme within intermediate wave (3).
Within intermediate wave (4) movement should be very choppy and overlapping. At this stage it looks like it may be unfolding as a zigzag or a double with the first structure a zigzag, because so far minor wave A subdivides as a completed five wave impulse. Within the zigzag minor wave B may not move beyond the start of minor wave A. This wave count is invalidated in the short term with movement below 1,180.40.
At 1,151 primary wave C would reach 1.618 the length of primary wave A. This target is a long term target. When we know where intermediate wave (4) has ended within primary wave C then we may use a second wave degree to also calculate this target, so it may widen to a zone or may change.
Within primary wave C intermediate wave (4) may not move into intermediate wave (1) price territory. This wave count is invalidated with movement above 1,672.77.
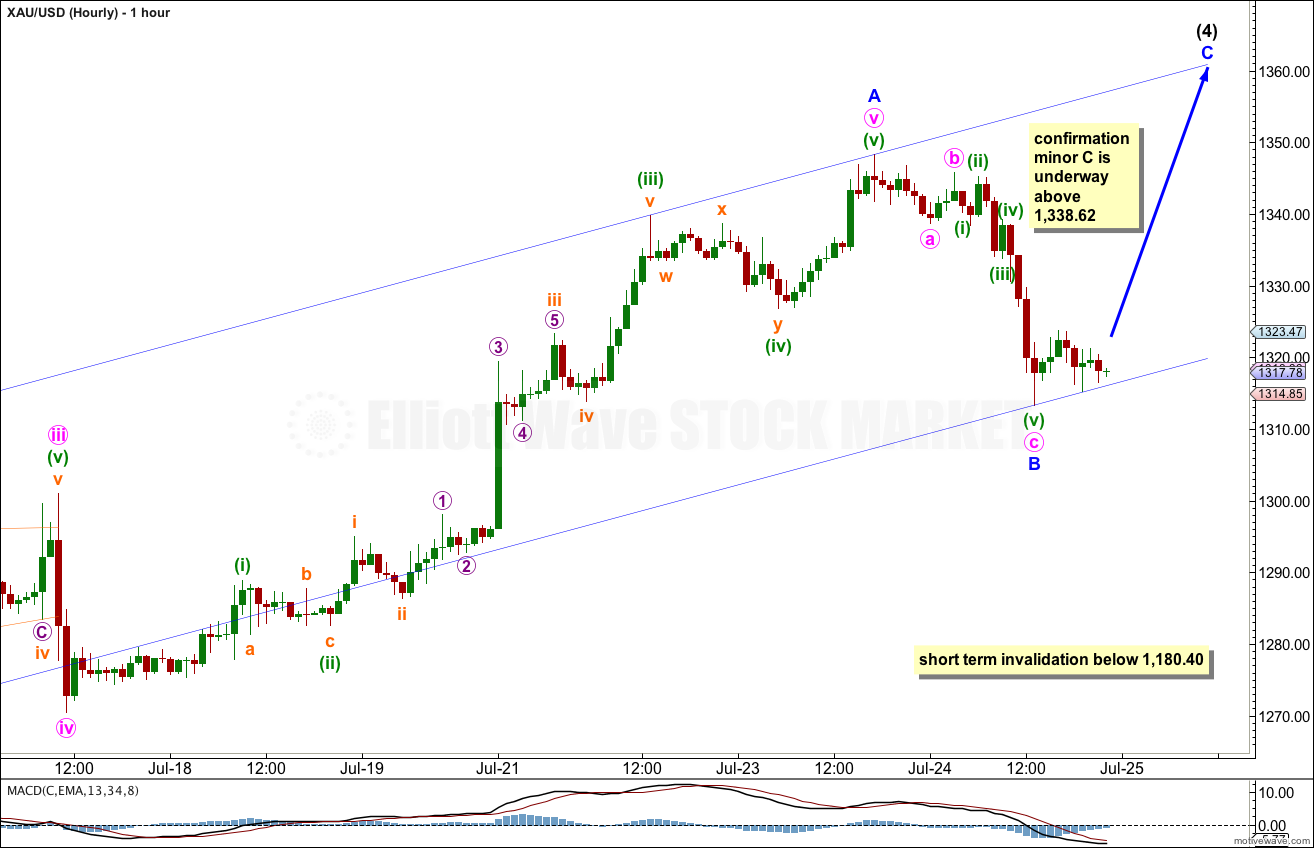
At this stage we now have a clear five wave structure upwards within minor wave A indicating intermediate wave (4) is unfolding as a zigzag or a double with the first structure a zigzag.
Ratios within minor wave A are: minute wave iii is 5.41 longer than equality with minute wave i, and minute wave v has no Fibonacci ratio to either of minute waves i or iii.
Ratios within minute wave v are: minuette wave (iii) has no Fibonacci ratio to minuette wave (i), and minuette wave (v) is just 0.38 longer than 0.382 the length of minuette wave (iii).
Within minor wave B it is possible the structure is complete, but it is also possible that it will move lower. On the five minute chart the small upwards movement following the low labeled minor wave B does not subdivide nicely as a five wave structure, so this may be a correction within a larger downwards movement for minor wave B.
When price turns and moves above 1,338.62 then minor wave B is most likely to be over and minor wave C should be underway.
Use Elliott’s technique to draw a parallel channel about intermediate wave (4). Draw the first trend line from the start of minor wave A to the end of minor wave B, then place a parallel copy upon the end of minor wave A. Expect minor wave C to end about the upper trend line.
If minor wave B moves lower then redraw the channel.
Overall I expect this structure to take a few more days to complete. It may find resistance a the upper edge of the channel drawn on the daily chart.