
Movement above 1,320.86 early in this last week confirmed the main hourly wave count which expected more upwards movement. This week I have just the one wave count for you.
Click on the charts below to enlarge.

This daily chart focuses on the new downwards trend of primary wave C within a cycle degree wave IV.
Within primary wave C intermediate waves (1) through to (3) are complete.
Intermediate wave (4) may last about four to six weeks, depending upon what structure it takes. So far it is just over four weeks. Intermediate wave (2) lasted three weeks and was a deep 66% zigzag.
Within intermediate wave (4) movement should be very choppy and overlapping. At this stage it looks like it may be unfolding as a zigzag because so far minor wave A subdivides as a completed five wave impulse.
At the high labeled minor wave A within intermediate wave (4) this movement looks strongly like a five wave impulse on the daily chart. If this is correct then intermediate wave (4) cannot be over here and must continue. I have tried to see if this can subdivide as a double zigzag. It can, just, but the wave count looks forced and must include a rare running flat.
At 1,441 minor wave C would reach equality in length with minor wave A. This target should be met in a bout a week or so. If minor wave B continues lower then this target must move correspondingly lower.
Within the zigzag minor wave B may not move beyond the start of minor wave A. This wave count is invalidated in the short term with movement below 1,180.40.
At 1,151 primary wave C would reach 1.618 the length of primary wave A. This target is a long term target. When we know where intermediate wave (4) has ended within primary wave C then we may use a second wave degree to also calculate this target, so it may widen to a zone or may change.
Within primary wave C intermediate wave (4) may not move into intermediate wave (1) price territory. This wave count is invalidated with movement above 1,672.77.
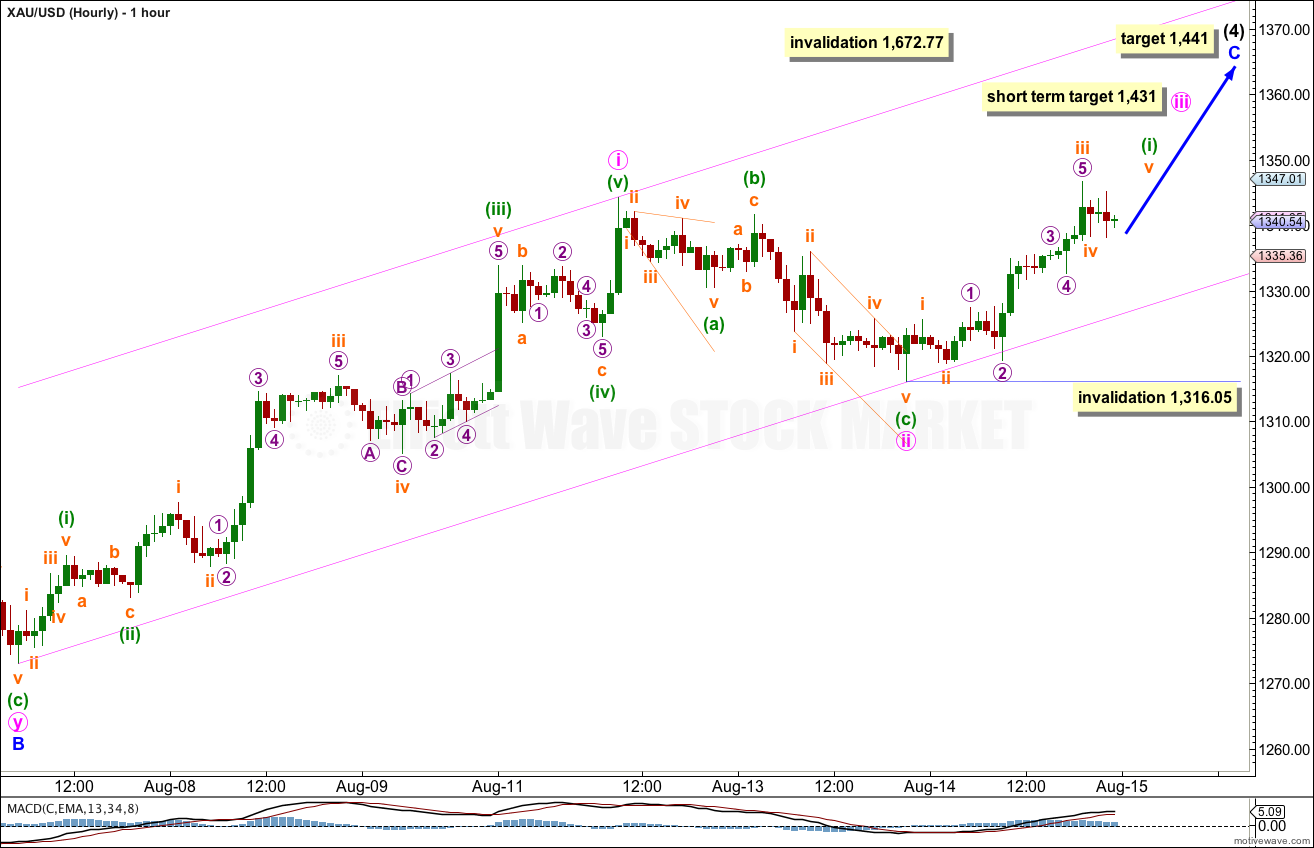
Within minor wave C only minute wave i is complete. Minute wave ii is most likely to be complete as a single zigzag structure and just 39% of minute wave i. Within minute wave ii there is no Fibonacci ratio between minuette waves (c) and (a). There is alternation between them: minuette wave (a) was a contracting diagonal and minuette wave (c) an expanding diagonal.
Ratios within minute wave i are: minuette wave (iii) has no Fibonacci ratio to minuette wave (i), and minuette wave (v) is 1.84 longer than 0.382 the length of minuette wave (iii).
Ratios within minuette wave (iii) of minute wave i are: subminuette wave iii has no Fibonacci ratio to subminuette wave i, and subminuette wave v is just 0.40 short of equality with subminuette wave iii.
Within minute wave iii minuette wave (i) is close to completion. Within it subminuette wave iii is 2.75 short of 2.618 the length of subminuette wave i.
At 1,431 minute wave iii would reach 1.618 the length of minute wave i.
The channel drawn here is an acceleration channel. I would expect to see an increase in upwards momentum over this next week and this channel may be breached by upwards movement.
When minuette wave (i) is complete then minuette wave (ii) should move price lower and may not move beyond the start of minuette wave (i). This wave count is invalidated with movement below 1,316.05.
If price moves below 1,316.05 then minuette wave (ii) is continuing. The invalidation point must then move down to the start of minute wave i at 1,273.06.