
Yesterday’s analysis expected upwards movement from gold for Thursday’s session. A slight new high was made before price turned lower. Price remains above the invalidation point on the hourly chart.
Click on the charts below to enlarge.
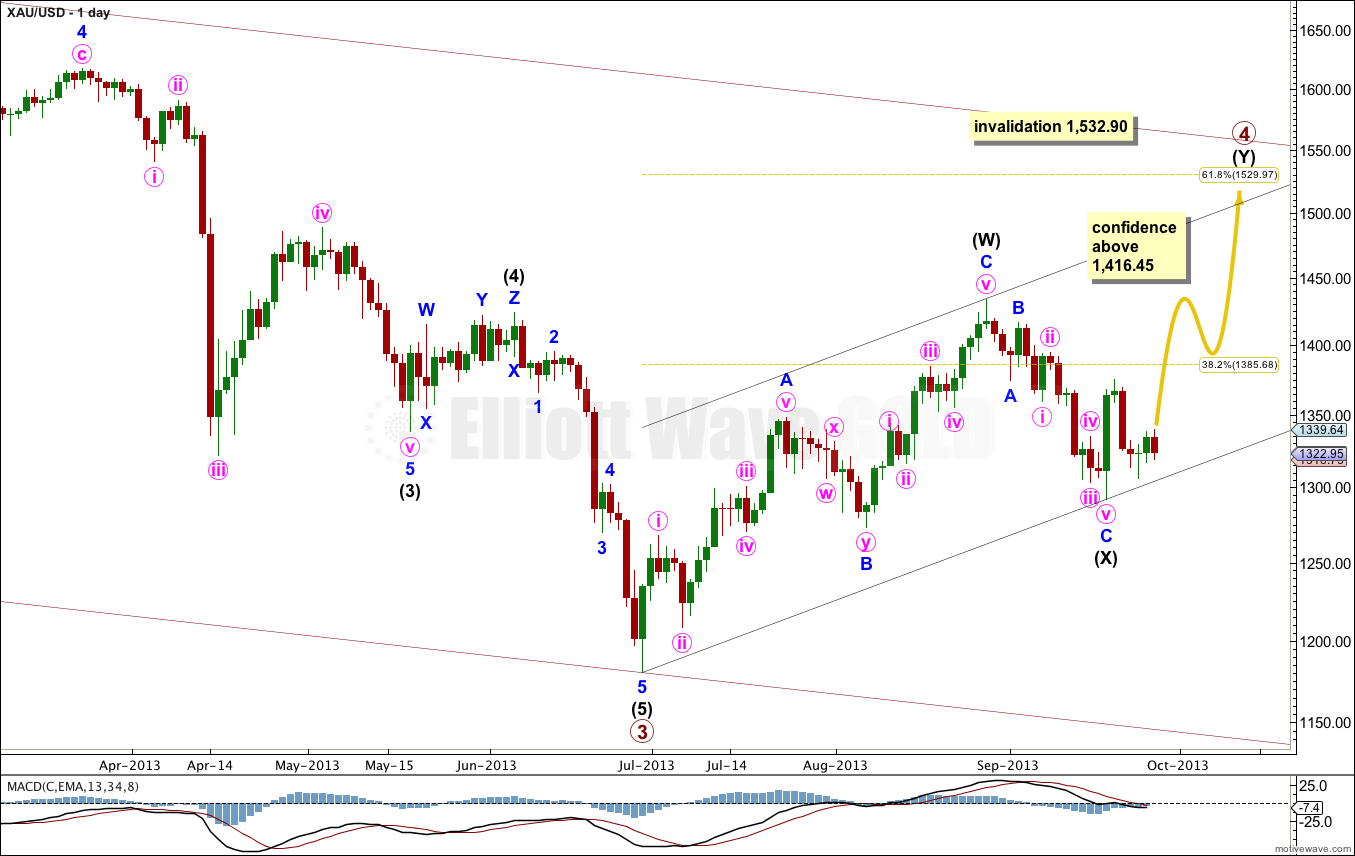
There are still several possible structures for primary wave 4. So far we have a three down from the high at 1,433.83. This three down is less than 90% the length of intermediate wave (W) so it cannot be a B wave within a flat over there. This structure may be a double zigzag or double combination. In a double combination the second structure labeled intermediate wave (Y) may be either a flat or triangle.
It is most likely at this stage that primary wave 4 is continuing as a double zigzag rather than a combination, because combinations commonly have X waves which are deeper than this one is. Intermediate wave (Y) is most likely to be a zigzag.
Primary wave 2 was a deep 68% regular flat correction lasting 54 weeks. Given the guideline of alternation we may expect primary wave 4 to continue for longer than it has so far, possibly for another nine weeks to last a Fibonacci 21 (give or take one week either side of this). If it completed as a double zigzag there would be nice alternation in structure with primary wave 2.
Primary wave 4 has already passed the 0.382 Fibonacci ratio, so it may end about the 0.618 Fibonacci ratio of primary wave 3 at 1,529.97. It should find resistance at the upper edge of the parallel channel drawn here using Elliott’s first technique.
When I know where minor waves A and B within primary wave Y have ended then I can use the ratio between minor waves A and C to calculate a target for upwards movement to end. I cannot do that yet.
Primary wave 4 may not move into primary wave 1 price territory. This wave count is invalidated with movement above 1,532.90.
I have two hourly wave counts for you today. The first main wave count has a higher probability. I will only use the alternate if the main hourly wave count is invalidated.
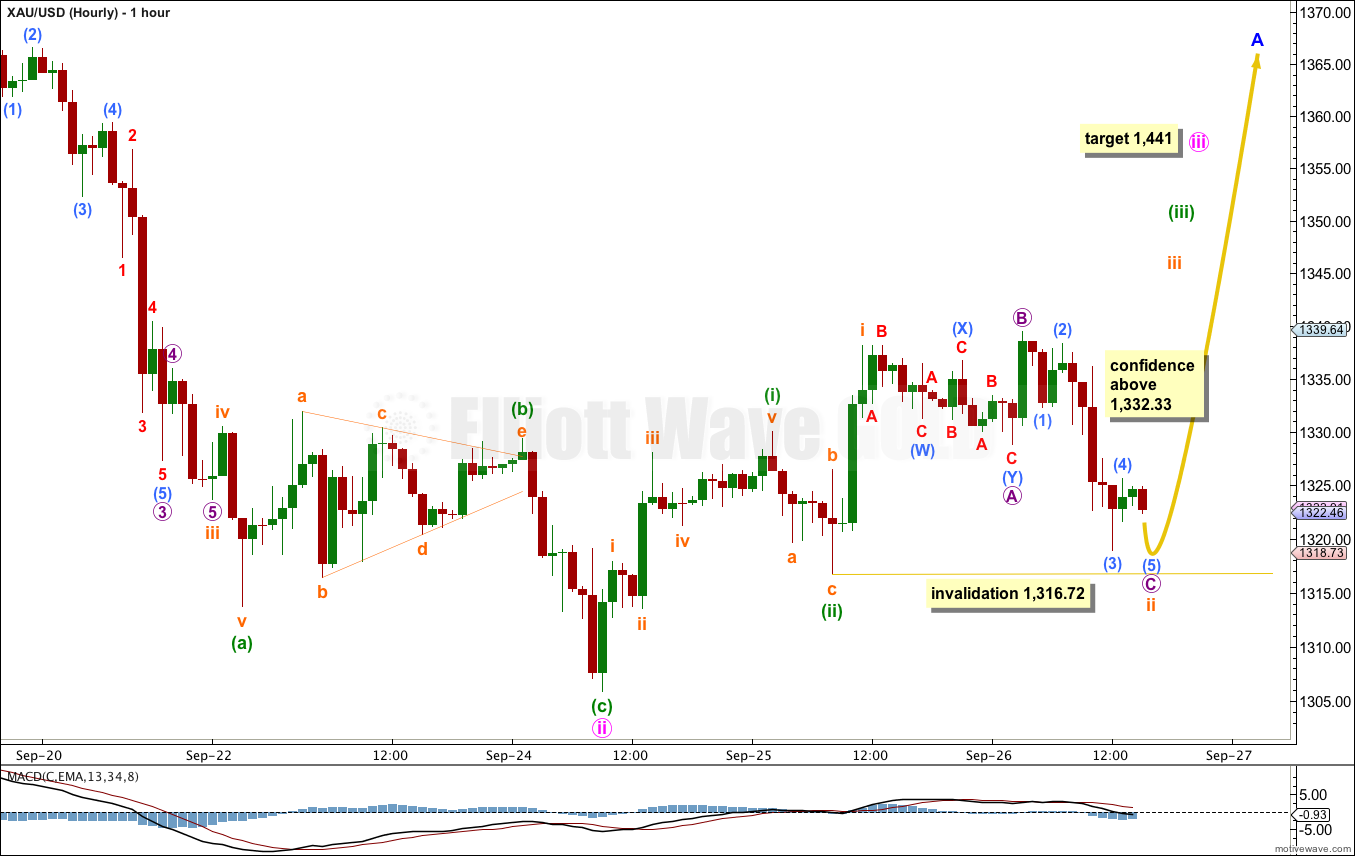
This wave count has a good fit. The only problem with it today is the lack of proportion between subminuette wave ii and minuette wave (ii). Minuette wave (ii) is one degree higher and should be longer lasting. Subminuette wave ii is one degree lower and should be briefer. Subminuette wave ii is three times as long as minuette wave (ii) which gives this wave count an odd look, but does not invalidate it.
Subminuette wave ii is an expanded flat correction which is almost complete. Within it micro wave A was a double zigzag, micro wave B a single zigzag, and micro wave C an almost complete impulse. I would expect micro wave C to end most likely slightly below 1,318.96 to avoid a truncation.
Subminuette wave ii may not move beyond the start of subminuette wave i. This wave count is invalidated with movement below 1,316.72.
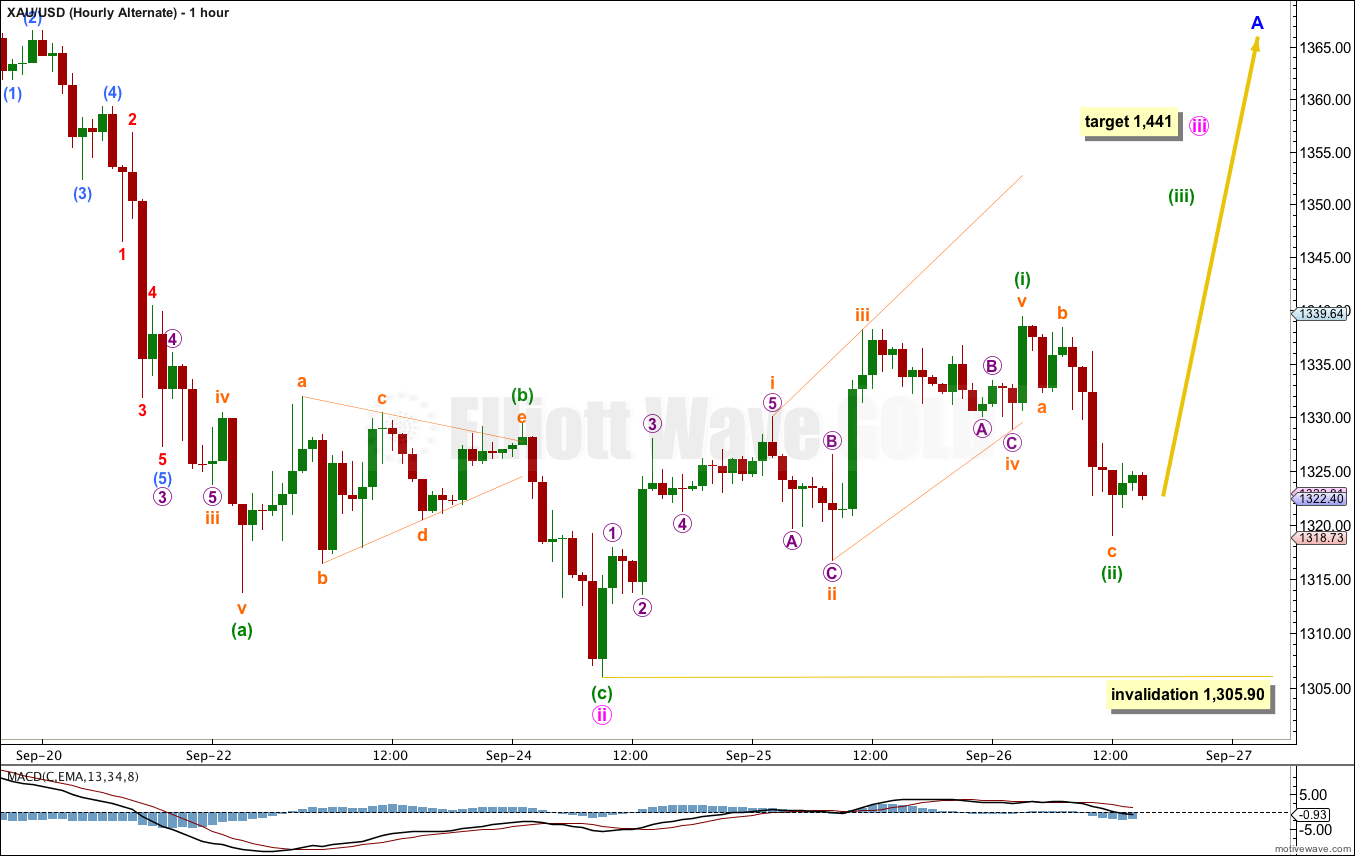
Alternatively, a leading contracting diagonal may have completed for minuette wave (i), followed by a second wave correction which is likely to be complete.
This diagonal fits all the rules, but does not look right. Second and fourth waves within diagonals are most commonly between 0.66 to 0.81 of the first and third waves. This second wave is just 0.55 of the first, and the fourth wave is just 0.46 of the third wave. This must reduce the probability of this structure.
Although the wave lengths are correct for a contracting diagonal, the trend lines diverge. This structure does not fit the typical form for a diagonal.
Minuette wave (ii) is 0.61 of minuette wave (i). Normally second waves following first wave leading diagonals are deep, this one is reasonably deep so this part of the wave count follows typical patterns.
It is entirely possible, and would also be typical for this second wave, for it to continue lower as a double zigzag. Minuette wave (ii) may not move beyond the start of minuette wave (i). This wave count is invalidated with movement below 1,305.90.
Alternate Daily Wave Count.
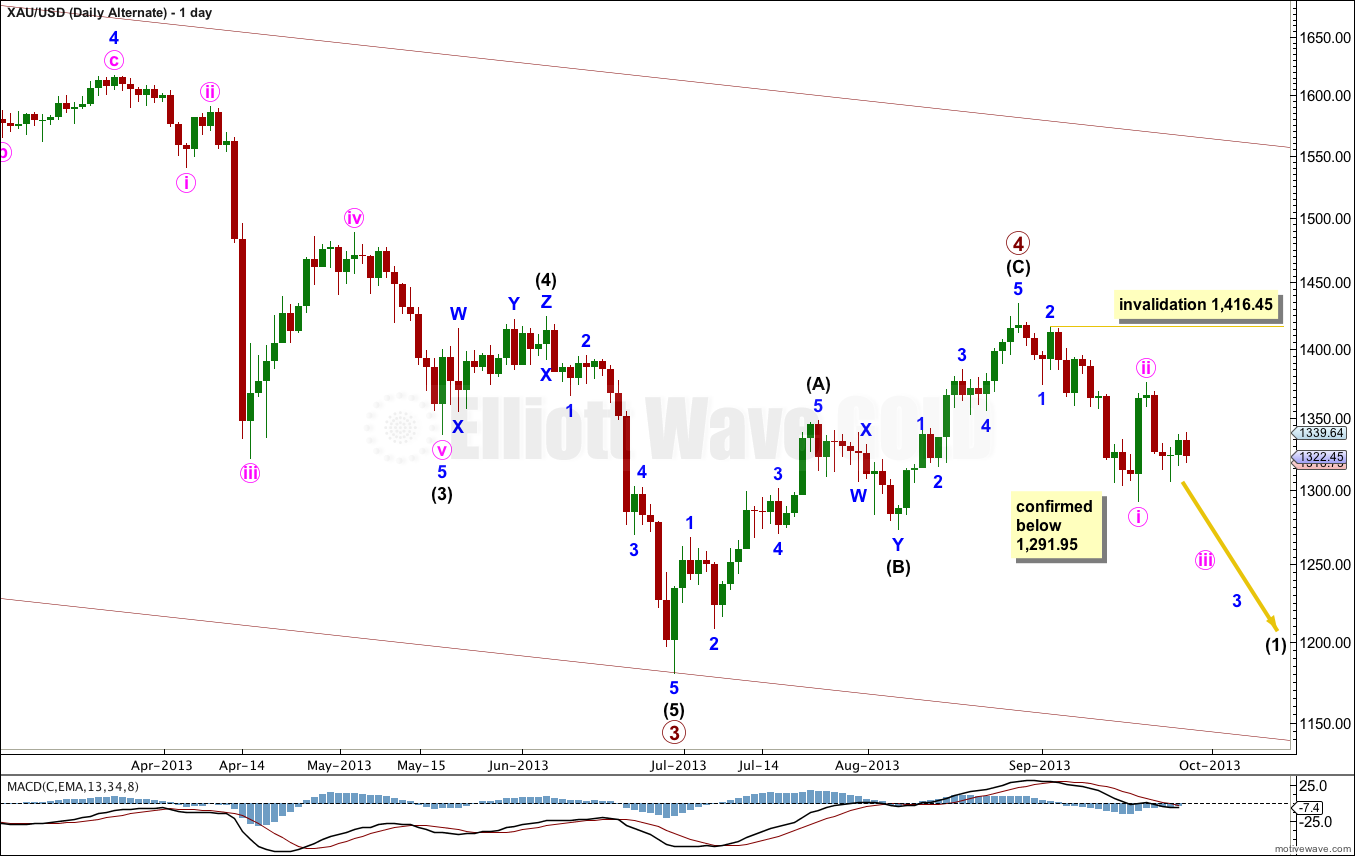
I have tried to see as many alternates as I can. This wave count is possible but it has problems of proportion which make it look odd. I will publish it as a slim outlying possibility. I would only use it if it is confirmed with movement below 1,291.95.
If primary wave 4 is over then it lasted only 9 weeks, compared to primary wave 2 which lasted 53 weeks. This gives the monthly chart the wrong look.
Within recent downwards movement minute wave ii may not move beyond the start of minute wave i. This wave count is invalidated with movement above 1,416.45. If price moves above this point next week I would have more confidence in the main wave count.