
Yesterday’s analysis expected more downwards movement, with a second wave correction along the way. This is pretty much what has happened; price has stepped lower with corrections along the way. The short term target for last analysis was at 1,287. Price has reached down to 1,281.69 so far, but the second wave correction is already over.
Click on the charts below to enlarge.
Main Wave Count.
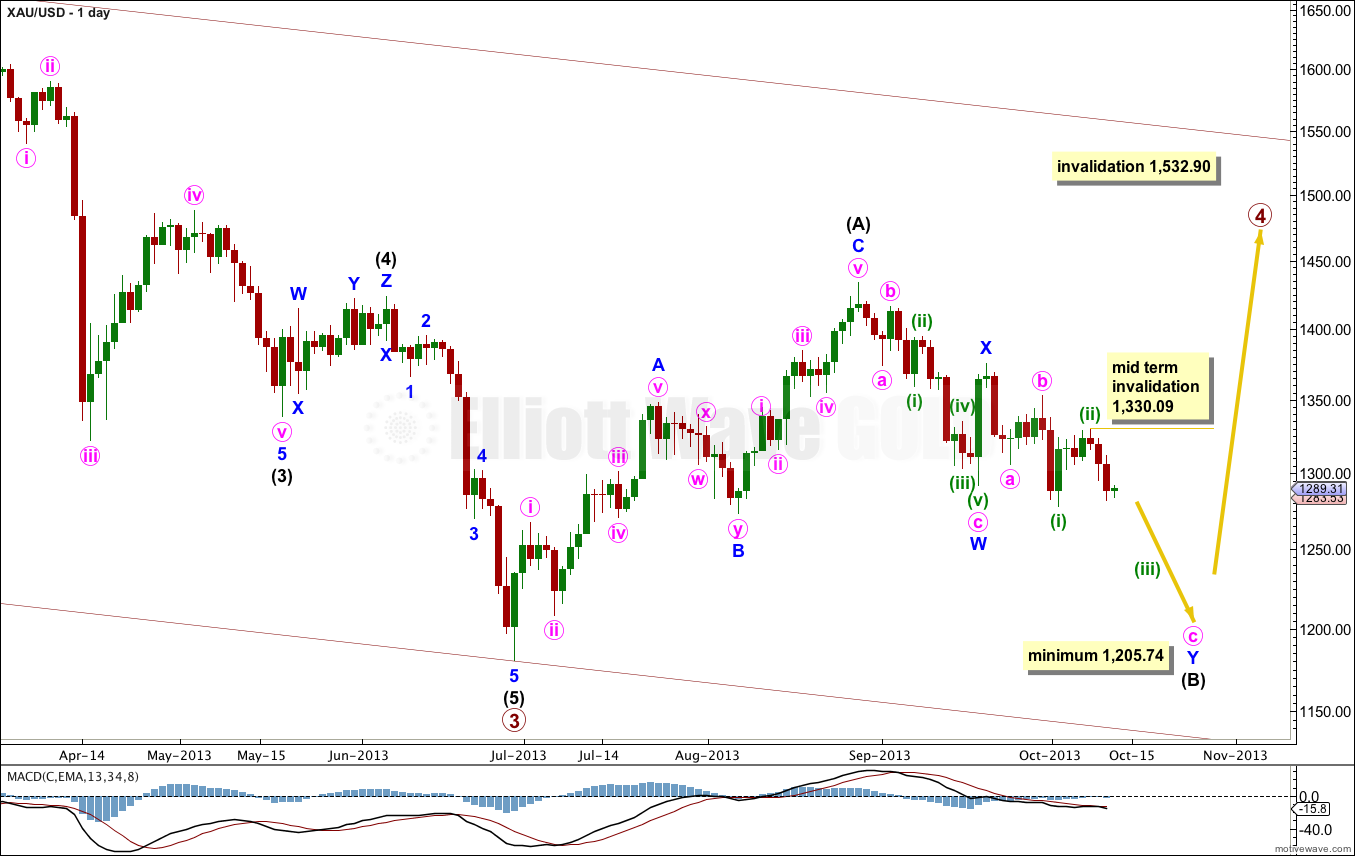
This is the main wave count with the highest probability. Flat corrections are extremely common structures, particularly in fourth waves. Primary wave 2 was a rare running flat, and primary wave 4 may exhibit alternation if it is a more common expanded flat or a still common regular flat. Primary wave 4 may also exhibit alternation if it is shallow; primary wave 2 was very deep.
Primary wave 2 lasted 53 weeks. It would be likely that primary wave 4 will continue for longer to be better in proportion to primary wave 2.
It is most likely that primary wave 4 is not over and is unfolding as a large flat correction. Within the flat intermediate wave (B) is an incomplete double zigzag. Within the second zigzag of this double, labeled minute wave y, minuette wave (ii) may not move beyond the start of minuette wave (i). This wave count is invalidated at this stage and for some time yet with movement above 1,532.90.
Within the flat correction intermediate wave (B) must be at least 90% the length of intermediate wave (A). This wave count requires more downwards movement to this minimum at 1,205.74.
Within an expanded flat the B wave is 105% the length of the A wave, so this wave count allows for a new low as quite likely, because expanded flats are the most common type of flat.
Intermediate wave (B) would be about three or so weeks away from ending.
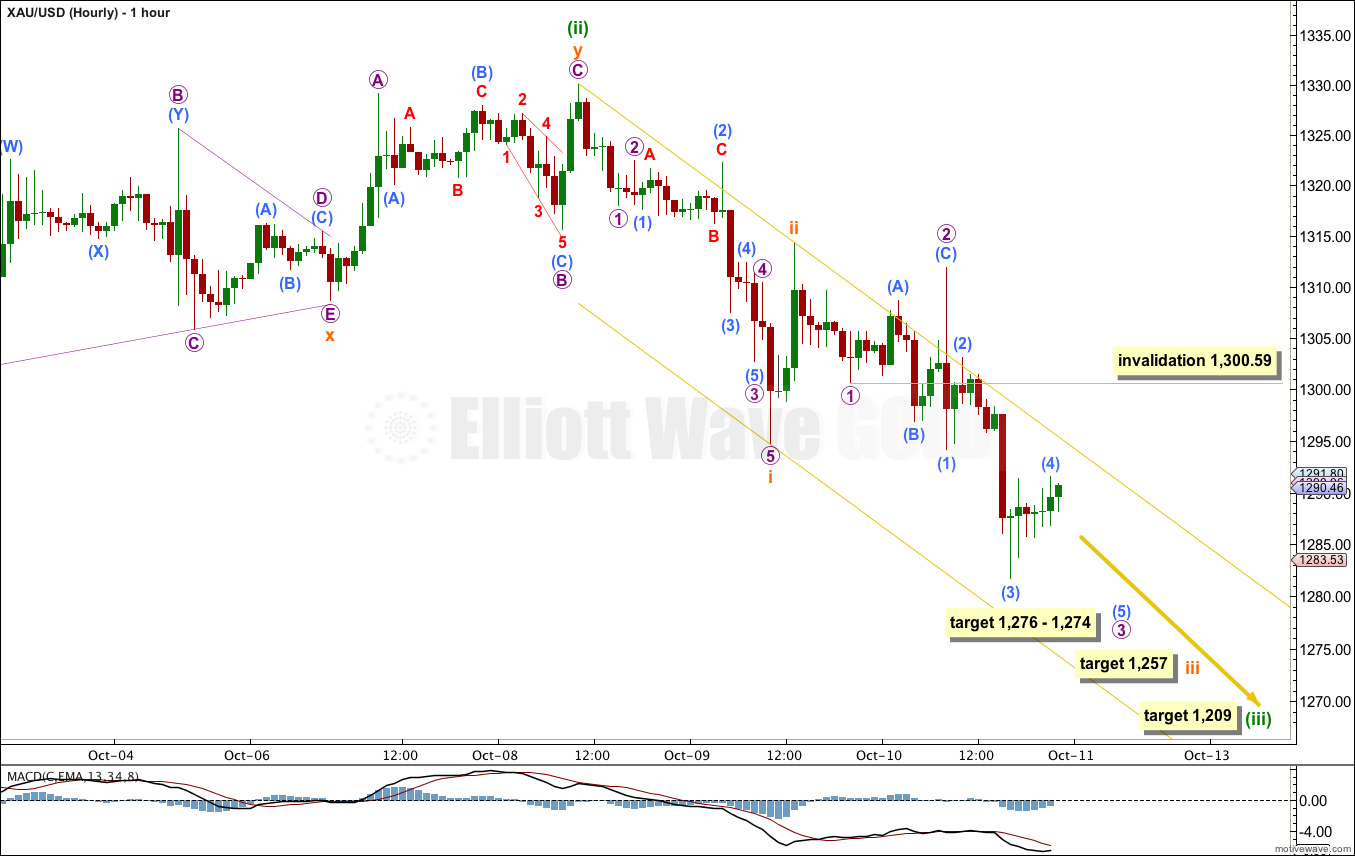
Subminuette wave i is already complete, as is subminuette wave ii. Subminuette wave iii is underway, and may possibly have passed the middle. If momentum increases further I would expect that the middle of subminuette wave iii may not be over and may be extending further.
Within micro wave 3 there is no Fibonacci ratio between submicro waves (3) and (1). This makes it more likely we shall see a Fibonacci ratio between micro wave (5) and either of (1) or (3).
At 1,274 submicro wave (5) within micro wave 3 would reach equality in length with submicro wave (1). At 1,276 micro wave 3 would reach 2.618 the length of micro wave 1. I would expect this target to be reached within 24 hours, before next analysis.
When micro wave 3 is complete then micro wave 4 should move price higher. It is likely to be shallow, because micro wave 2 was very deep. Micro wave 4 may not move into micro wave 1 price territory. This wave count is invalidated with movement above 1,300.59.
At 1,257 subminuette wave iii would reach 1.618 the length of subminuette wave i. This target may be about two to four days away.
At 1,209 minuette wave (iii) would reach 1.618 the length of minuette wave (i). This target may be at least a week away.
Alternate Wave Count.
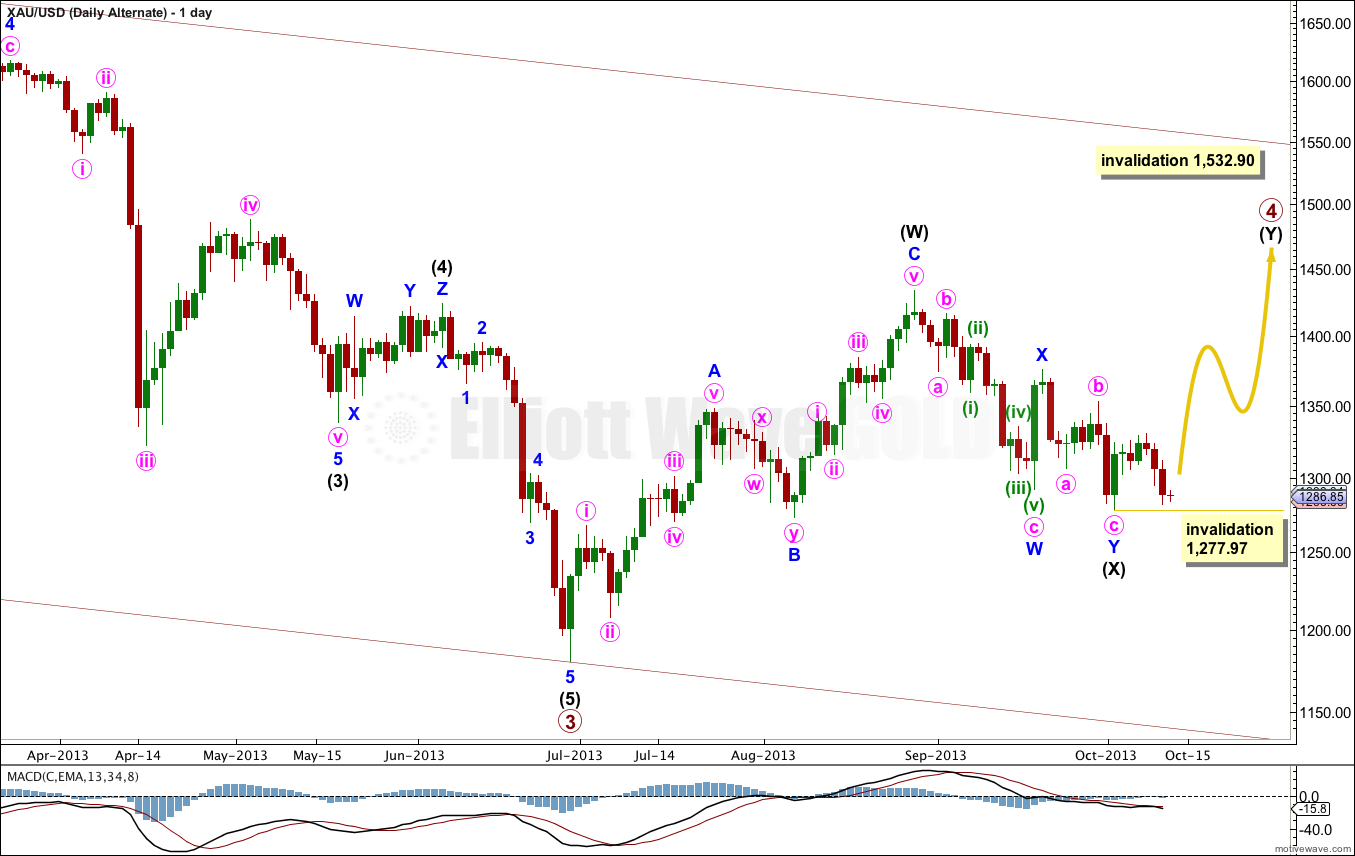
While flat corrections are extremely common structures, multiples are only slightly less common. For this reason this alternate has a lower probability than the main wave count.
This alternate would see better alternation with primary wave 2 which was a running flat; primary wave 4 as a double zigzag would provide perfect alternation in structure.
Within multiples X waves are usually single zigzags, or less likely single flats or triangles. It is unusual for an X wave to be a multiple itself, and this one is a double zigzag. This reduces the probability of this alternate wave count.
Within multiples subwaves W, Y (and if there is one subwave Z) can only subdivide into simple corrective structures, they cannot themselves be multiples. But X waves can, and rarely, do.
Within intermediate wave (Y) no second wave may move beyond the start of the first wave. This wave count is invalidated with movement below 1,277.97.
Alternate Wave Count II.

This wave count has the lowest probability because it would see primary wave 4 as having lasted only 9 weeks. Compared to primary wave 2 having lasted 53 weeks, this lack of proportion gives this alternate wave count the wrong look at the weekly chart level. This significantly reduces the probability of this wave count.
This alternate expects very strong downwards movement as the middle of a third wave unfolds. If the next wave down shows a very strong increase in momentum then I would more seriously consider this alternate.
At 1,174 minor wave 3 would reach 1.618 the length of minor wave 1.
Subminuette wave ii may not move beyond the start of subminuette wave i. This wave count is invalidated with movement above 1,352.90.