
Last analysis expected more upwards movement for a correction. Price has made a new high in choppy, overlapping sideways movement, which is typically corrective.
The wave count remains the same.
Click on the charts below to enlarge.
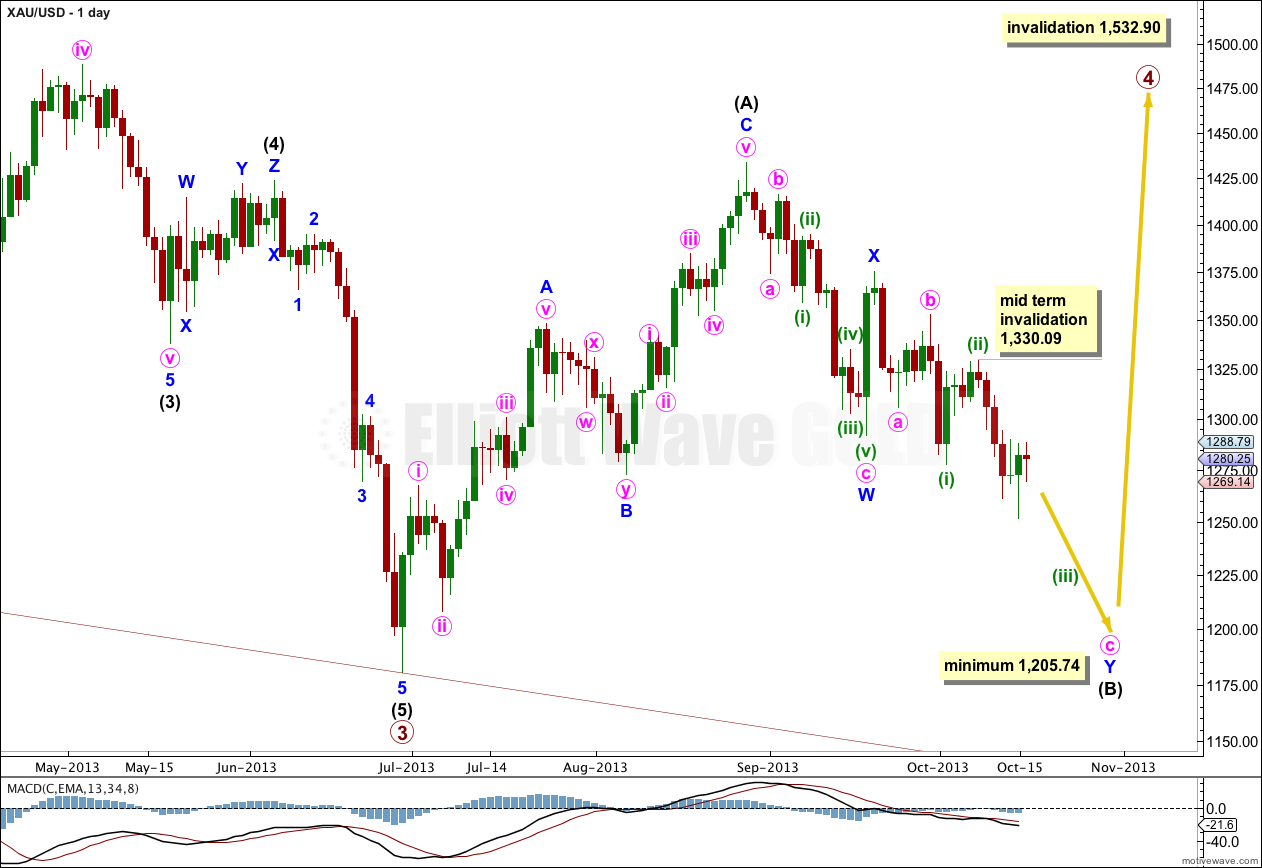
This is the main wave count with the highest probability. Flat corrections are extremely common structures, particularly in fourth waves. Primary wave 2 was a rare running flat, and primary wave 4 may exhibit alternation if it is a more common expanded flat or a still common regular flat. Primary wave 4 may also exhibit alternation if it is shallow; primary wave 2 was very deep.
Primary wave 2 lasted 53 weeks. It would be likely that primary wave 4 will continue for longer to be better in proportion to primary wave 2.
It is most likely that primary wave 4 is not over and is unfolding as a large flat correction. Within the flat intermediate wave (B) is an incomplete double zigzag. Within the second zigzag of this double, labeled minute wave y, minuette wave (ii) may not move beyond the start of minuette wave (i). This wave count is invalidated at this stage and for some time yet with movement above 1,532.90.
Within the flat correction intermediate wave (B) must be at least 90% the length of intermediate wave (A). This wave count requires more downwards movement to this minimum at 1,205.74.
Within an expanded flat the B wave is 105% the length of the A wave, so this wave count allows for a new low as quite likely, because expanded flats are the most common type of flat.
Intermediate wave (B) would be about three or so weeks away from ending.
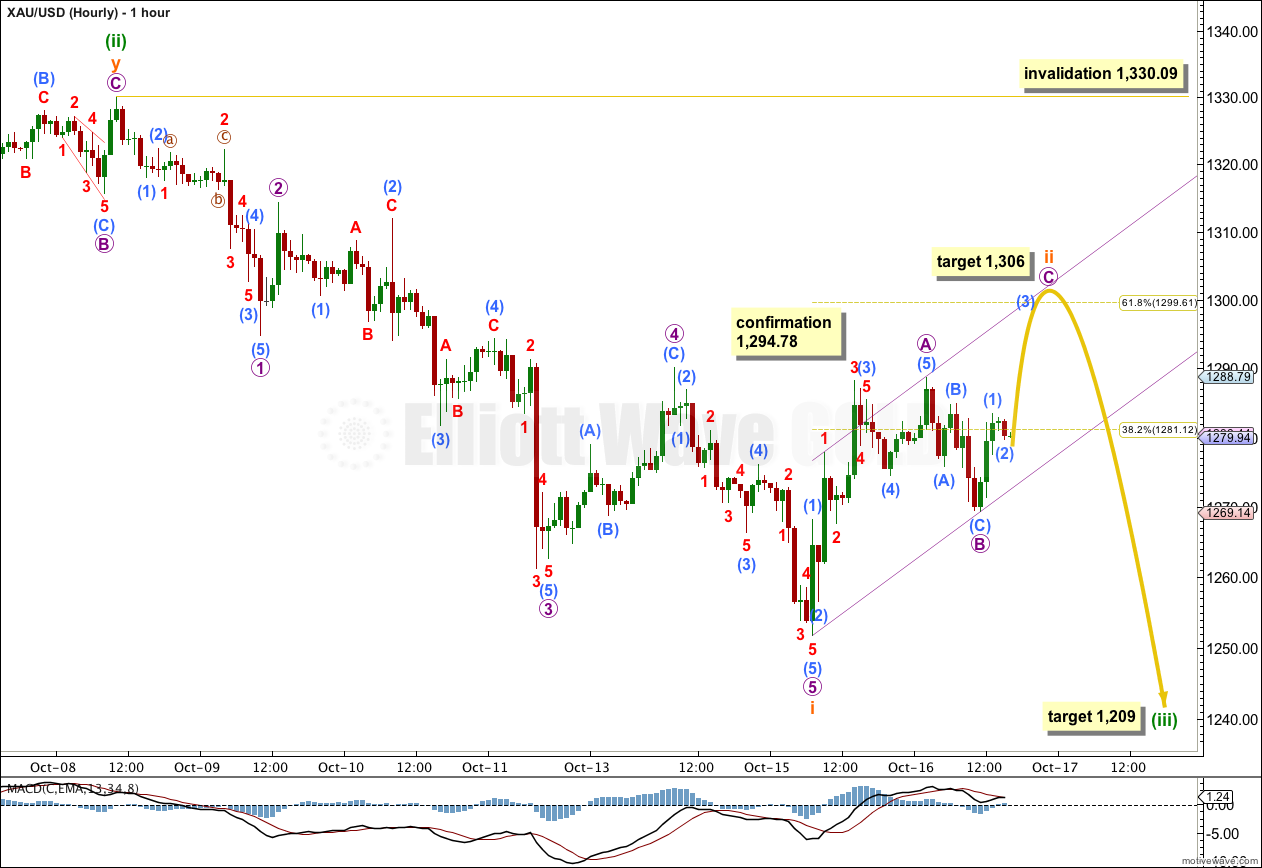
Subminuette wave ii may be unfolding as a single zigzag. If it is, then within it micro wave B should not move beyond the start of micro wave A at 1,251.76.
If micro wave B is over then micro wave C would reach equality with micro wave A at 1,306. This is the most common ratio between A and C waves, so it would be the most likely target.
Draw a channel about subminuette wave ii using Elliott’s technique for a correction. Draw the first trend line from the start of micro wave A to the end of micro wave B, then place a parallel copy upon the end of micro wave A. I would expect micro wave C to find resistance at the upper edge of this channel. When this channel is breached by subsequent downwards movement I would have some confidence that subminuette wave ii should be over and the next wave should have begun.
Subminuette wave ii may not move beyond the start of the first wave. This wave count is invalidated with movement above 1,330.09.
Alternate Daily Wave Count.
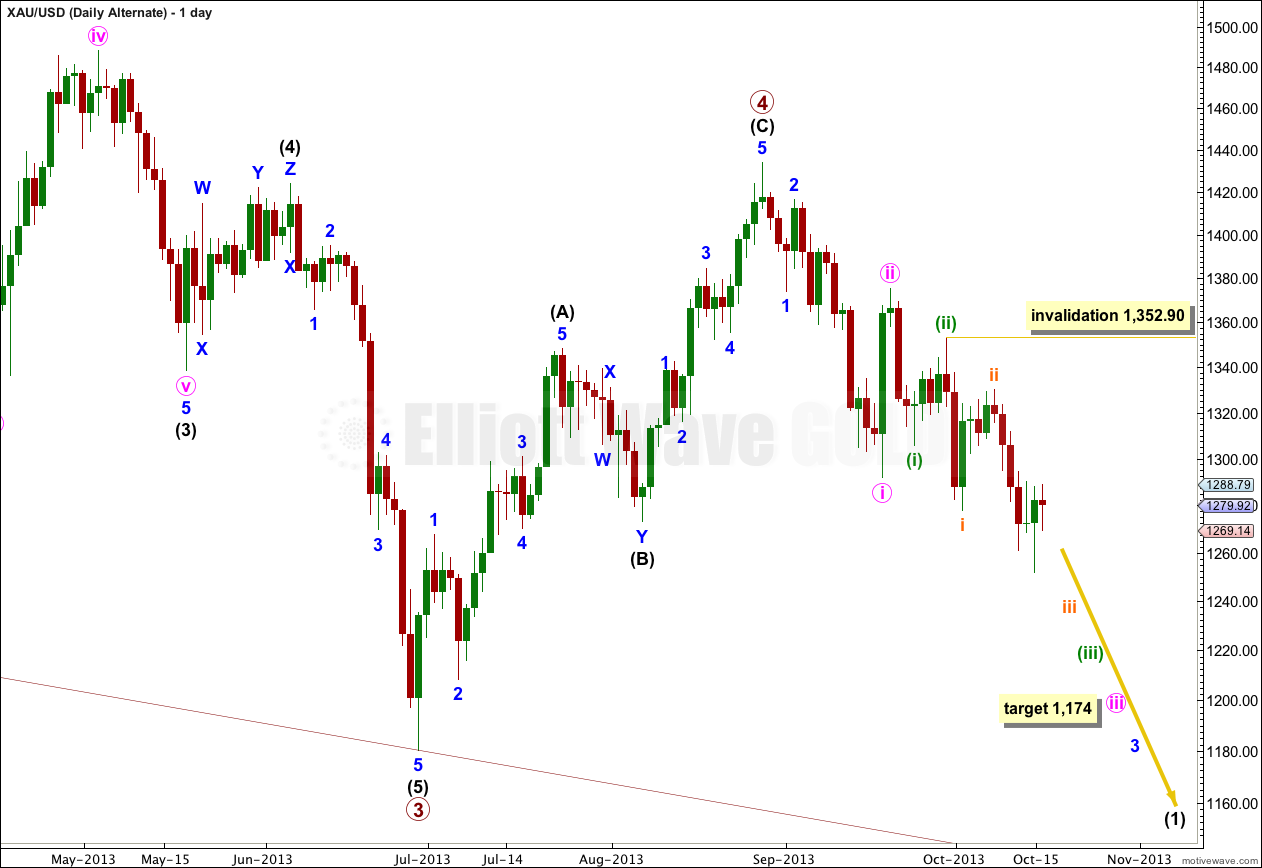
This wave count has the lowest probability because it would see primary wave 4 as having lasted only 9 weeks. Compared to primary wave 2 having lasted 53 weeks, this lack of proportion gives this alternate wave count the wrong look at the weekly chart level. This significantly reduces the probability of this wave count.
This alternate expects very strong downwards movement as the middle of a third wave unfolds. If the next wave down shows a very strong increase in momentum then I would more seriously consider this alternate.
At 1,174 minor wave 3 would reach 1.618 the length of minor wave 1.
Subminuette wave ii may not move beyond the start of subminuette wave i. This wave count is invalidated with movement above 1,352.90.