
Last analysis expected upwards momentum to increase. We have seen exactly the opposite of that expectation. Movement below 1,291.84 invalidated the main wave count and confirmed the alternate.
In addition to the alternate I have a new wave count for you today, which has a higher probability. Today (and for the immediate future) both the alternate and the new wave count expect the same direction next; there is no divergence between them.
A good understanding of probability, and how to use alternates, will assist with understanding my Elliott wave analysis: We should always expect the highest probability outcome possible. This means that when a lower probability outcome occurs it is not what we expected, but it is possible. This is the nature of probability, and this is the core of what I am doing with Elliott wave analysis. If I present the highest probability outcome and I expect it to happen, then I should be able to be right more often than not.
Click on the charts below to enlarge.
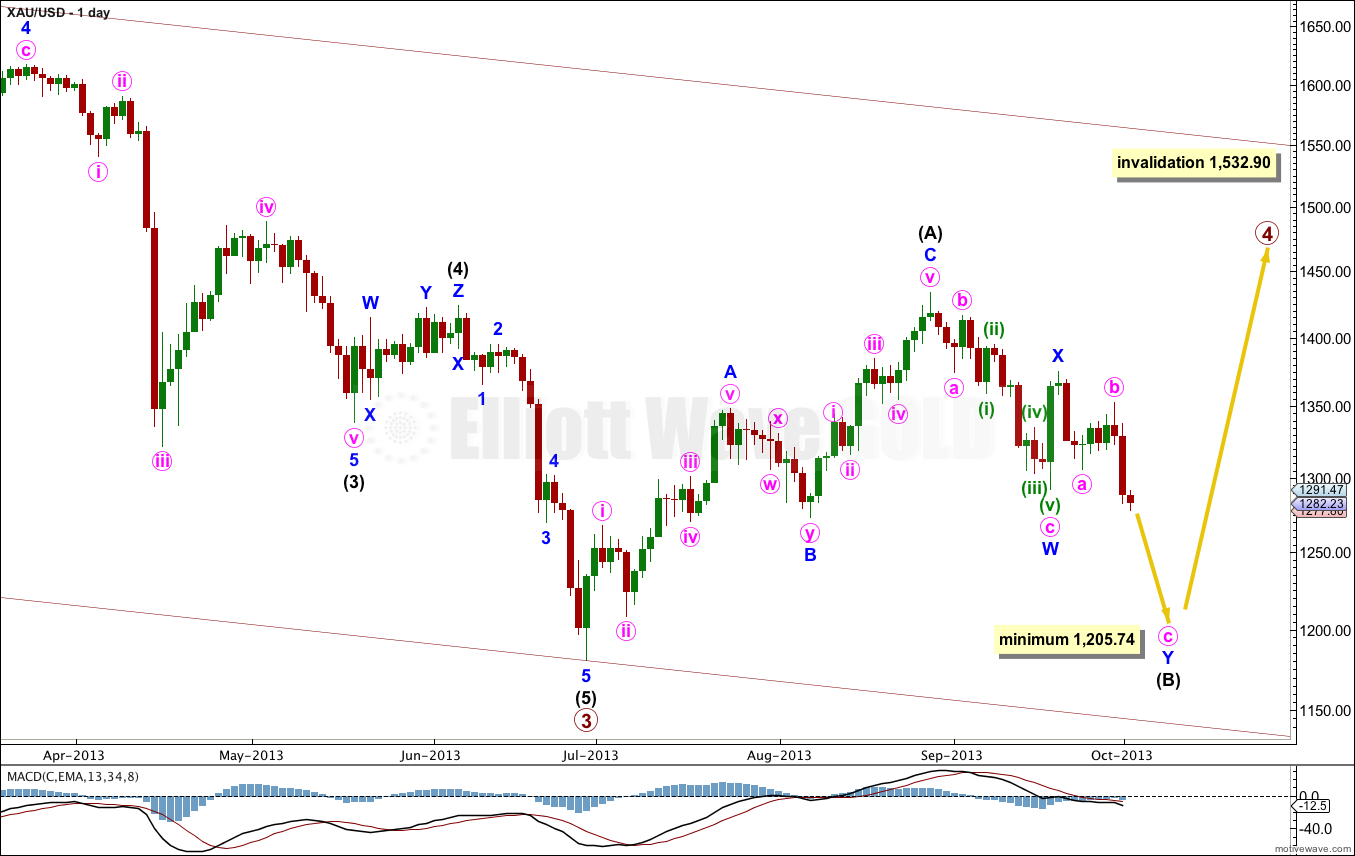
It is possible that primary wave 4 is not over and is unfolding as a large flat correction.
Within a flat correction intermediate wave (B) must be at least 90% the length of intermediate wave (A). This wave count requires more downwards movement to this minimum at 1,205.74.
Within an expanded flat the B wave is 105% the length of the A wave, so this wave count allows for a new low as quite likely, because expanded flats are the most common type of flat.
Intermediate wave (B) would be about three or so weeks away from ending.
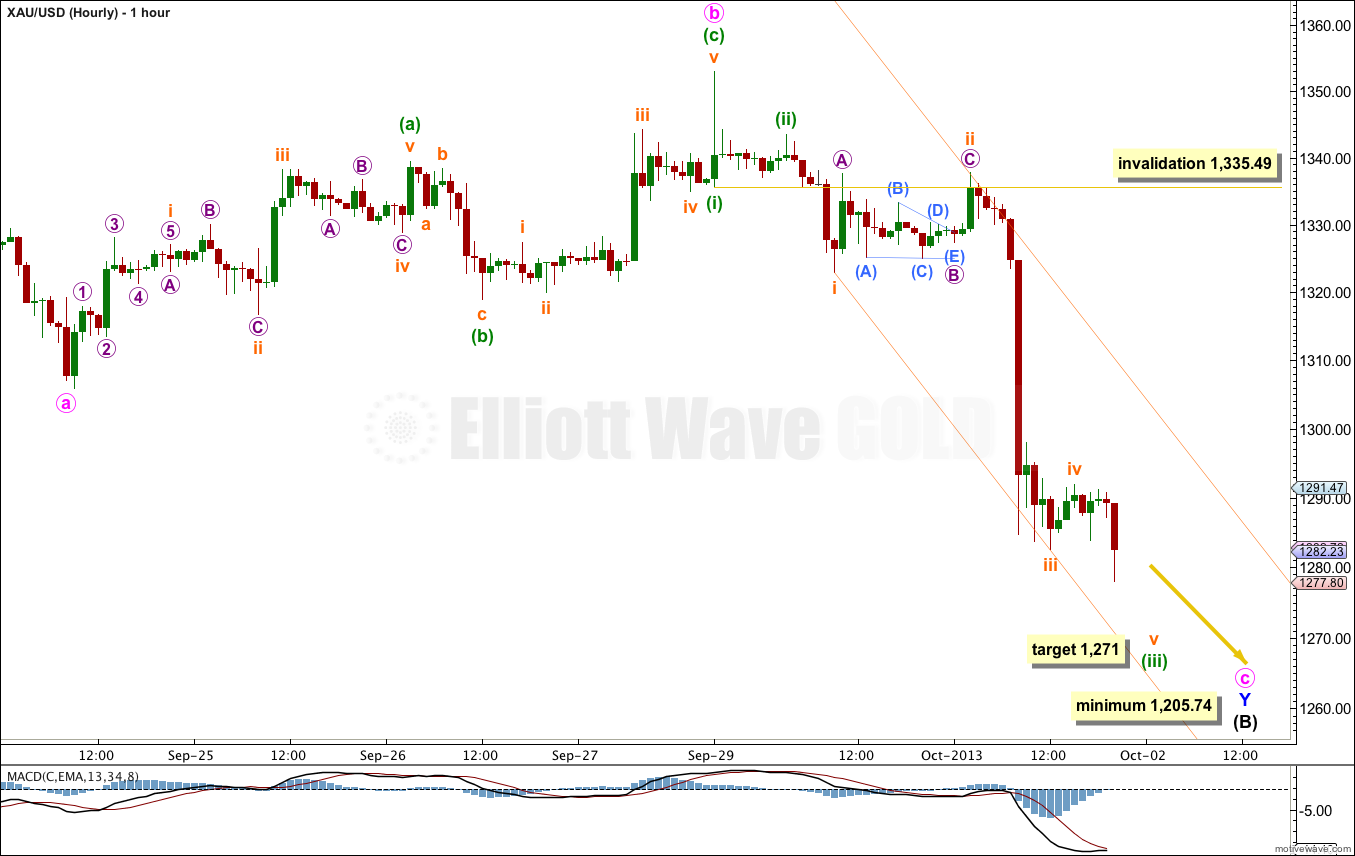
Downwards movement for Tuesday’s session shows a strong increase in momentum, this was a third wave.
Within minute wave b minuette wave c is just 2.37 longer than equality with minuette wave a.
Within minute wave c the first wave, minuette wave (i), is very short. There may not be a Fibonacci ratio between minuette waves (i) and (iii).
Within minuette wave (iii) subminuette wave iii is 1.13 longer than 2.618 the length of subminuette wave i. There may not be a Fibonacci ratio between subminuette wave v and either of iii or i.
At 1,271 subminuette wave v would reach equality in length with subminuette wave i. This is a short term target.
Draw a parallel channel about minuette wave (iii) using Elliott’s first technique. Draw the first trend line from the lows of subminuette waves i to iii, then place a parallel copy upon the high of subminuette wave ii. I would expect subminuette wave iv to find resistance at the upper edge of this channel, and the following subminuette wave v downwards to end either midway within the channel, or to find support at the lower edge.
When minuette wave (iii) is completed redraw the downwards channel using the same technique, but from minuette wave ends.
Within minute wave c minuette wave (iv) may not move into minuette wave (i) price territory. This wave count is invalidated with movement above 1,335.49.
Alternate Daily Wave Count.
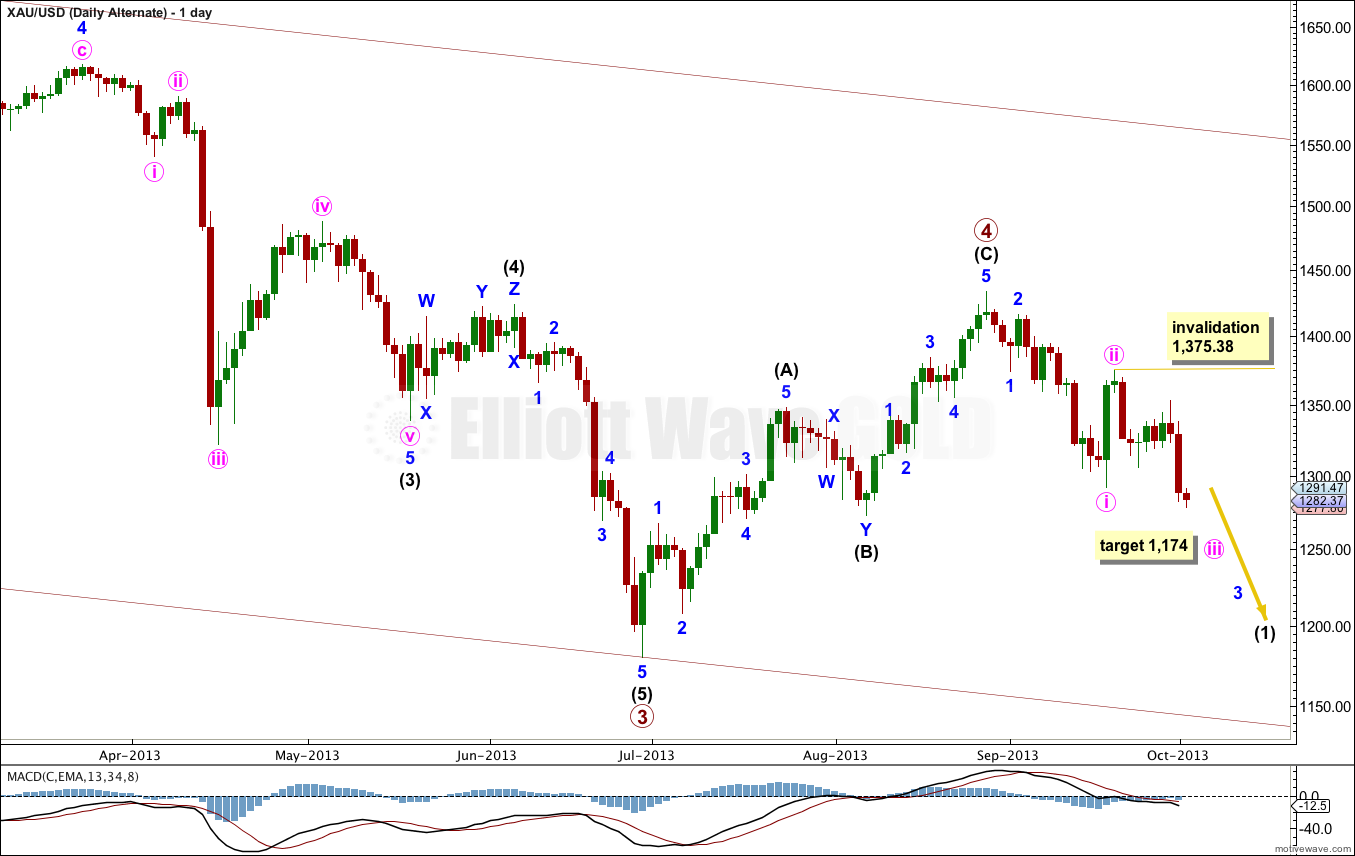
This wave count has problems of proportion which make it look odd. However, with movement below 1,291.95 it has increased in probability.
If primary wave 4 is over then it lasted only 9 weeks, compared to primary wave 2 which lasted 53 weeks. This gives the monthly chart the wrong look. However, primary wave 2 was a double combination and primary wave 4 a single zigzag. These corrective structures do have different durations; the purpose of combinations is to take up time and move price sideways. This wave count is technically possible, but it does not have a good probability.
At 1,174 minute wave iii would reach 1.618 the length of minute wave i.
Within minute wave iii no second wave correction may move beyond the start. This wave count is invalidated with movement above 1,375.38.