
Yesterday’s analysis expected downwards movement for a correction. This is not what happened as price has moved higher.
The correction is still valid if it is a flat.
I have three hourly wave counts (one main and two alternates) for you after considering as many possibilities as I can see. I have provided confirmation and invalidation points to work with these three wave counts today.
Click on the charts below to enlarge.
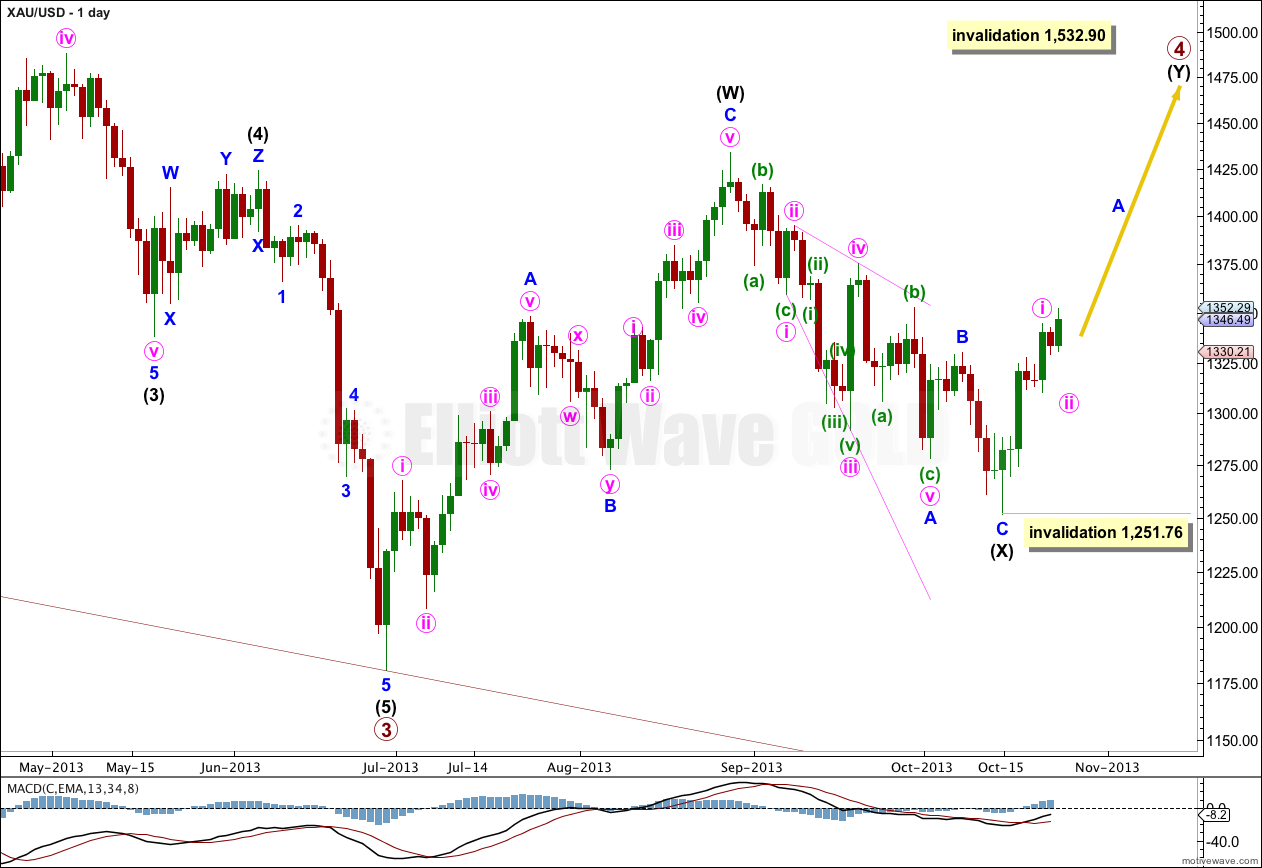
Gold has completed its downwards wave and is in the early stages of the next wave up which should last at least a month.
The structure for primary wave 4 cannot be a flat correction, because what would be the B wave is well less than 90% of what would be the A wave. That is why I have labeled it as a double.
Because intermediate wave (X) is quite shallow I would expect primary wave 4 is most likely a double zigzag rather than a double combination. Double combinations move price sideways and their X waves are usually deeper than this one is. Double zigzags trend against the main direction, and their purpose is to deepen a correction when the first zigzag did not take price deep enough. So I will be expecting intermediate wave (Y) to subdivide as a zigzag and to take price comfortably above 1,433.83. It should last about 35 to 45 days or sessions in total.
Within intermediate wave (Y) no second wave correction may move beyond the start of the first wave. This wave count is invalidated with movement below 1,251.76.
Main Hourly Wave Count.
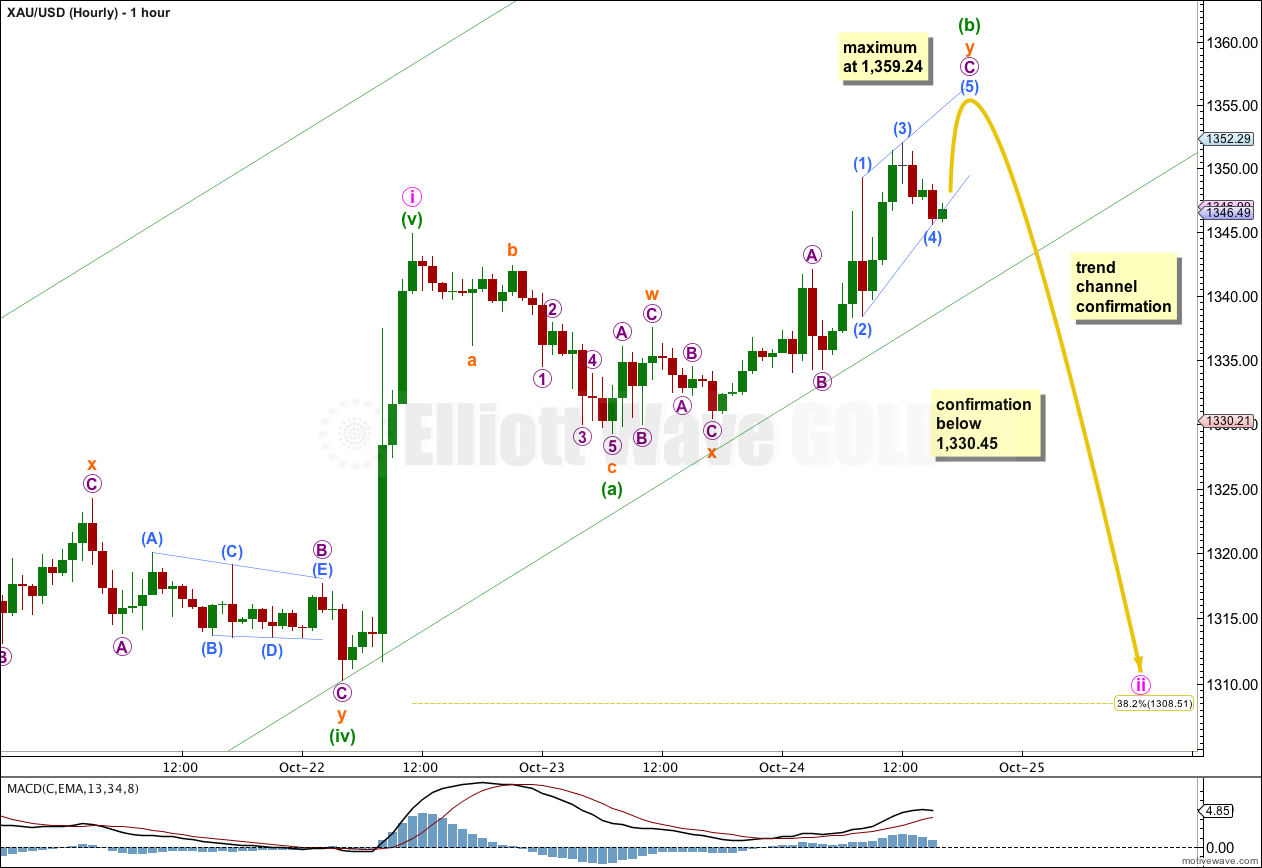
It is most likely that minute wave ii is not over and is unfolding as an expanded flat correction. Expanded flats are very common structures.
Within the expanded flat minuette wave (b) would normally be between 100% to 138% the length of minuette wave (a). So far minuette wave (b) is 146% the length of minuette wave (a). This is entirely possible, but it does reduce the probability of this wave count slightly.
Within the expanded flat the structure of minuette wave (b) is the most difficult part to analyse. It does not fit as a single zigzag. It may be a reasonably common double zigzag, and within the second zigzag of subminuette wave y the C wave may be completing as an ending contracting diagonal.
I have checked the subdivisions of this structure carefully on the five minute chart. All the sub waves do subdivide into zigzags, and the wave lengths are correct: submicro wave (3) is shorter than submicro wave (1) and submicro wave (4) is shorter than submicro wave (2). Submicro wave (5) cannot be longer than equality with submicro wave (3), because a third wave may never be the shortest wave. This gives a maximum point for upwards movement at 1,359.24.
This main wave count expects a little more upwards movement, not above 1,359.24. Price should find resistance and end at the upper end of the light blue channel containing this ending contracting diagonal.
Movement below the parallel channel containing minute wave i would provide trend channel confirmation that the first wave is over and a second wave correction would be underway. Movement below 1,330.45 would invalidate the second alternate wave count and confirm this main wave count.
If price moves above 1,359.24 then this main hourly wave count and the first alternate below would be invalidated. At that stage I would favour the second alternate hourly wave count.
First Alternate Hourly Wave Count.
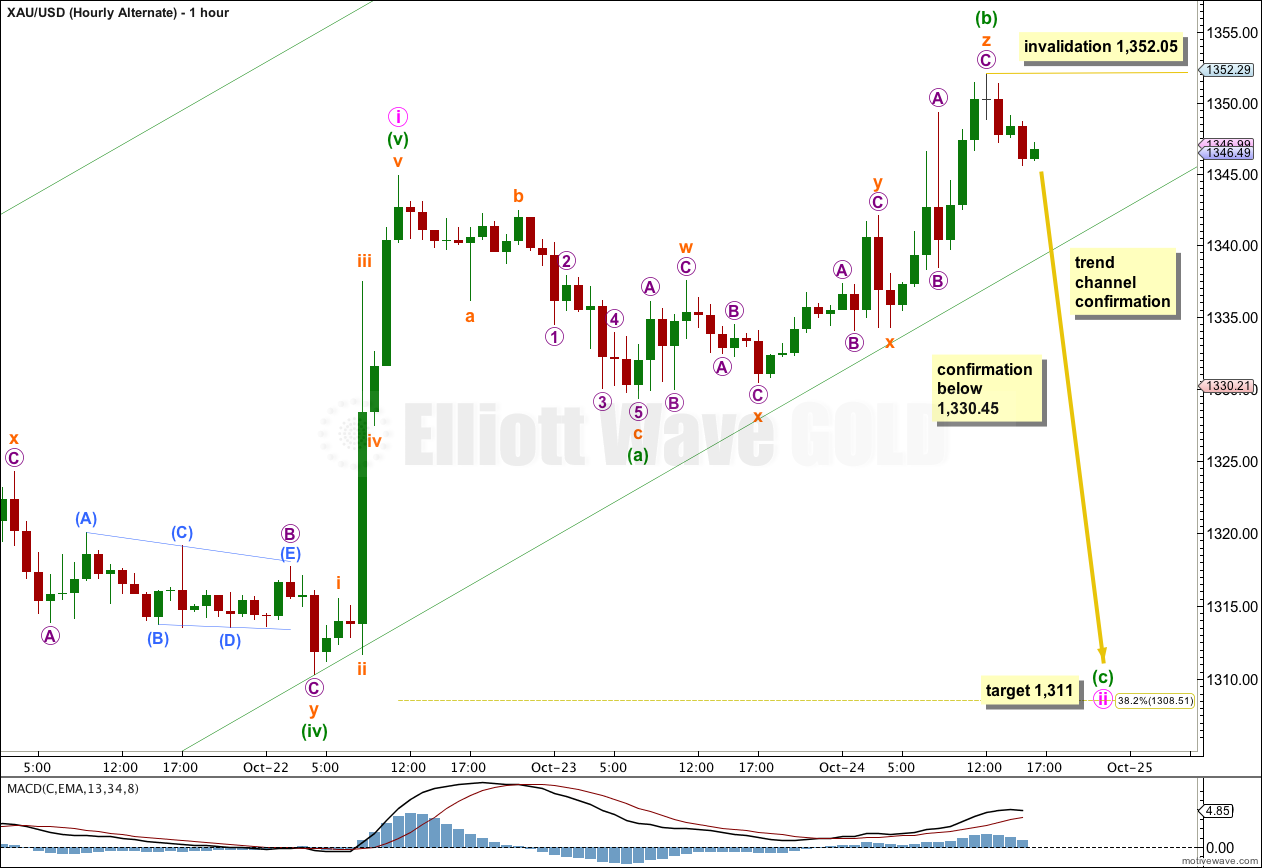
The only difference between this first alternate wave count and the main wave count above is the structure within minuette wave (b) of the expanded flat for minute wave ii.
This first alternate looks at the possibility that minuette wave (b) is over as a triple zigzag. The subdivisions fit, but not as nicely as the main hourly wave count.
Triple zigzags are very rare structures. This must reduce the probability of this first alternate wave count significantly.
If price continues downwards from here and breaches the parallel channel containing minute wave i then this would be my preferred wave count.
At 1,311 minuette wave (c) would reach 2.618 the length of minuette wave (a).
Any movement above 1,352.05 would invalidate this wave count. Within minuette wave (c) no second wave correction may move beyond the start of its first wave.
Second Alternate Hourly Wave Count.
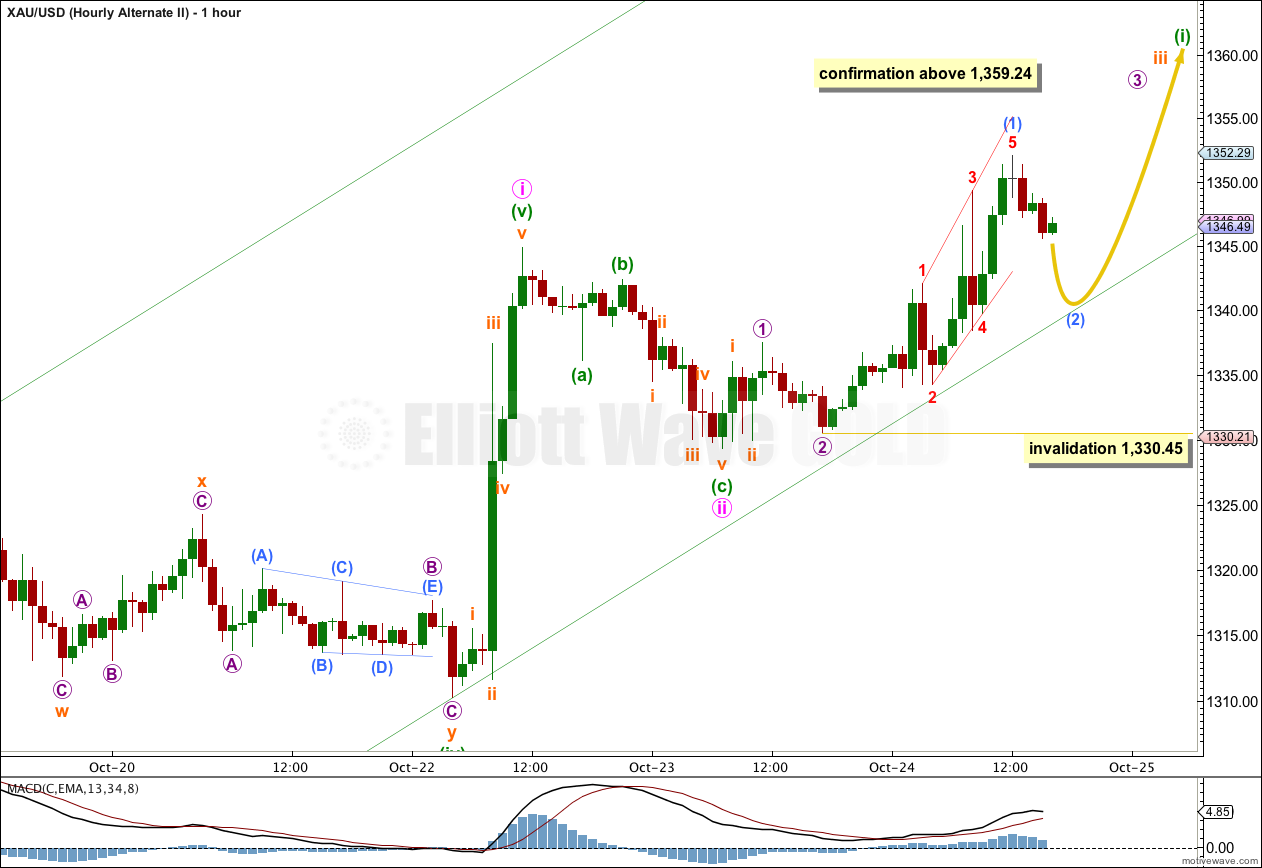
It is possible that minute wave ii was over as a very brief shallow zigzag. However, there are a couple of big problems with this idea.
Minute wave ii for this wave count is only a 17% correction of minute wave i. This is remarkably shallow for a second wave. This reduces the probability of this wave count significantly.
Minute wave ii, if it is over, did not breach the parallel channel containing minute wave i. Normally second waves breach those channels.
If price moves a little lower for submicro wave (2), and fails to break through the lower edge of the parallel channel containing minute wave i, then this wave count may be correct. If price shoots up very strongly and we see a strong increase in upwards momentum over the next 24 hours, then this wave count may be correct.
Movement above 1,359.24 would invalidate the main wave count and confirm this alternate.