
Last analysis expected downwards movement. This is not what happened, and movement above 1,325.66 invalidated the hourly wave count.
Click on the charts below to enlarge.
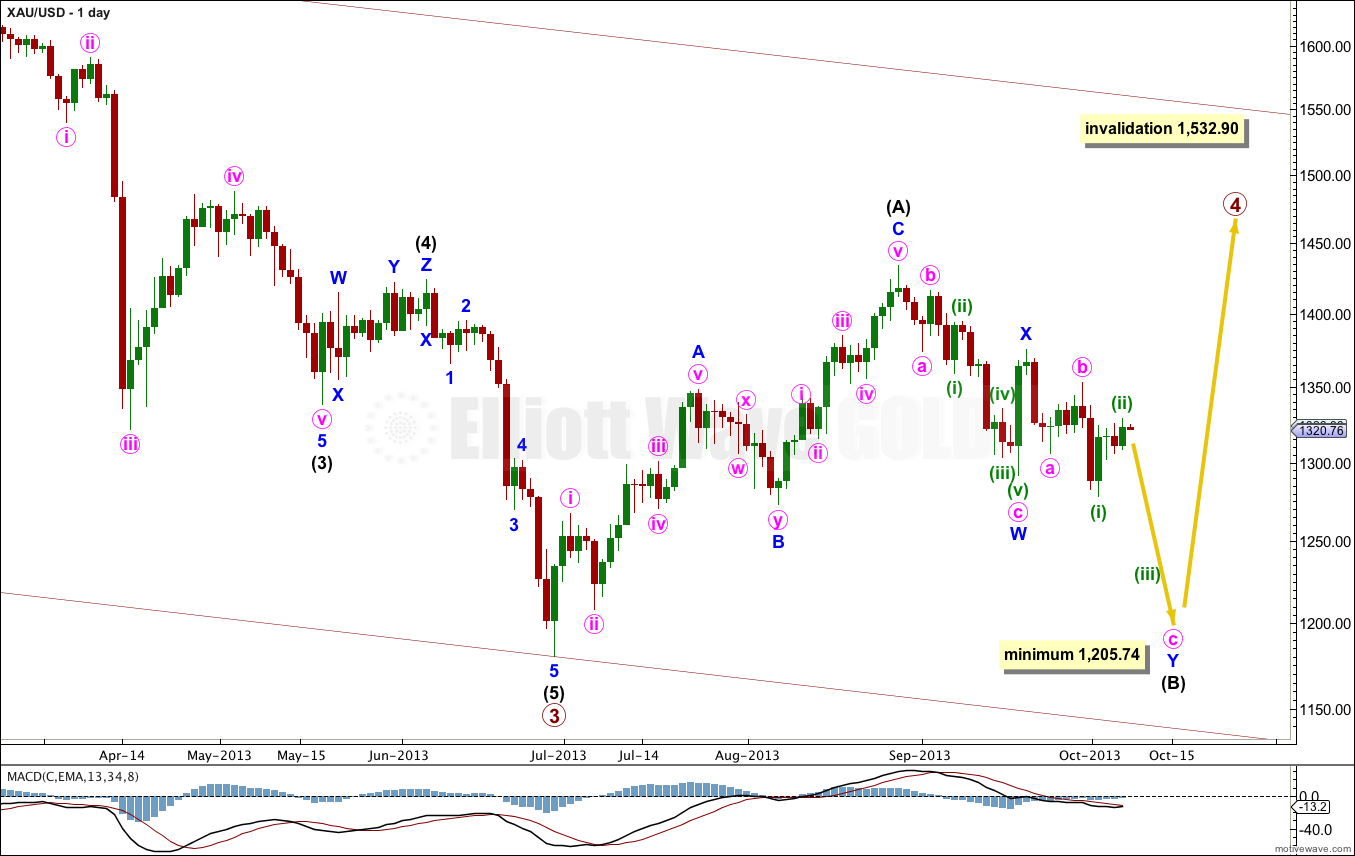
It is most likely that primary wave 4 is not over and is unfolding as a large flat correction.
Within the flat correction intermediate wave (B) must be at least 90% the length of intermediate wave (A). This wave count requires more downwards movement to this minimum at 1,205.74.
Within an expanded flat the B wave is 105% the length of the A wave, so this wave count allows for a new low as quite likely, because expanded flats are the most common type of flat.
Intermediate wave (B) would be about three or so weeks away from ending.
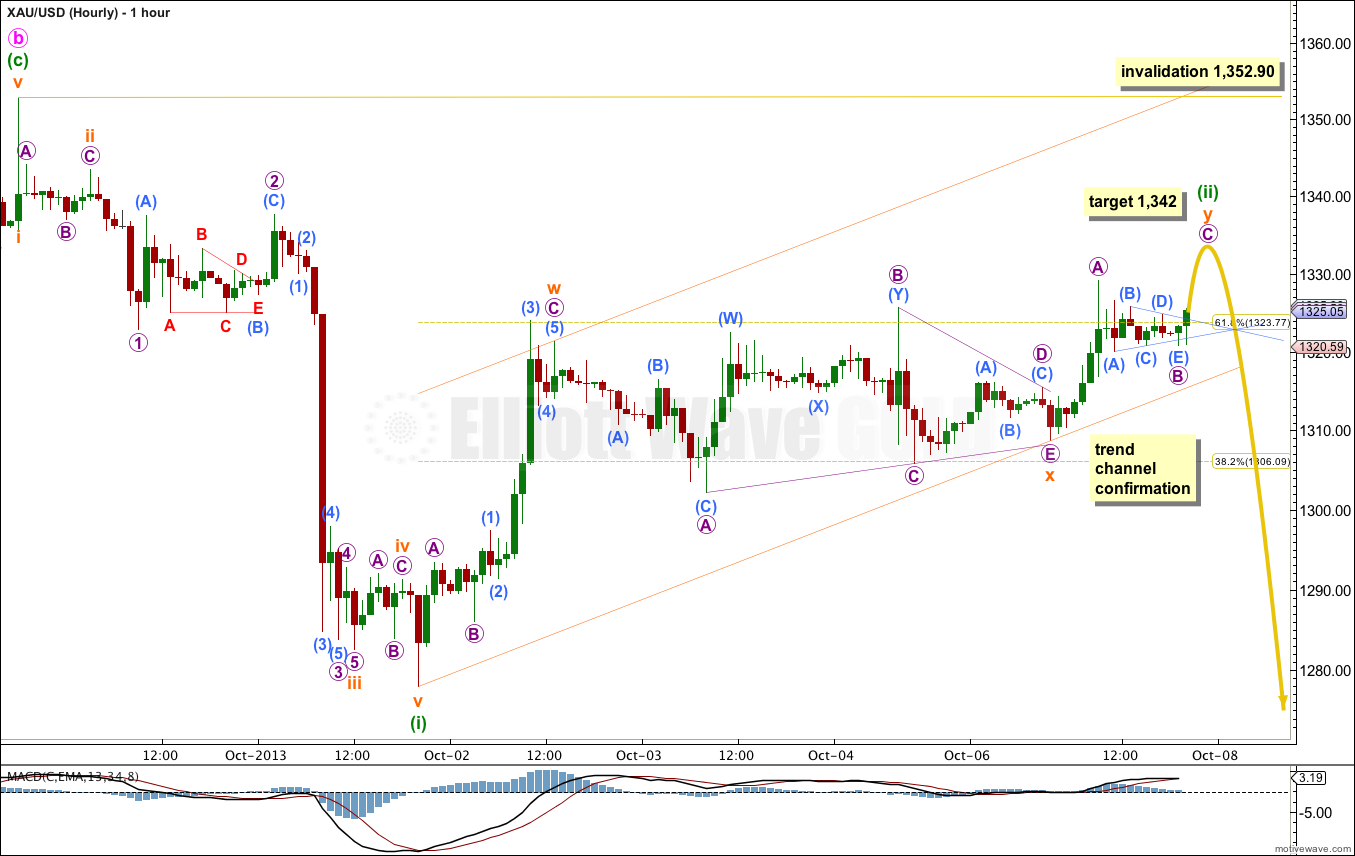
Movement above 1,325.66 has indicated that the second wave correction for minuette wave (ii) is incomplete. It subdivides as a double zigzag.
At this stage it looks like a small triangle is completing. If this is correct we should see a sharp upwards thrust when it is done. The triangle will remain valid as long as price does not move below 1,320.85 before it is completed.
At 1,342 micro wave C would reach equality in length with micro wave A.
If the triangle remains valid then extend the triangle trend lines outwards. The point in time at which they cross over may see a trend change, as often this is when the thrust out of the triangle ends.
If this wave count unfolds as expected, if the triangle completes and we see a sharp thrust upwards afterwards, then subsequent movement below 1,320.06 and below the trend channel drawn here will indicate that subminuette wave ii is finally over and a third wave down should then have begun.
Subminuette wave ii may not move beyond the start of minuette wave (i). This wave count is invalidated with movement above 1,352.90.