
Last week’s analysis expected more upwards movement towards a target at 23.170 before some downwards movement for a correction. Price has moved higher to reach up to 23.088, just 0.08 short of the target.
The wave count remains the same.
Click on the charts below to enlarge.
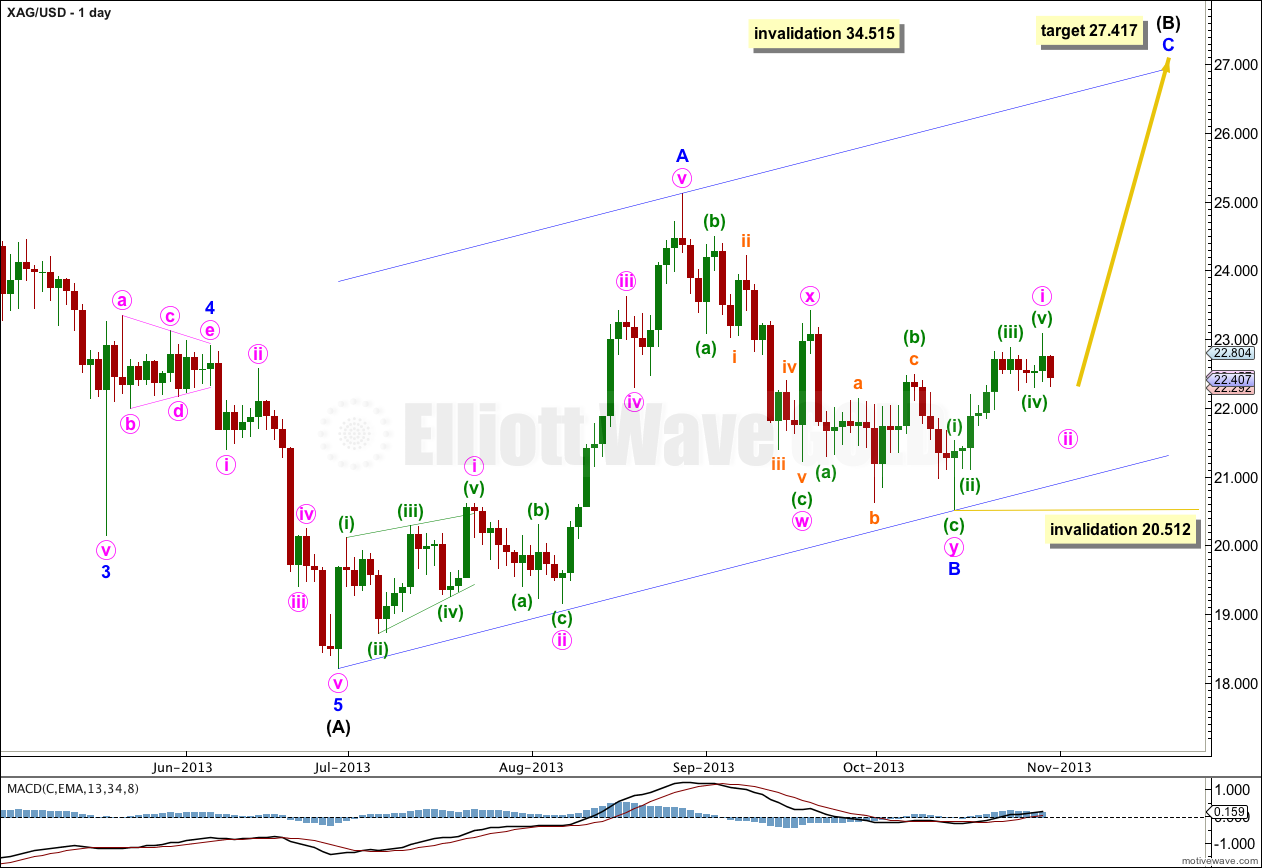
Intermediate wave (B) is unfolding as a simple zigzag. Minor wave A subdivides as a five, and minor wave B is now a complete “three” (a double zigzag).
At 27.417 minor wave C would reach equality in length with minor wave A. Minor wave A lasted 43 days, and minor wave B lasted a Fibonacci 34 days. I would expect minor wave C to last between 34 and 43 days, or thereabouts.
The parallel channel drawn here is Elliott’s technique for a correction. Draw the first trend line from the start of minor wave A to the end of minor wave B, then place a parallel copy upon the end of minor wave A. I will expect minor wave C to find resistance at the upper edge of this channel, and it is most likely to end there.
Within minor wave C minute wave ii may not move beyond the start of minute wave i. This wave count is invalidated with movement below 20.512.
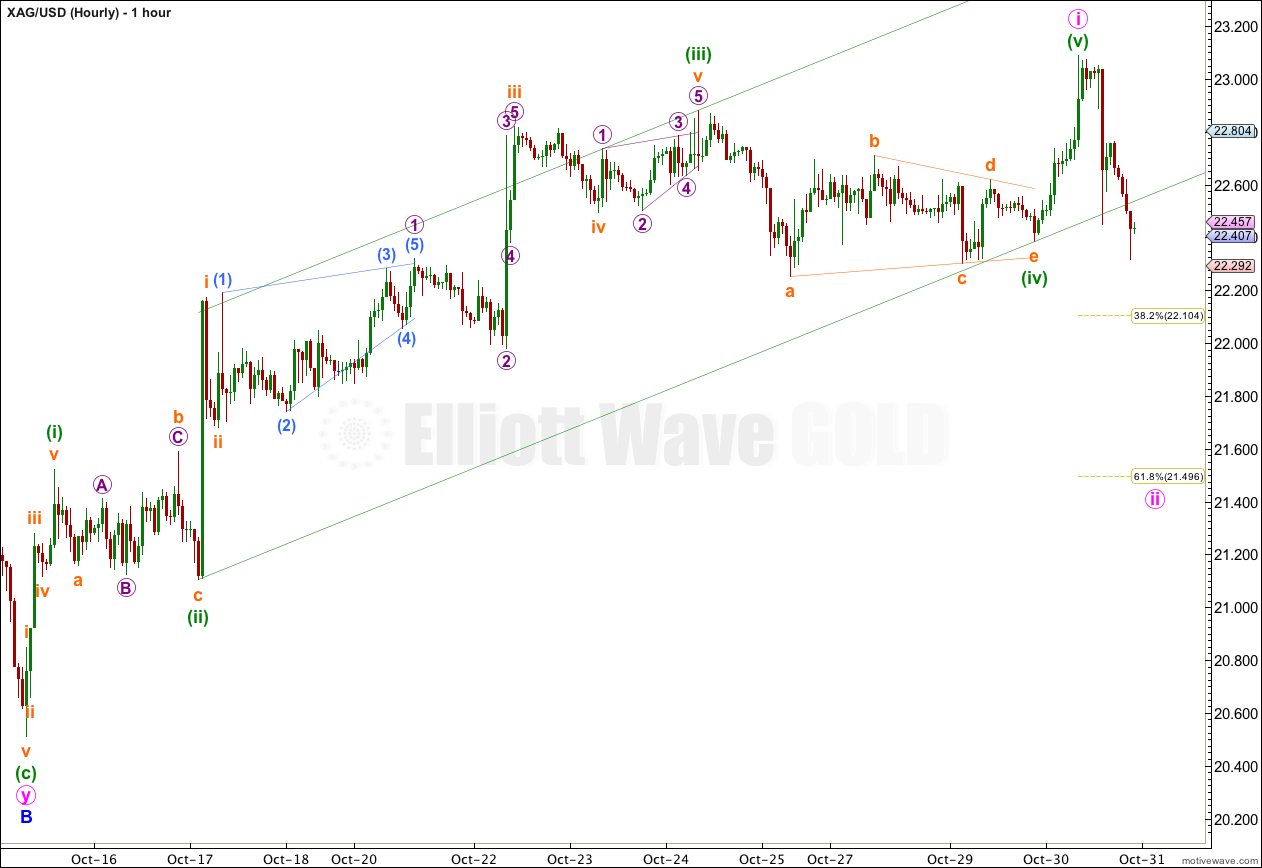
This hourly chart shows all of minute wave i.
Ratios within minute wave i are: minuette wave (iii) is 0.145 longer than 1.618 the length of minuette wave (i), and minuette wave (v) is just 0.023 longer than 0.382 the length of minuette wave (iii).
Within minute wave i there is good alternation between minuette waves (ii) and (iv): minuette wave (ii) was a shallow 41% flat correction, and minuette wave (iv) was a very shallow 28% contracting triangle.
A parallel channel drawn about the impulse of minute wave i using Elliott’s second technique is now clearly breached by downwards movement. This indicates that minute wave i should be over and minute wave ii should now be underway.
Minute wave ii may end about the 0.382 or 0.618 Fibonacci ratio of minute wave i, with the lower 0.618 Fibonacci ratio at 21.496 being more likely.
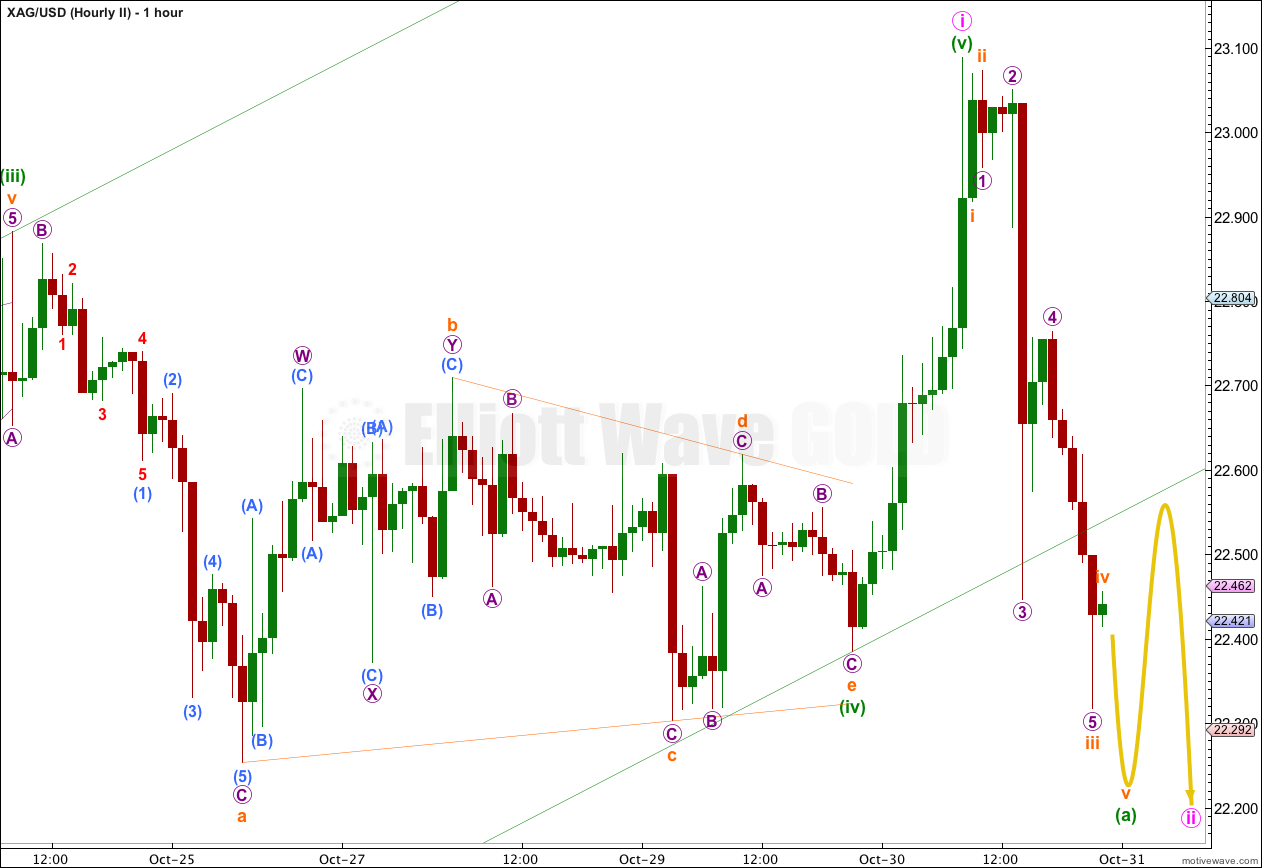
This hourly chart shows most recent movement of minute wave ii in more detail.
So far to the downside I expect that minuette wave (a) is unfolding as an impulse. This suggests minute wave ii may be a zigzag. However, at this early stage in the correction there are still several structural possibilities for minute wave ii.
If minute wave ii unfolds as a zigzag then within it minuette wave (b) may not move beyond the start of minuette wave (a) above 23.088.
Overall for the next one to three days for Silver I would expect choppy, overlapping movement to end about either 22.104 or 21.496, favouring the lower target. When this correction is done I would expect upwards movement above 23.088 to new highs with an increase in upwards momentum as a third wave unfolds. This may begin before next analysis.
Minute wave ii may not move beyond the start of minute wave i. This wave count is invalidated with movement below 20.512.
Gold should go to $1650 by March, because we are entering a period of stagflation ,IMHO. I dont know the wave count for this scenario ,but it will happen.Comment Lara?
I’m not sure what you want me to comment on. You have offered an opinion with nothing to back it up.
Gold has made a major bottom at 1178. I expect that we will soon discover that we do indeed have STAG_FLATION a stagnant economy with inflation. I dont know the possible count for this Lara but Gold at 1650 by March is within sight. IMHO.
Thank you for your recent post. It helped.
Just in case the Main Wave were to be invalidated at 20.51 would that mean that Minor B was not completed yet? And if so, how much further down might it go? Is there an alternate Main scenario you’d suggest just as a “what if”?
( I’m really waiting on Minor C’s upward movement from Minute Wave i but concerned how far price may move south before this happens) Thanks for your help.
I have an alternate which allows for movement below 20.51 but it does not have the “right look” and it includes a very rare running flat. Because it has a very low probability I have not published it.