
End of week analysis expected the new week to begin with sideways and a little upwards movement towards 1,293.62, before one more wave downwards.
Price has moved sideways and slightly lower. This fourth wave correction may be completing a triangle or a flat, and the structure is incomplete.
The main hourly wave count remains the same. The alternate hourly chart, which was already unlikely, now looks very wrong and will be discarded.
Click on the charts below to enlarge.
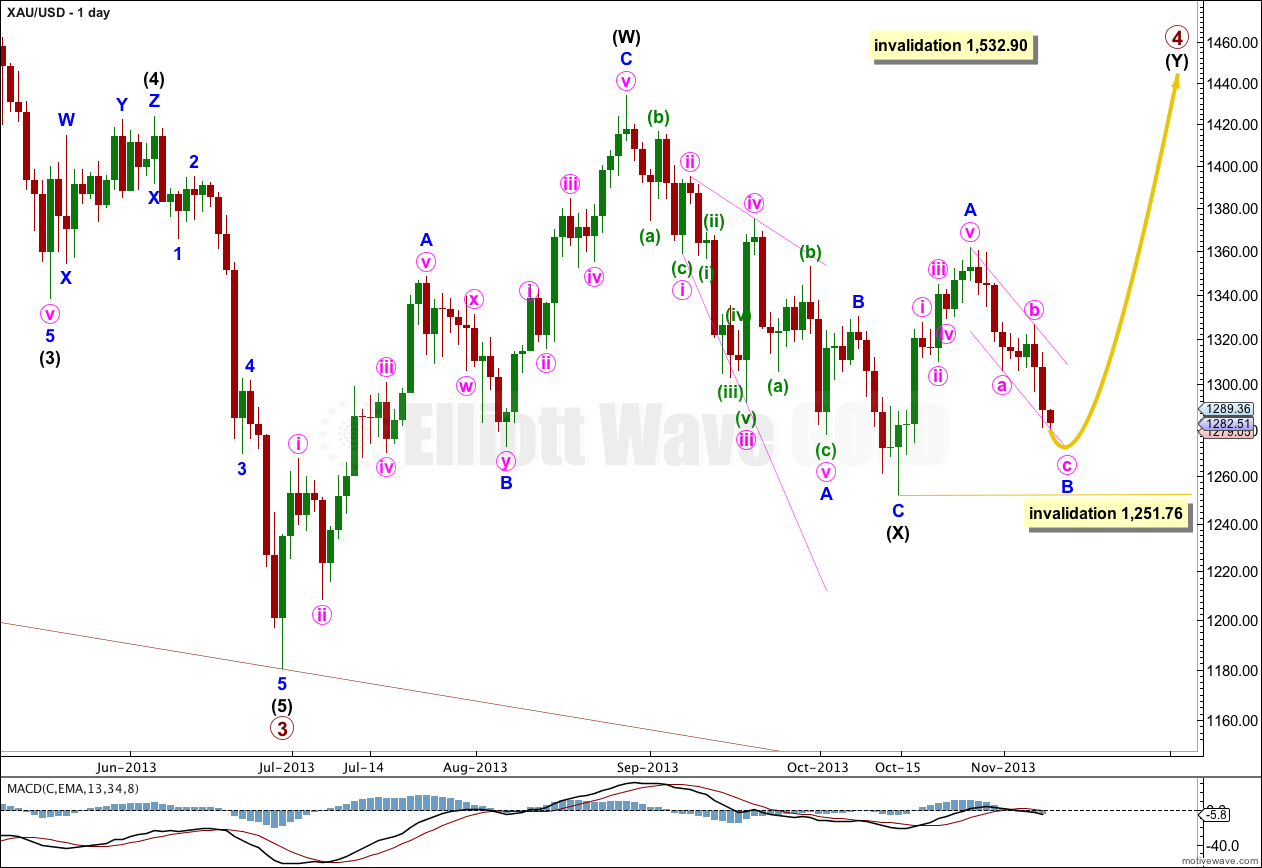
The structure for primary wave 4 cannot be a flat correction, because what would be the B wave is well less than 90% of what would be the A wave. That is why I have labeled it as a double.
Because intermediate wave (X) is quite shallow I would expect primary wave 4 is most likely a double zigzag rather than a double combination. Double combinations move price sideways and their X waves are usually deeper than this one is. Double zigzags trend against the main direction, and their purpose is to deepen a correction when the first zigzag did not take price deep enough. So I will be expecting intermediate wave (Y) to subdivide as a zigzag and to take price comfortably above 1,433.83. It should last about 35 to 45 days or sessions in total.
Within the zigzag of intermediate wave (Y) minor wave B may not move beyond the start of minor wave A. This wave count is invalidated with movement below 1,251.76.
Main Hourly Wave Count.
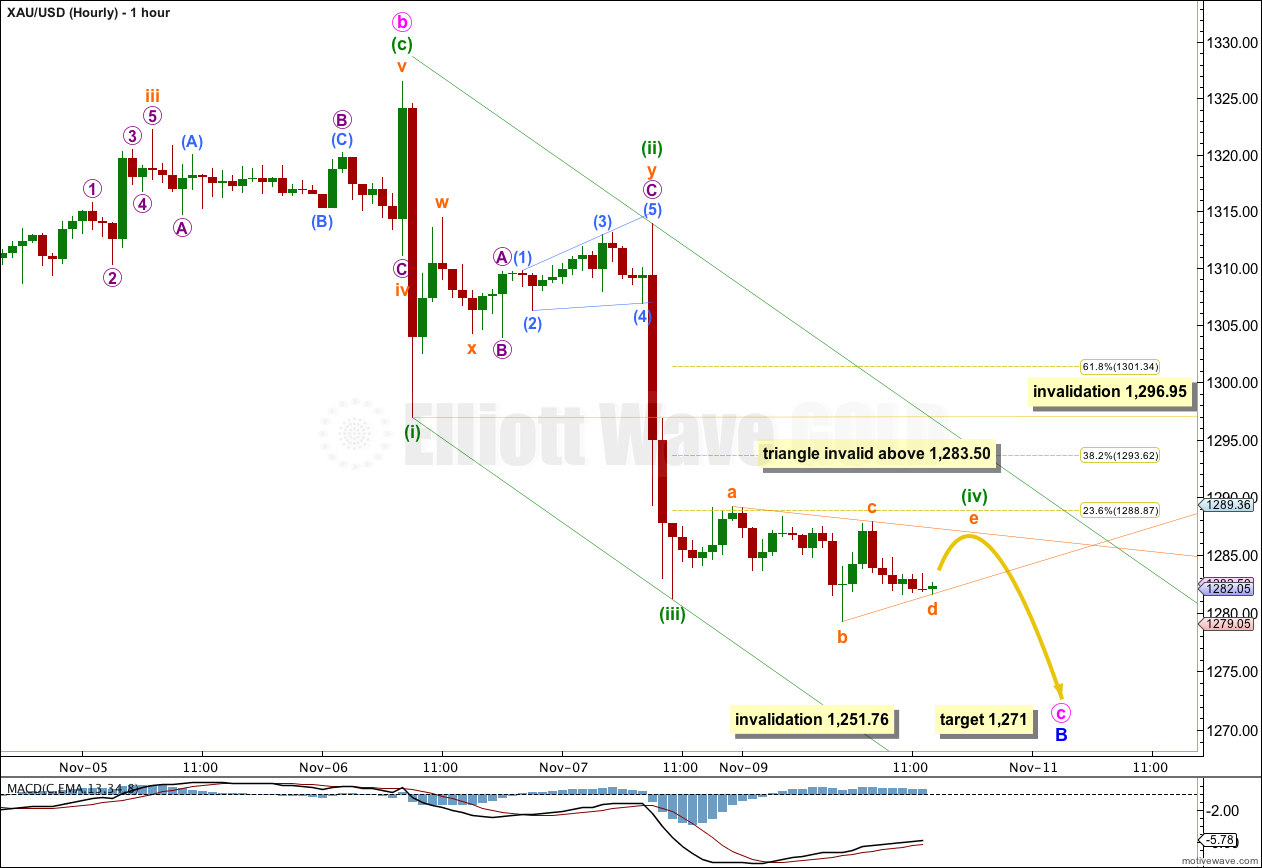
Sideways and lower movement is typically corrective; it subdivides into a series of three wave structures. Minuette wave (iv) may be completing as a running contracting triangle, or an expanded flat. This first main hourly wave count looks at the possibility of a triangle.
If minuette wave (iv) is a triangle then within it subminuette wave e may not move beyond the end of subminuette wave c above 1,283.50. If upwards movement breaches this point, even by a fraction of a cent, then minuette wave (iv) is likely to be a flat correction and the alternate hourly chart below should be used.
If minuette wave (iv) completes as a triangle then the final wave of subminuette wave e may undershoot or overshoot the a-c trend line. If the triangle remains valid then when it is complete I would expect a short sharp downwards thrust for minuette wave (v).
If the triangle remains valid keep drawing the trend lines and extend them outwards. The point in time at which the trend lines cross over may see a trend change, this may be where minuette wave (v) downwards ends.
Minuette wave (iv) may not move into minuette wave (i) price territory. This wave count is invalidated with movement above 1,296.95.
Alternate Hourly Wave Count.
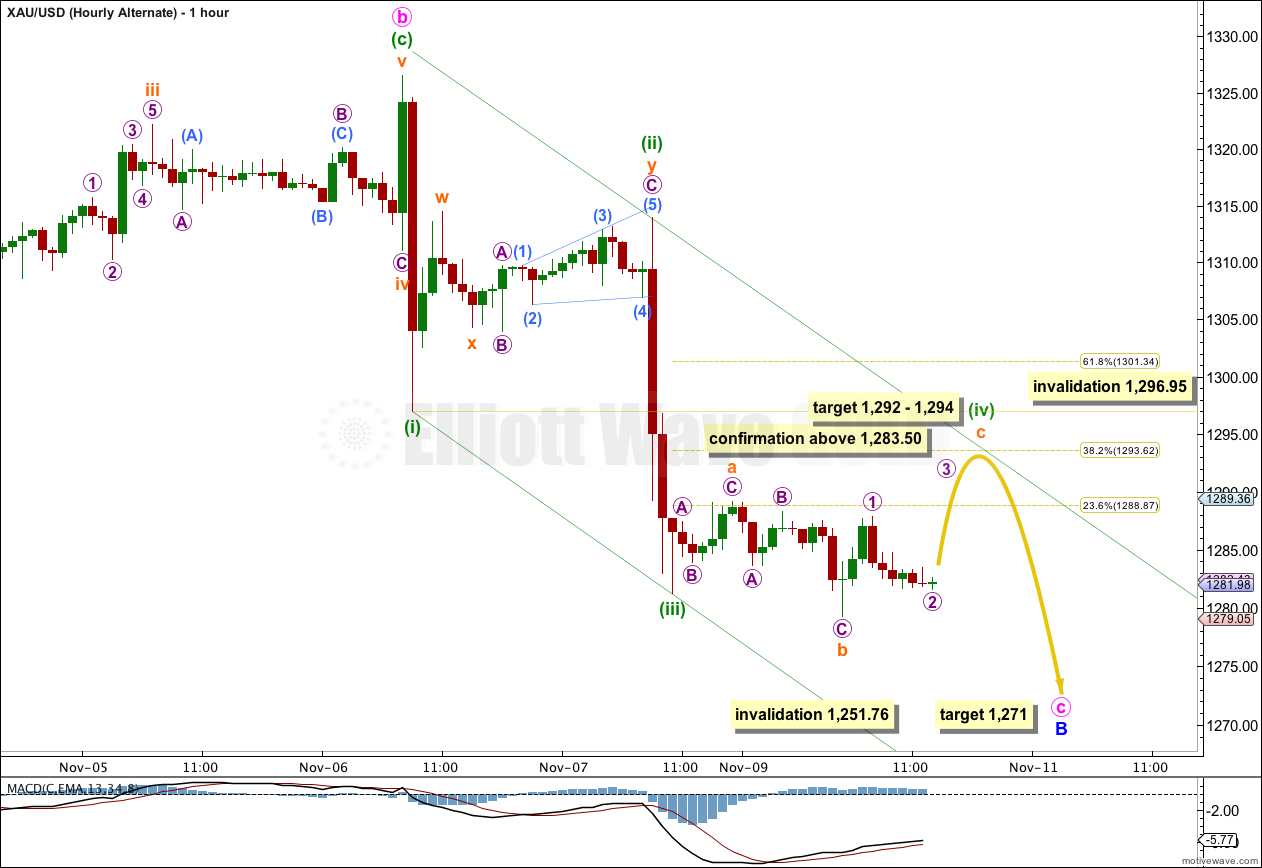
If minuette wave (iv) is an expanded flat then I would expect upwards movement to end about 1,292 to 1,293.62 where subminuette wave c of the expanded flat would be 1.618 the length of subminuette wave a, and the whole structure would end about the 0.382 Fibonacci ratio of minuette wave (iii).
Minuette wave (iv) may not move into minuette wave (i) price territory. This wave count is invalidated with movement above 1,296.95.