Thursday’s analysis expected sideways movement to end about 1,314.96, followed by strong downwards movement as a third wave began.
Price moved sideways to reach 1,313.93 then turned downwards strongly. Downwards momentum has increased as expected. The wave count remains the same.
Click on the charts below to enlarge.
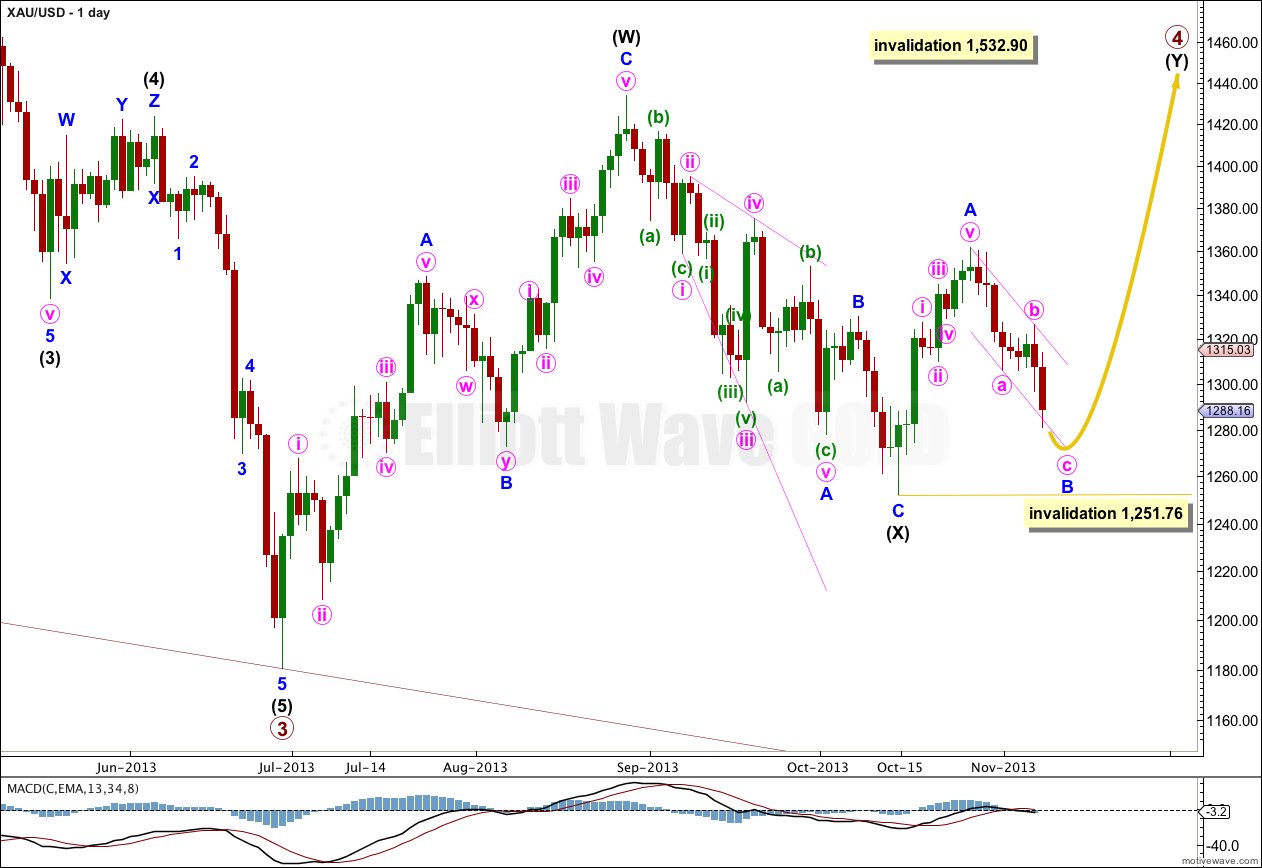
The structure for primary wave 4 cannot be a flat correction, because what would be the B wave is well less than 90% of what would be the A wave. That is why I have labeled it as a double.
Because intermediate wave (X) is quite shallow I would expect primary wave 4 is most likely a double zigzag rather than a double combination. Double combinations move price sideways and their X waves are usually deeper than this one is. Double zigzags trend against the main direction, and their purpose is to deepen a correction when the first zigzag did not take price deep enough. So I will be expecting intermediate wave (Y) to subdivide as a zigzag and to take price comfortably above 1,433.83. It should last about 35 to 45 days or sessions in total.
Within the zigzag of intermediate wave (Y) minor wave B may not move beyond the start of minor wave A. This wave count is invalidated with movement below 1,251.76.
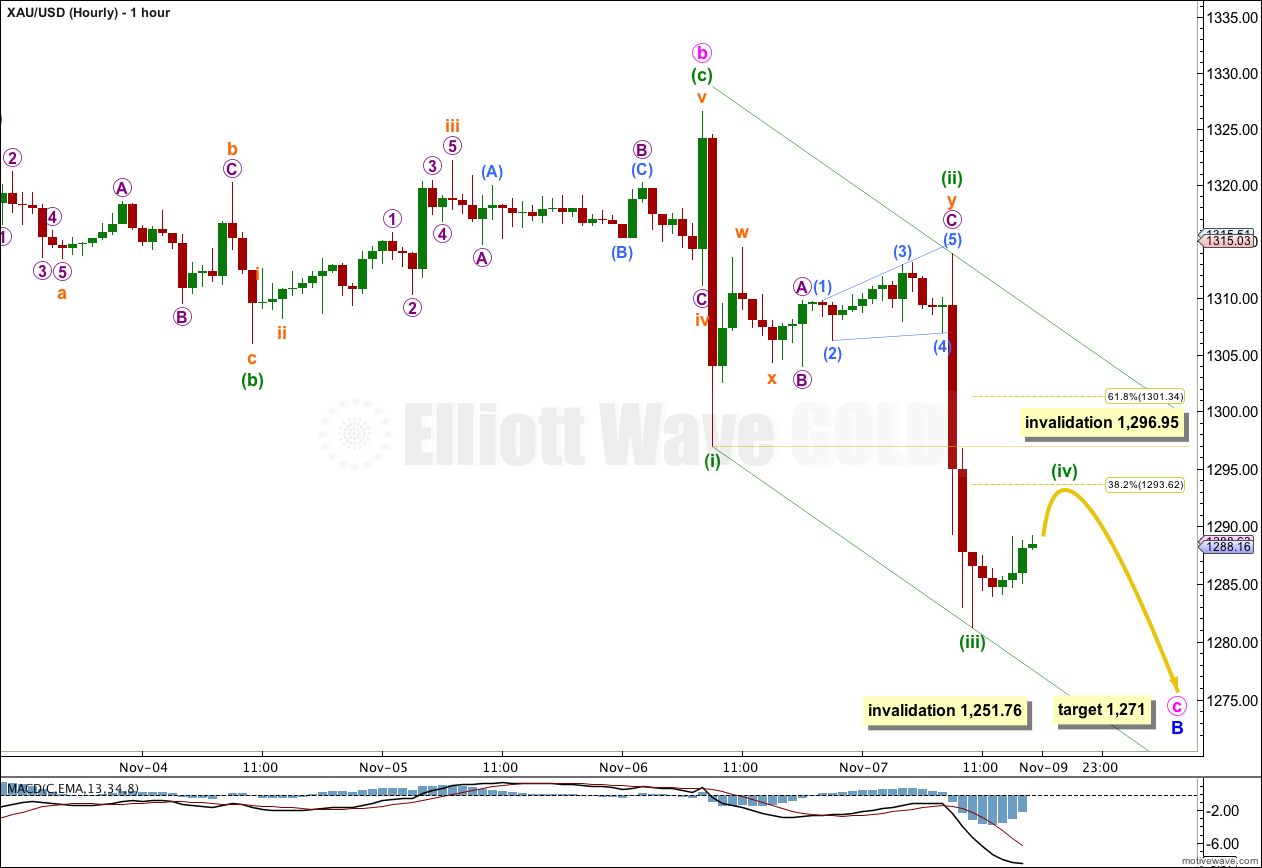
Minuette wave (iii) may be over. Sideways and upwards movement at the end of the week may have been minuette wave (iv).
Minuette wave (iii) is 3.15 longer than equality with minuette wave (i). We may not see a Fibonacci ratio between minuette wave (v) and either of minuette waves (iii) or (i).
Minuette wave (ii) lasted 24 hours so I would expect minuette wave (iv) to be reasonably similar in duration. So far it has only lasted 6 hours. It should end towards the end of Monday.
Minuette wave (ii) was a relatively deep 57% combination correction. Given the guideline of alternation I would expect minuette wave (iv) to be relatively shallow, reaching up to about the 0.382 Fibonacci ratio of minuette wave (iii) at 1,293.62. It is most likely to be a zigzag, flat or triangle.
Thereafter, I would expect one final wave downwards, with a decrease in momentum, to the target at 1,271 where minute wave c would reach equality in length with minute wave a.
Minute wave c has now broken through support at the lower edge of the wider channel about minor wave B which is drawn on the daily chart. Draw a channel about minute wave c using Elliott’s first technique. Draw the first trend line from the lows of minuette waves (i) to (iii), then place a parallel copy upon the high of minuette wave (ii). Minuette wave (iv) should remain within this channel, and the following final wave downwards for minuette wave (v) should end either mid way within the channel or find support at the lower edge.
When minuette wave (v) downwards is completed then the entire structure for minor wave B would be complete. At that stage I would expect a trend change and upwards movement for about two weeks.
Minuette wave (iv) may not move into minuette wave (i) price territory. This wave count is invalidated with movement above 1,296.95.
If this main hourly wave count is invalidated with upwards movement then the alternate below may be correct.
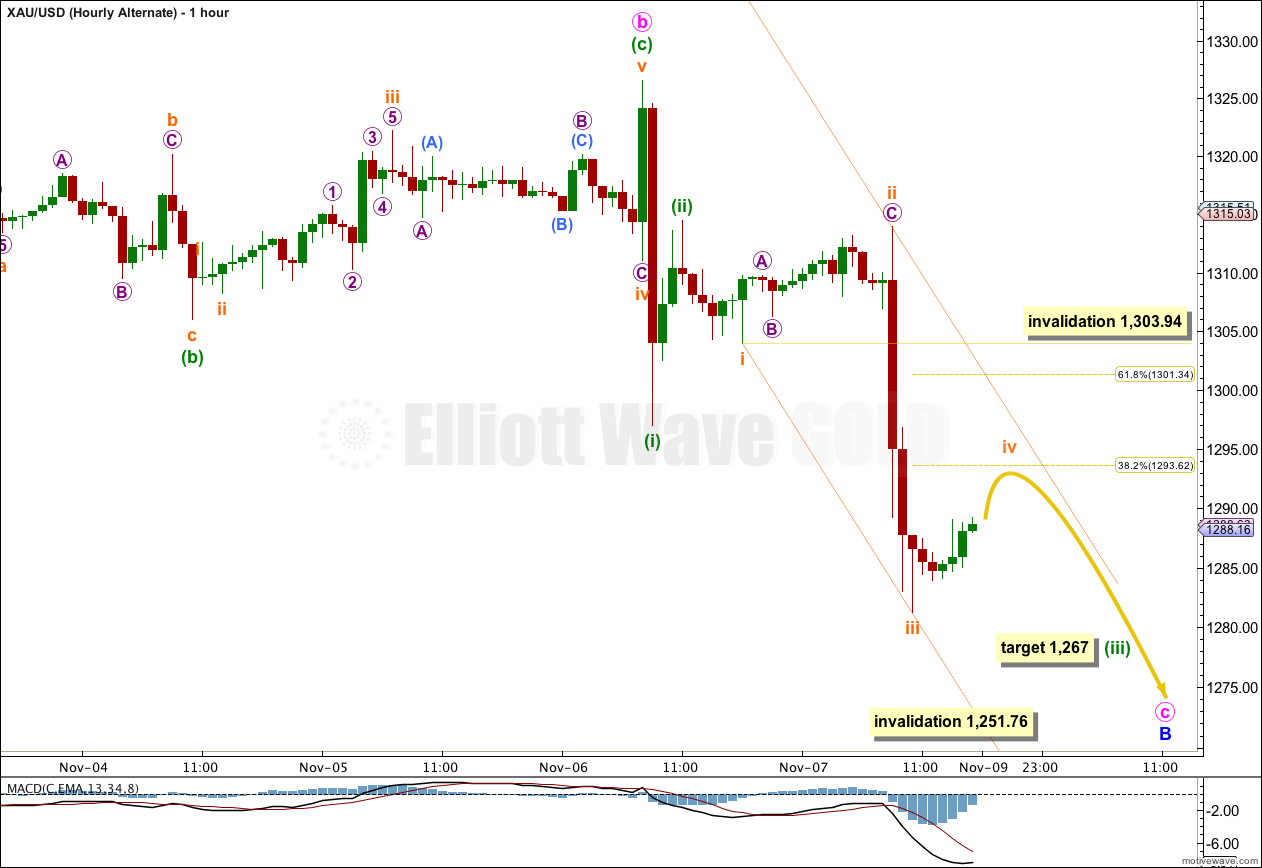
Hourly Alternate Wave Count.
If the structure labeled minuette wave (ii) combination on the main hourly wave count is seen differently then it is possible that minuette wave (iii) is incomplete and is extending. However, this does not have as good a fit as the main wave count.
In the short term this alternate expects exactly the same movement next; a small fourth wave correction should move a little higher to about 1,293.62 then the recent downwards trend should resume.
When this alternate diverges with the main wave count I will determine a confirmation / invalidation point to differentiate the two. That should be in another two days of price movement.
This alternate has a higher invalidation point. If upwards movement is subminuette wave iv within minuette wave (iii) then it may not move into subminuette wave i price territory above 1,303.94.


