Last week’s analysis of Silver expected downward movement for a second wave correction which is exactly what has happened. With more of this structure now to analyse I can now calculate a target for it to end for you.
Click on the charts below to enlarge.
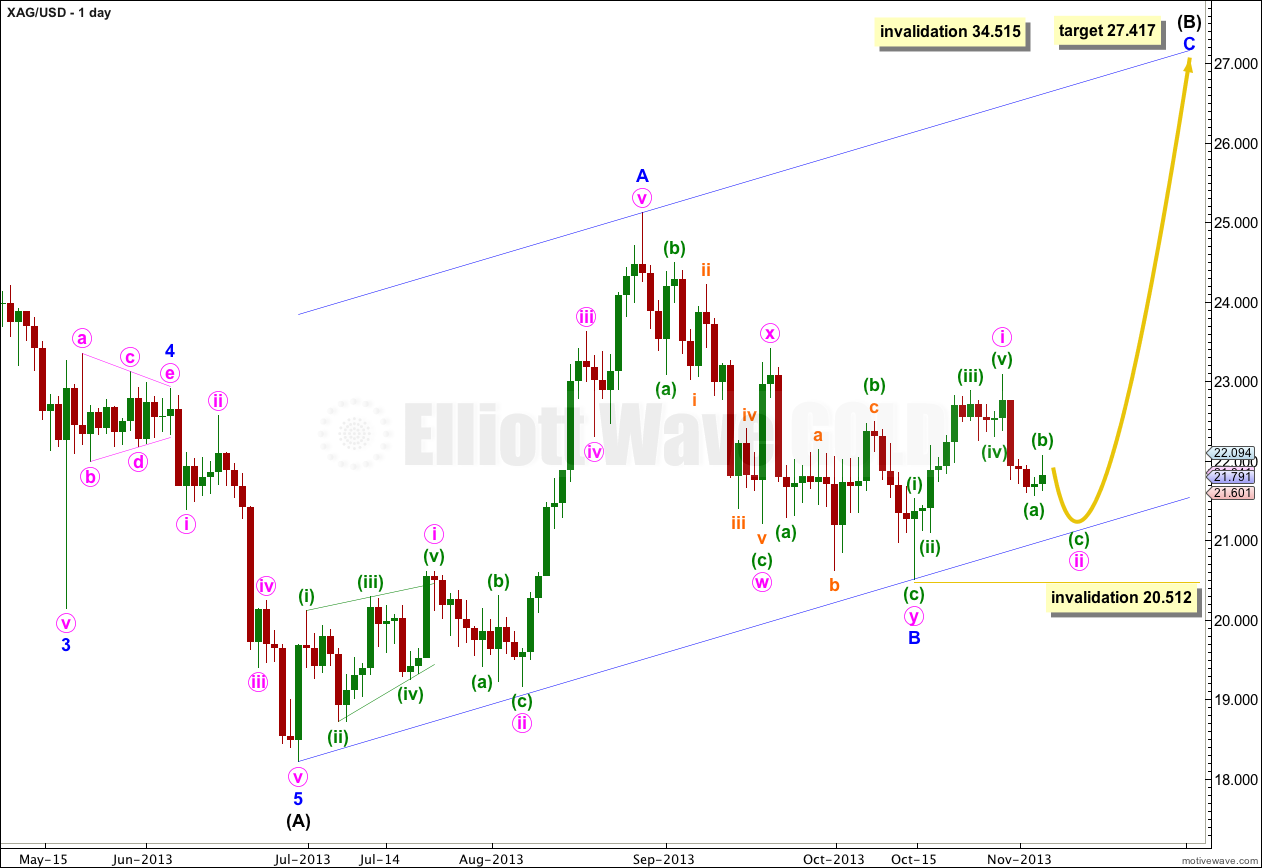
Intermediate wave (B) is unfolding as a simple zigzag. Minor wave A subdivides as a five, and minor wave B is now a complete “three” (a double zigzag).
At 27.417 minor wave C would reach equality in length with minor wave A. Minor wave A lasted 43 days, and minor wave B lasted a Fibonacci 34 days. I would expect minor wave C to last between 34 and 43 days, or thereabouts.
The parallel channel drawn here is Elliott’s technique for a correction. Draw the first trend line from the start of minor wave A to the end of minor wave B, then place a parallel copy upon the end of minor wave A. I will expect minor wave C to find resistance at the upper edge of this channel, and it is most likely to end there.
Within minor wave C minute wave ii may not move beyond the start of minute wave i. This wave count is invalidated with movement below 20.512.
Within minor wave C minute wave i is complete, and minute wave ii is unfolding as a deep zigzag which is incomplete. I will expect more downwards movement for another two to three days before minute wave ii is completed.
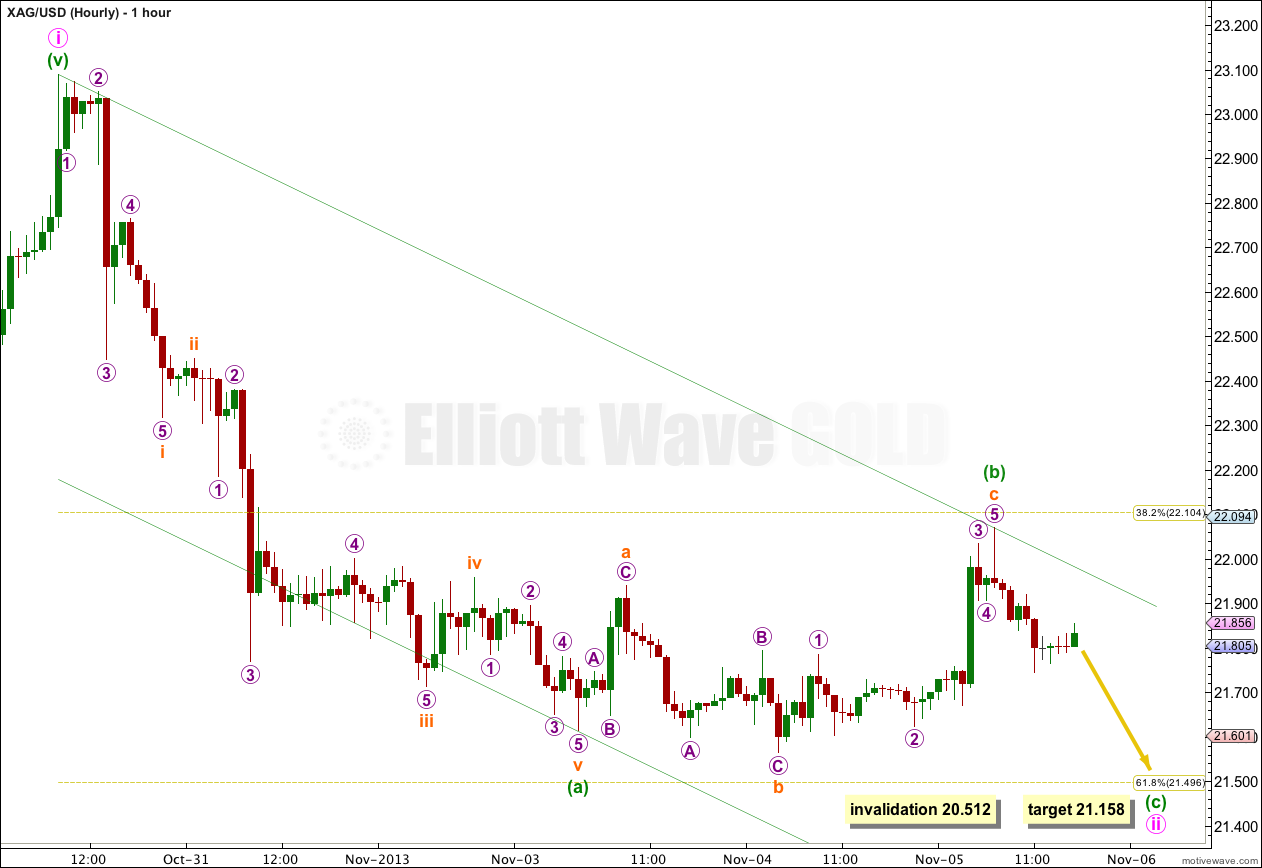
At 21.158 minuette wave (c) would reach 0.618 the length of minuette wave (a). This would bring minute wave ii to just below the 0.618 Fibonacci ratio of minute wave i at 21.496.
Ratios within minute wave (a) are: subminuette wave iii is 0.033 short of equality with subminuette wave i, and subminuette wave v has no Fibonacci ratio to either of subminuette waves i or iii.
Minuette wave (b) is an expanded flat correction: subminuette wave a subdivides as a three; subminuette wave b subdivides as a three and is a 115% correction of subminuette wave a; subminuette wave c is just 0.021 short of 1.618 the length of subminuette wave a, and it subdivides as a five wave impulse.
We can now use Elliott’s technique to draw a channel about this downward zigzag of minute wave ii. Draw the first trend line from the start of minuette wave (a) to the end of minuette wave (b), then place a parallel copy upon the end of minuette wave (a). If it gets down that far I would expect minuette wave (c) to find support at the lower trend line, but I would expect it to be more likely to end mid way within this channel.
I would expect minuette wave (c) downward to take about two or three days to complete. When it is done I will expect a trend change and the resumption of the upward trend. The next wave up should be a third wave, and should show strong upward momentum.
When this channel is breached by subsequent upwards movement then I would have confidence minute wave ii is over, and that minute wave iii would have begun.
Minute wave ii may not move beyond the start of minute wave i. This wave count is invalidated with movement below 20.512.


Ditto on the question above. On kitco it shows we hit 20.50— Wondering what happens now with the silver wave count. Thanks, look forward to learning more with your site.
I do have a wave count which allows for movement below 20.512 but it has a low probability.
Because of your questions I’ll publish it when I update silver later today, but it will come with the caveat that it has a lower probability than the main wave count.
At the end of the day Elliott wave analysis is an exercise in probability. I am trying to see the wave count with the highest probability, and by doing that I aim to be right more often than wrong in terms of direction.
Wave counts with low probabilities sometimes do occur (rare structures are rare, that does not mean they never happen). When they do they would never be expected to happen by an analyst; that is the nature of probability.
I really hope that readers and members understand this concept.
Lara, when you talk about a wave structure being invalidated, can you expand on what that would mean to the next higher structure? Like the Intermediate Wave.
For example, when talking here about Minor waves….”Within minor wave C minute wave ii may not move beyond the start of minute wave i. This wave count is invalidated with movement below 20.512.” … Are you saying that just the i, ii wave count becomes invalid within Minor C? Or are you saying that the ii wave below 20.512 invalidates the Minor C structure as a whole, and does that thereby impact the analysis of the Intermediate Wave B projected target)?
[It is the Intermediate (B) target price that I am most concerned with for now.]
If 20.512 were to invalidate the count, what chart would that return me to [posting date, main/hourly]?
Please forgive my ignorance, I am in the beginning stages of learning about Elliot Waves. Not doing my own wave counts yet — will be starting on educational material hopefully soon.
Thank you for your dedication and helping others understand Elliott Wave.
If an invalidation point is breached then the wave count is invalid at that time frame. I cannot give a more specific answer because there are too many variables, the wave count may change at different degrees depending upon the details of each specific wave count.
In the case of silver if price moves below 20.512 then minor wave C has not begun, minor wave B may still be continuing.
I do have an alternate wave count for this possibility, but because it includes a rare running flat it has a low probability and so I have not published it.
Which date would you begin to count the 34-43 days for minor wave C
thank you,
Rose
15th October, 2013
Lara, which most closely aligns with EW predictions gold, silver or oil? Thanks.
I’m not sure what you mean. Do you mean which market fits EW analysis best? That would be gold.
Gold has the best Fibonacci ratios in terms of price, and the most common Fibonacci relationships in terms of duration, and the most typical looking structures of any market I have ever analysed. This means my accuracy rate should be better.