
Yesterday’s analysis expected a little more upwards movement before price turned down. This is not what happened.
A careful analysis of the last downwards wave on the hourly chart will determine if this correction is over or not.
Click on the charts below to enlarge.
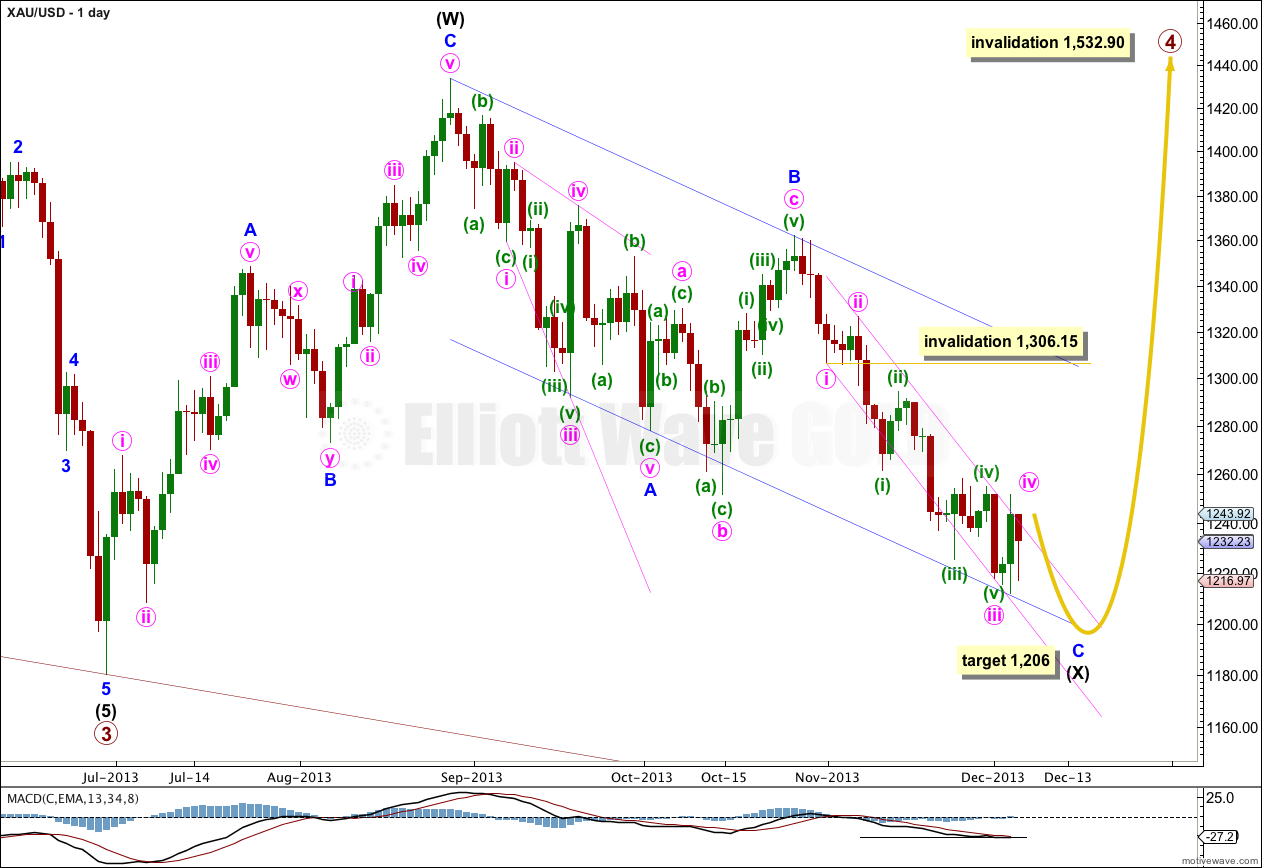
Gold is still within a large fourth wave correction at primary wave degree which is incomplete. It is unlikely that primary wave 4 was over at 1,433.83 as a single zigzag because it would have lasted only nine weeks. Its counterpart primary wave 2 lasted 53 weeks. This is too big a difference for the wave count to have the “right look”.
Primary wave 2 was a rare running flat correction, and was a deep 68% correction of primary wave 1. In order to show alternation in structure primary wave 4 may be a zigzag, double zigzag, combination, triangle or even an expanded or regular flat. We can rule out a zigzag because the first wave subdivides as a three. This still leaves several structural possibilities.
If price reaches 1,205.74 then downwards movement labeled intermediate wave (X) would be 90% of upwards movement labeled intermediate wave (W). I would relabel primary wave 4 as an A-B-C flat correction. If price does not reach 1,205.74 then primary wave 4 is most likely a double combination.
Within intermediate wave (X) zigzag downwards minor wave C has an extended third wave which is now complete. So far a count of minor wave C gives a count of eight, and one more downwards wave is required to complete an impulsive wave, with a count of nine.
Draw the parallel channel about minor wave C downwards with the first trend line from the lows labeled minute waves i to iii, then place a parallel copy upon the high labeled minute wave ii. Minute wave iv has slightly overshot this channel so far. When minute wave iv is complete I will redraw the channel using Elliott’s second technique.
I would expect downwards movement to find support at the lower edge of the parallel channel drawn here about intermediate wave (X).
Draw a parallel channel about the zigzag of intermediate wave (X): draw the first trend line from the start of minor wave A to the end of minor wave B, then place a parallel copy upon the end of minor wave A. When this channel is finally breached by upwards movement then I would consider that final confirmation that intermediate wave (Y) is underway.
Primary wave 4 may not move into primary wave 1 price territory. This wave count is invalidated with movement above 1,532.90.
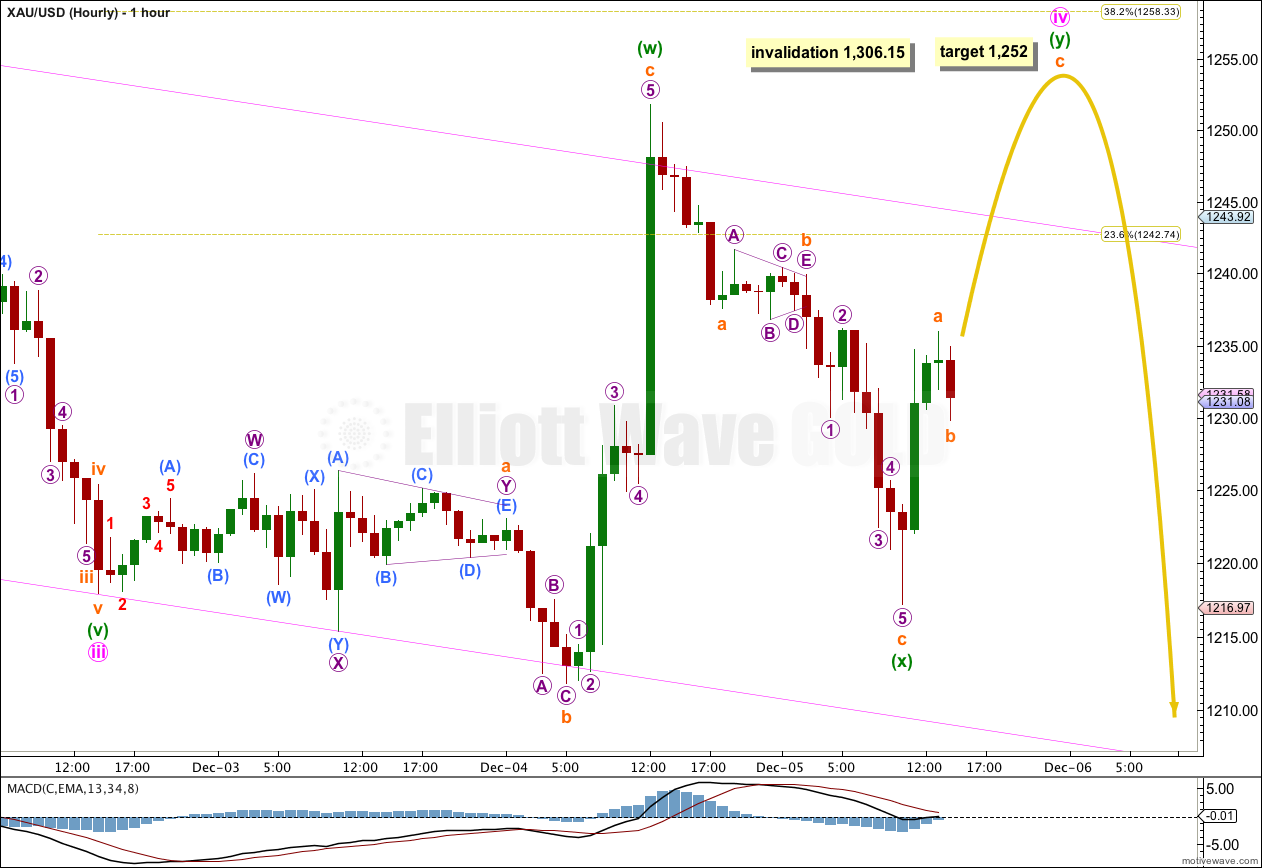
Upwards movement was already finished yesterday and it subdivides best as a five.
The following downwards movement subdivides best as a three. There is a triangle in the upper half, which could not be a second wave, and is very likely to be a B wave within a zigzag.
This indicates that minute wave iv is incomplete. It may be continuing sideways as a double combination, which would provide structural alternation with minute wave ii which was a regular flat.
If minuette wave (y) is a zigzag (most likely) then within it subminuette wave b may not move beyond the start of subminuette wave a at 1,217.18. Minuette wave (y) may also be a running triangle though which may include a new low below 1,217.18 so this lower invalidation point for this wave count is not black and white.
I would expect minuette wave (y) to end about or slightly above the end of minuette wave (w) at 1,251.84. So far it looks like minuette wave (y) may be unfolding as a zigzag.
If minuette wave (y) takes the rest of this day to complete, with a green candlestick, then minute wave iv would have lasted four days which is exactly the same duration as all the other corrections within minor wave C. This is most likely.
Minute wave iv may not move into minute wave i price territory. This wave count is invalidated with movement above 1,306.15.
Daily Alternate Wave Count – Triangle.
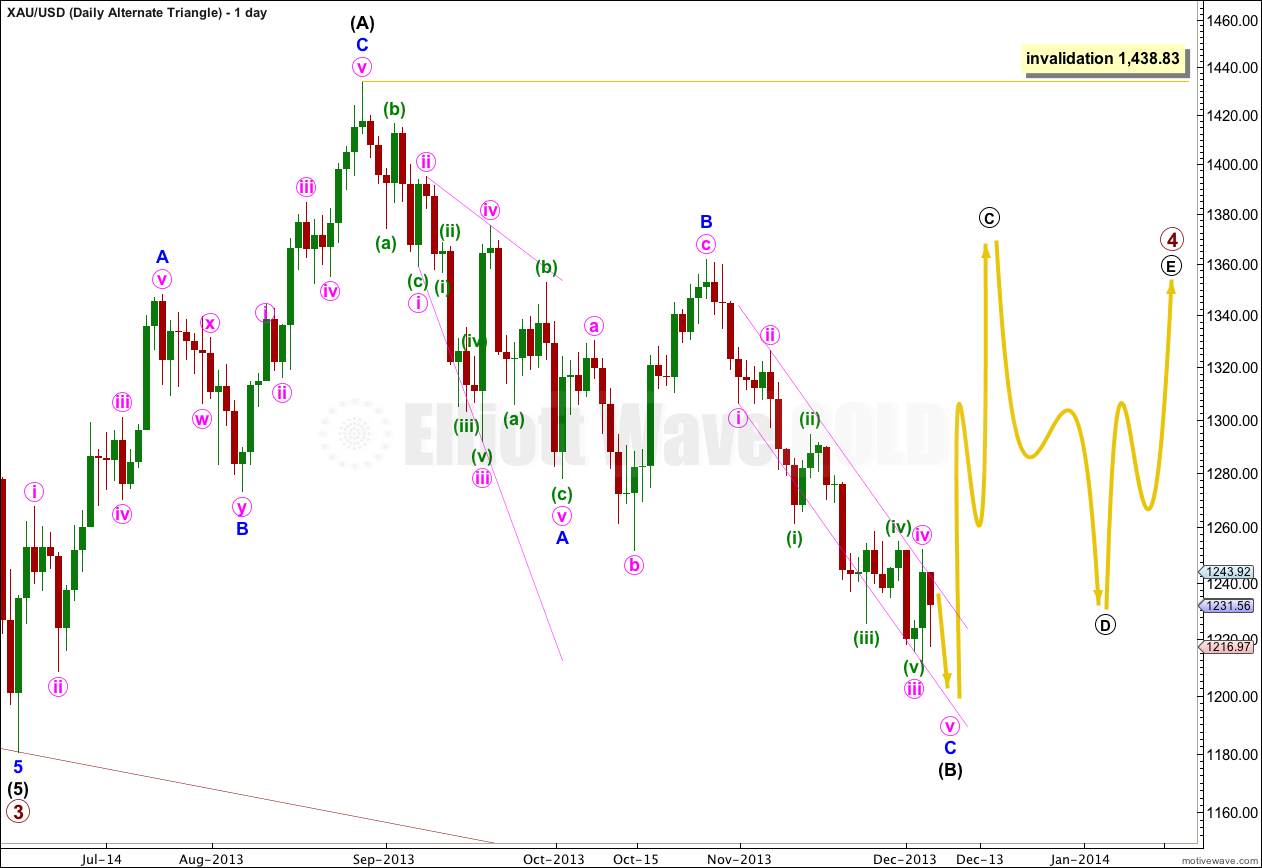
It is also possible that primary wave 4 may continue as a regular contracting (or barrier) triangle.
The expected direction and structure of this next upwards wave is the same, but for this alternate intermediate wave (C) of the triangle may not move beyond the end of intermediate wave (A). The triangle is invalidated with movement above 1,438.83.
The final intermediate wave (E) upwards may not move above the end of intermediate wave (C) for both a contracting and barrier triangle. E waves most commonly end short of the A-C trend line.
All five subwaves of a triangle must divide into corrective structures. If this next upwards movement subdivides as a zigzag which does not make a new high above 1,438.83 then this alternate would be correct.
Triangles take up time and move price sideways. If primary wave 4 unfolds as a triangle then I would expect it to last months rather than weeks.