
Last analysis expected more downwards movement towards a short term target at 96.49. Downwards movement reached 96.21. Price turned upwards from there.
The wave count is the same.
Click on the charts below to enlarge.
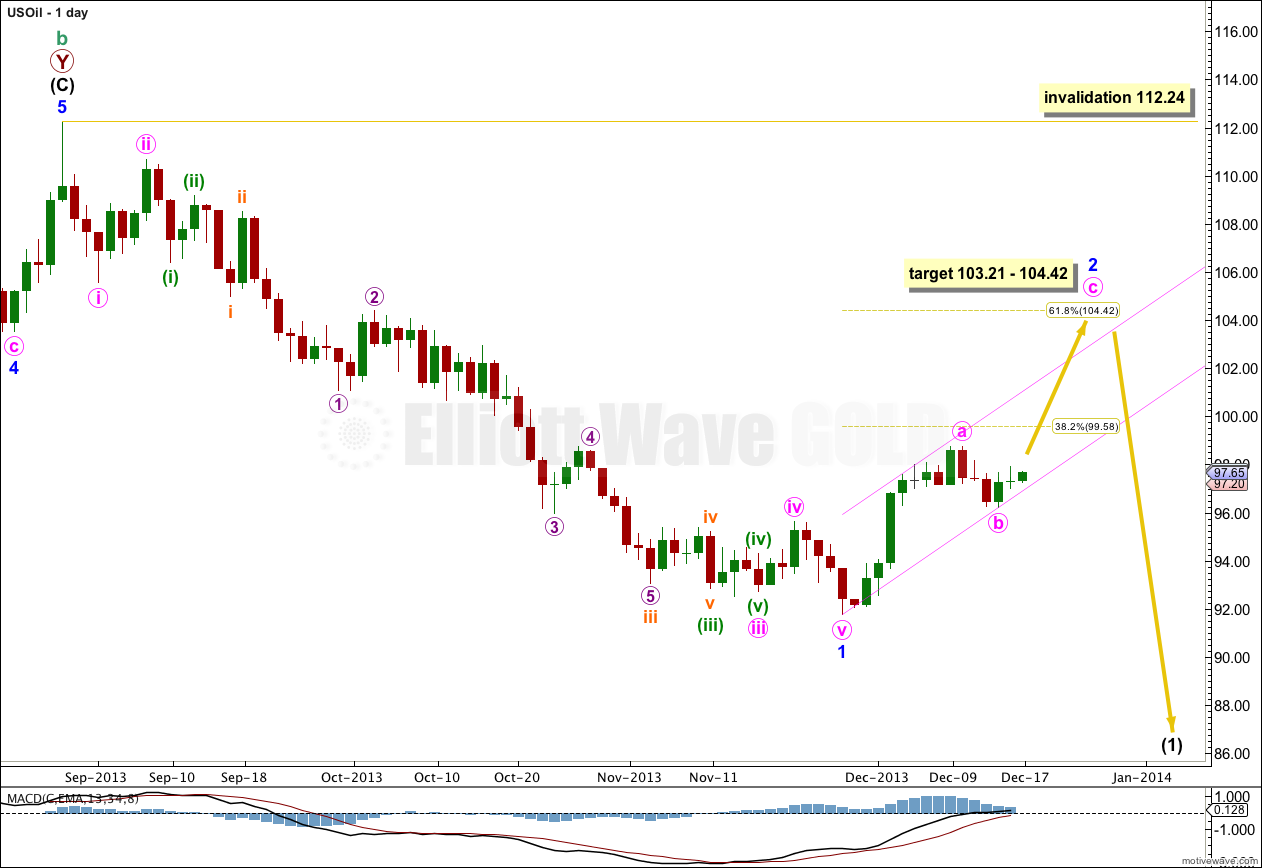
The bigger picture sees US Oil in a new downwards trend to last from one to several years. There is now a clear five wave structure downwards on the daily chart, and I have some confidence in a trend change at cycle degree.
Within the downwards movement the strongest downwards momentum is within the third wave. Minute wave iii is over and was just 0.40 longer than 2.618 the length of minute wave i, and minute wave v is 0.29 short of 0.618 the length of minute wave i.
Ratios within minute wave iii are: there is no Fibonacci ratio between minuette waves (iii) and (i), and minuette wave (v) is 0.08 short of 0.382 the length of minuette wave (i).
Minor wave 1 lasted 65 days. I would expect minor wave 2 to be around about a similar duration. It must subdivide into a clear three wave structure. It is most likely to end about the 0.618 Fibonacci ratio of minor wave 1 at 104.42. At 103.21 minute wave c would reach equality with minute wave a.
I have drawn a parallel channel about minor wave 2. I would expect minute wave c to find resistance at the upper edge of this channel.
Minor wave 2 may not move beyond the start of minor wave 1. This wave count is invalidated with movement above 112.24.
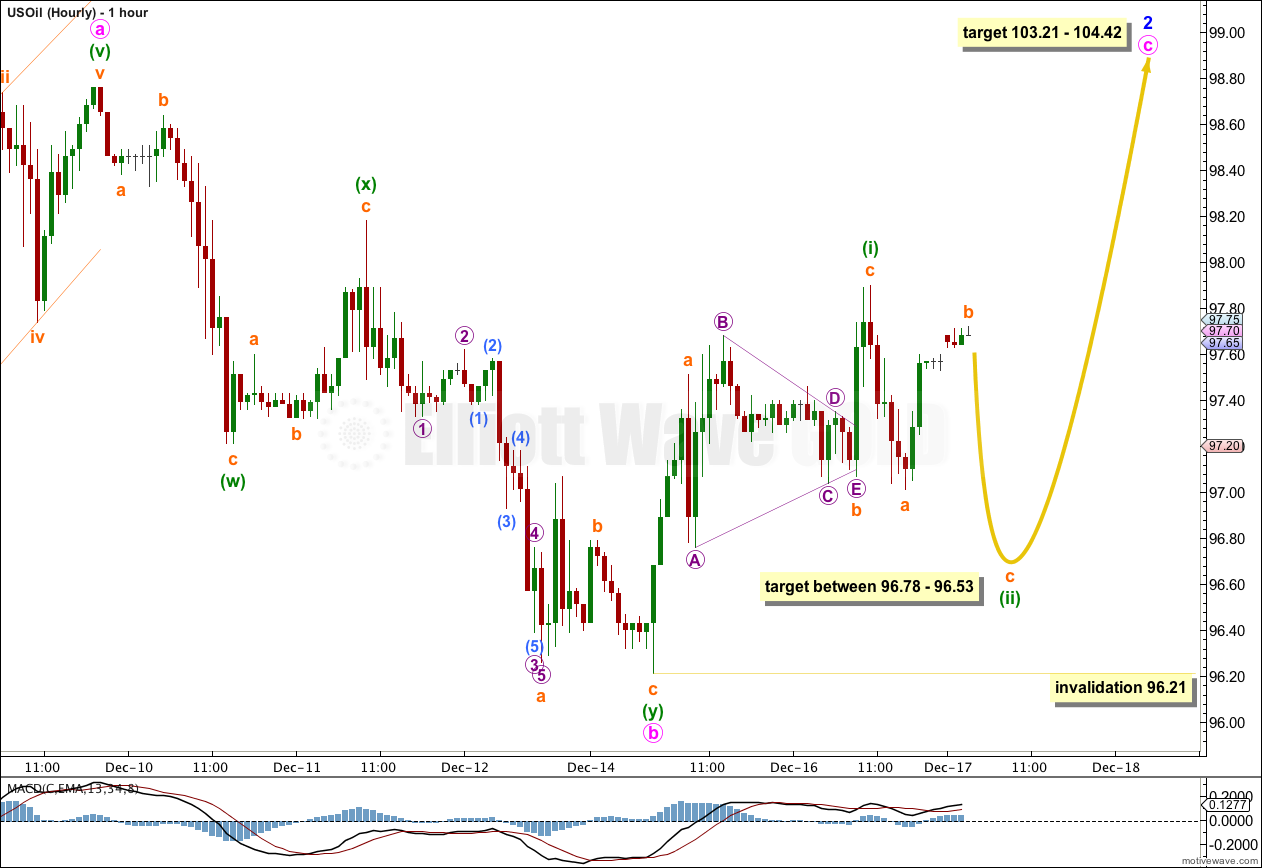
So far minute wave c may be unfolding as an ending diagonal. The first upwards wave subdivides best as a zigzag, with a b wave triangle in the middle.
Within the diagonal minuette wave (ii) is most likely to end between 0.66 and 0.81 the length of minuette wave (i), between 96.78 and 96.53.
Minuette wave (ii) may not move beyond the start of minuette wave (i). This wave count is invalidated with movement below 96.21.