
Upwards movement invalidated the hourly wave count. Although a new high within a B wave is possible this high is too soon within the B wave to fit the wave count.
The wave count is changed.
Summary: Minor wave A is just complete or very close to completion. The next movement for Gold should be overall downwards movement which may be very choppy and overlapping.
Click on the charts below to enlarge.
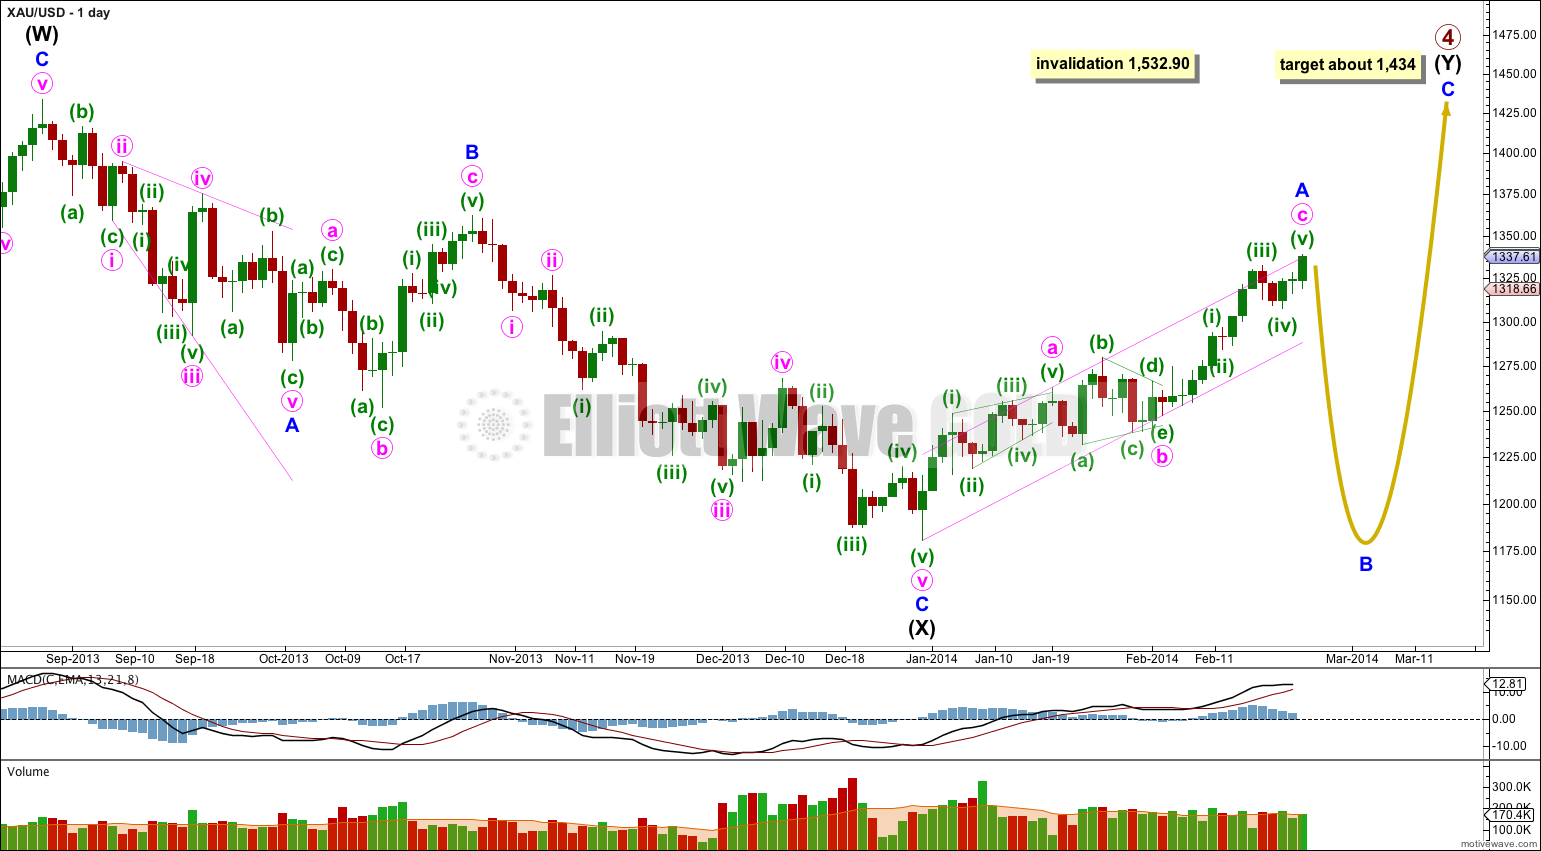
Gold is still within a large fourth wave correction at primary wave degree which is incomplete.
Primary wave 2 was a rare running flat. Primary wave 4 is unlikely to be a flat correction because it is likely to show structural alternation with primary wave 2.
The first upwards wave within primary wave 4 labeled here intermediate wave (W) subdivides as a three wave zigzag. Primary wave 4 cannot be an unfolding zigzag because the first wave within a zigzag, wave A, must subdivide as a five.
Primary wave 4 is unlikely to be completing as a double zigzag because intermediate wave (X) is a deep 99% correction of intermediate wave (W). Double zigzags commonly have shallow X waves because their purpose it to deepen a correction when the first zigzag does not move price deep enough.
Primary wave 4 is most likely to be completing as a double combination: zigzag – X – second structure. The second structure labeled intermediate wave (Y) may be either a flat or a triangle. For both these structures minor wave A must be a three, and is most likely to be a zigzag.
Minor wave A is either a complete zigzag, or it is very close to completion.
Minor wave B downwards must retrace a minimum of 90% the length of minor wave A if intermediate wave (Y) is a flat correction. If intermediate wave (Y) is a triangle then there is no minimum requirement for minor wave B within it.
Minor wave B must subdivide as a corrective structure, and there are more than thirteen possible corrective structures it may take. Within it minute wave a may be either a three or a five, and when it is complete and its structure is clear then we shall have a clearer idea of what structure minor wave B may be. In a few days I will publish alternate hourly wave counts to consider all the different possible structures for minute wave a. For now I am waiting to see the first 5-3-5 down complete.
Primary wave 4 may not move into primary wave 1 price territory. This wave count is invalidated with movement above 1,532.90.
Draw a channel about the zigzag of minor wave A: draw the first trend line from the start of minute wave a to the end of minute wave b, then place a parallel copy upon the end of minute wave a. A clear channel breach of this channel with a full daily candlestick below the lower edge and not touching the lower trend line would provide trend channel confirmation of a trend change at minor degree.
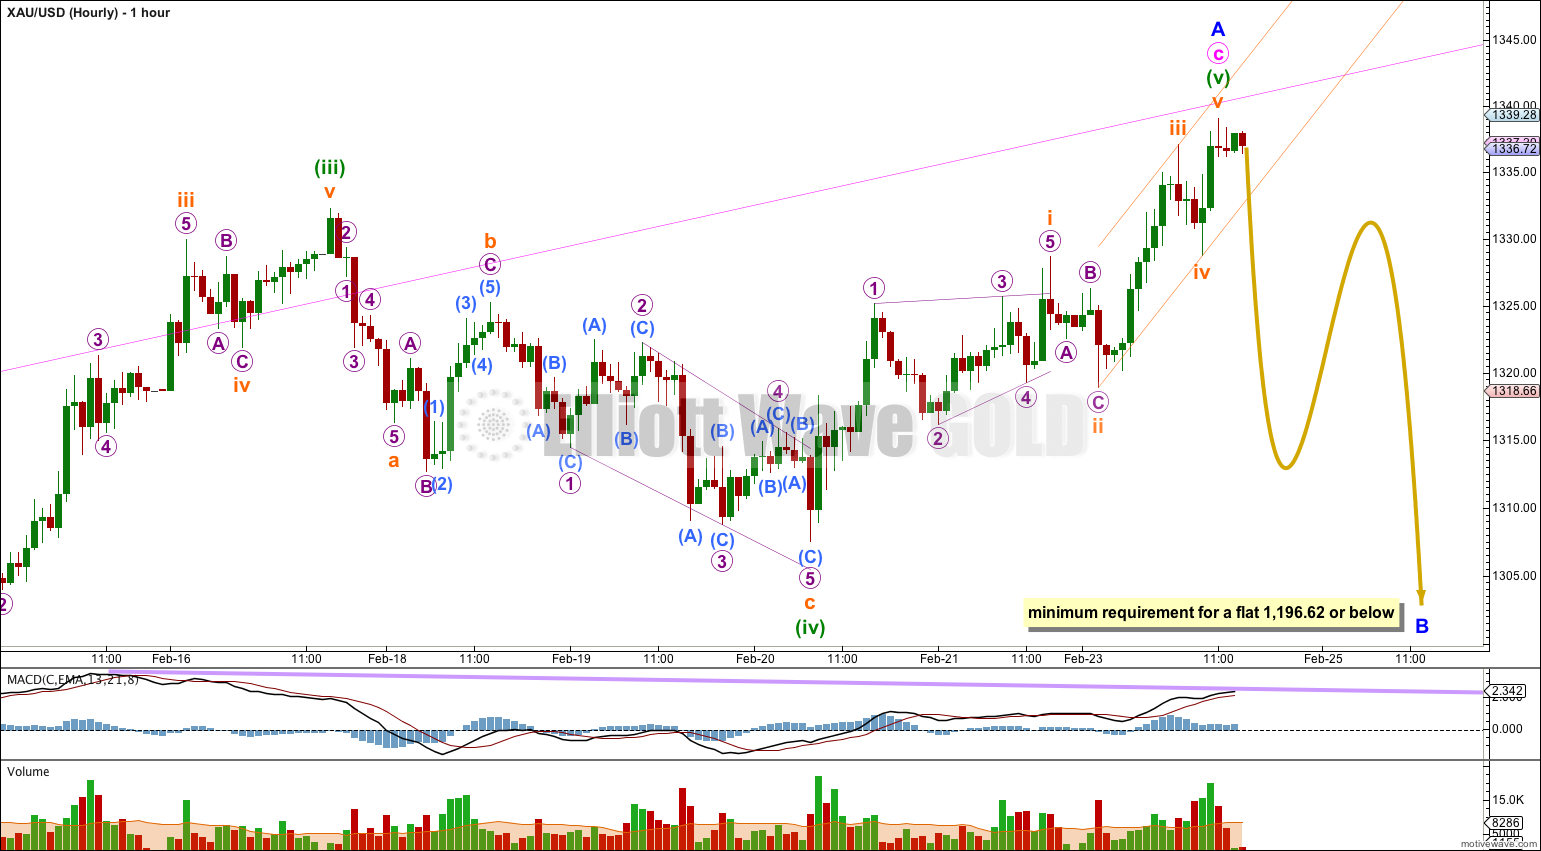
I have adjusted the wave count within minor wave A. This new high does not look like part of minor wave B and it is more likely the fifth wave within minor wave A. This is supported by classic technical divergence between price trending higher and MACD trending lower.
Within minor wave A there is now no Fibonacci ratio between minute waves a and c.
Ratios within minute wave c are: minuette wave (iii) is 1.62 longer than equality with minuette wave (i), and if minuette wave (v) is over here then it is just 1.79 longer than 0.618 the length of minuette wave (iii).
The downwards movement I had seen as a five ending at 1,307.48 may also be seen as a three. This is the most difficult aspect of Elliott wave analysis: sometimes movements are clearly a five or a three, but often movements are ambiguous and can be seen either way. This is the source of my mistake and the reason for the invalidation.
Within minuette wave (v) if the structure is complete here then ratios are: there is no Fibonacci ratio between subminuette waves iii and i, and subminuette wave v is 0.91 short of 0.618 the length of subminuette wave iii. Subminuette wave iii is shorter than subminuette wave i which limits subminuette wave v to no longer than equality in length with subminuette wave iii. This limit is reached at 1,346.91.
Upwards movement may find resistance and end at the upper edge of the pink channel copied over here from the daily chart. This would be a most likely place for minor wave B downwards to begin.
While price remains within the small orange channel about minuette wave (v) there is no confirmation of a trend change at 1,339.06. A clear breach of this channel is required before any indication of a trend change.
Alternate Daily Wave Count – Triangle.
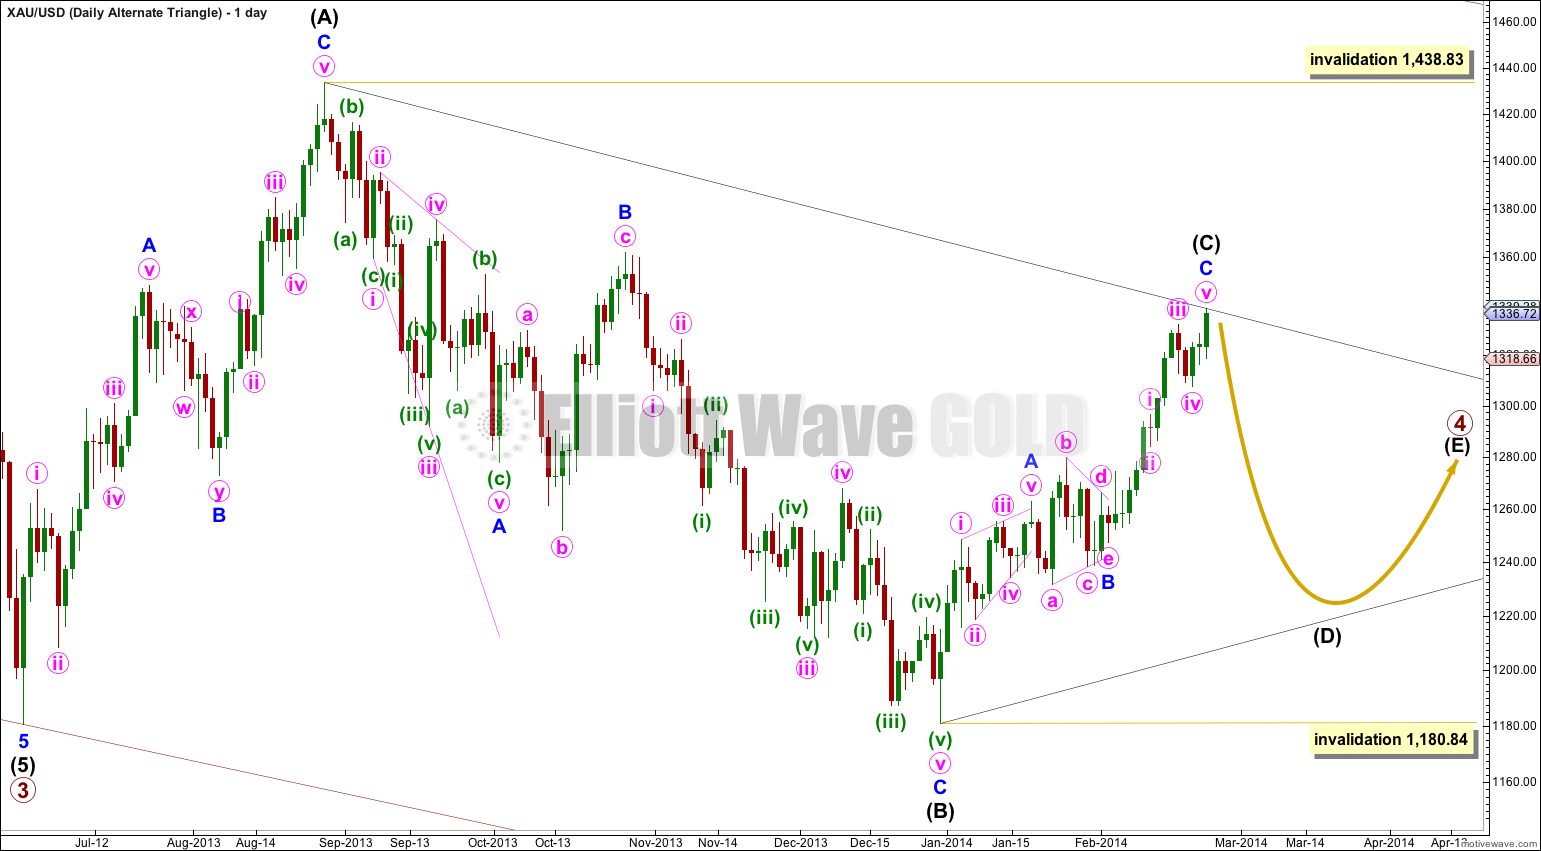
It is also possible that primary wave 4 may continue as a regular contracting (or barrier) triangle.
Intermediate wave (C) is now just over 0.618 the length of intermediate wave (B) at 0.625 the length of intermediate wave (B). This gives the triangle a slightly better look. This wave count has a good probability.
Triangles take up time and move price sideways. If primary wave 4 unfolds as a triangle then I would expect it to last months rather than weeks.