
Downwards movement was expected for both the main and alternate wave counts. I had expected a little more upwards movement to 1,366 first, but this target was not reached.
Summary: The main wave count has increased in probability. If the next candlestick remains below the pink channel on the daily chart I would have full confidence in a trend change to the downside.
This analysis is published about 07:45 p.m. EST. Click on charts to enlarge.
Main Wave Count.

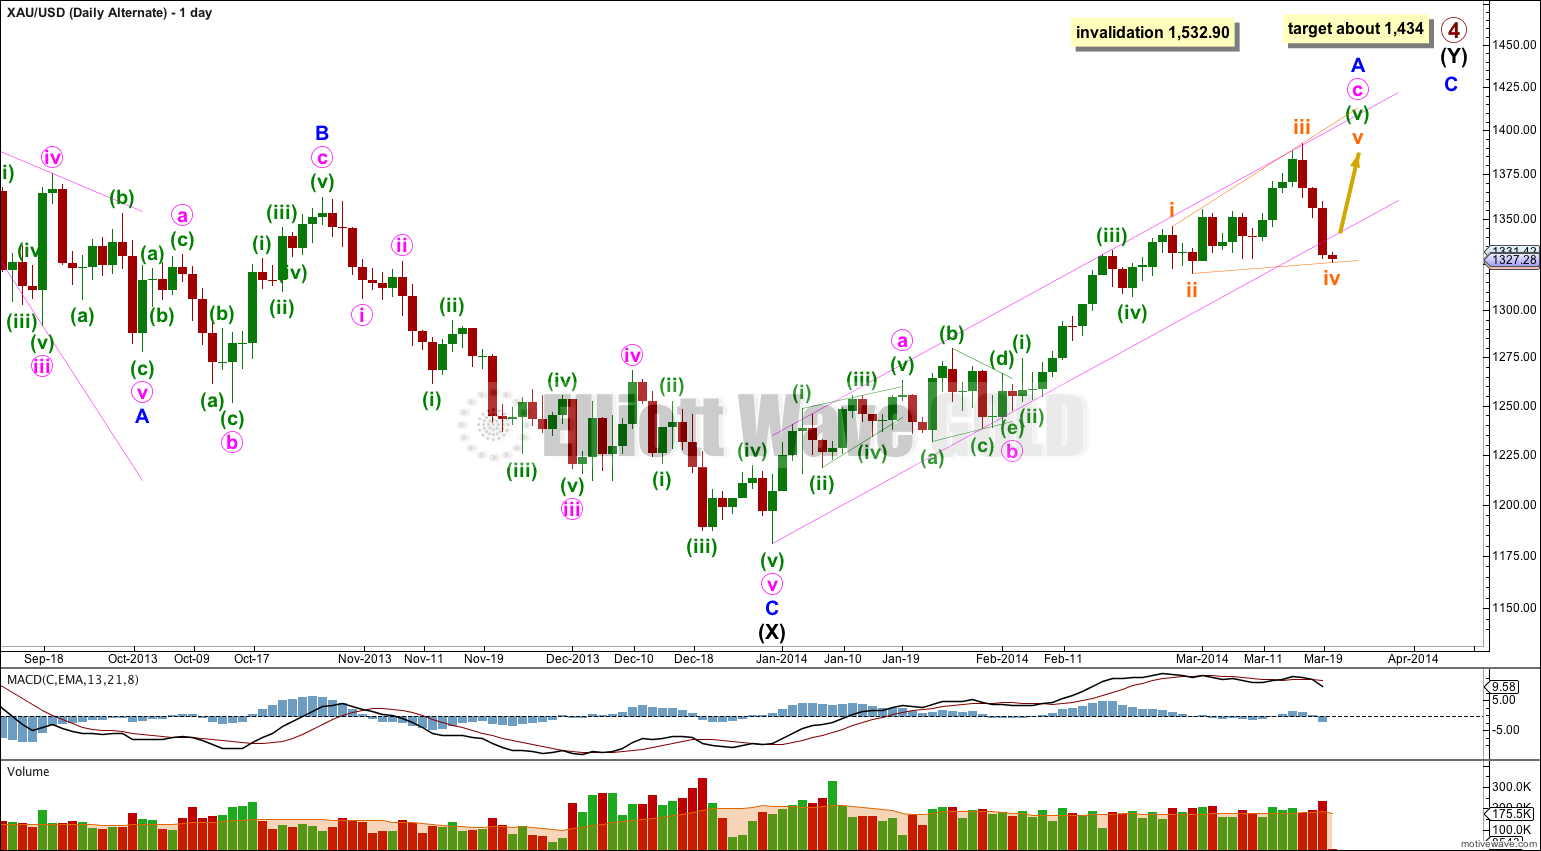
Gold is still within a large fourth wave correction at primary wave degree which is incomplete.
Primary wave 2 was a rare running flat. Primary wave 4 is unlikely to be a flat correction because it is likely to show structural alternation with primary wave 2.
The first upwards wave within primary wave 4 labeled intermediate wave (W) subdivides as a three wave zigzag. Primary wave 4 cannot be an unfolding zigzag because the first wave within a zigzag, wave A, must subdivide as a five.
Primary wave 4 is unlikely to be completing as a double zigzag because intermediate wave (X) is a deep 99% correction of intermediate wave (W). Double zigzags commonly have shallow X waves because their purpose it to deepen a correction when the first zigzag does not move price deep enough.
Primary wave 4 is most likely to be completing as a double combination: zigzag – X – second structure. The second structure labeled intermediate wave (Y) may be either a flat or a triangle. For both these structures minor wave A must be a three.
Minor wave A may be a complete double zigzag. It may have ended at the upper edge of its channel. We need to see this channel breached with a full daily candlestick below the lower pink trend line and not touching it before we may have confidence in a trend change at minor degree. This may happen with just one more day.
Primary wave 4 may not move into primary wave 1 price territory. This wave count is invalidated with movement above 1,532.90.
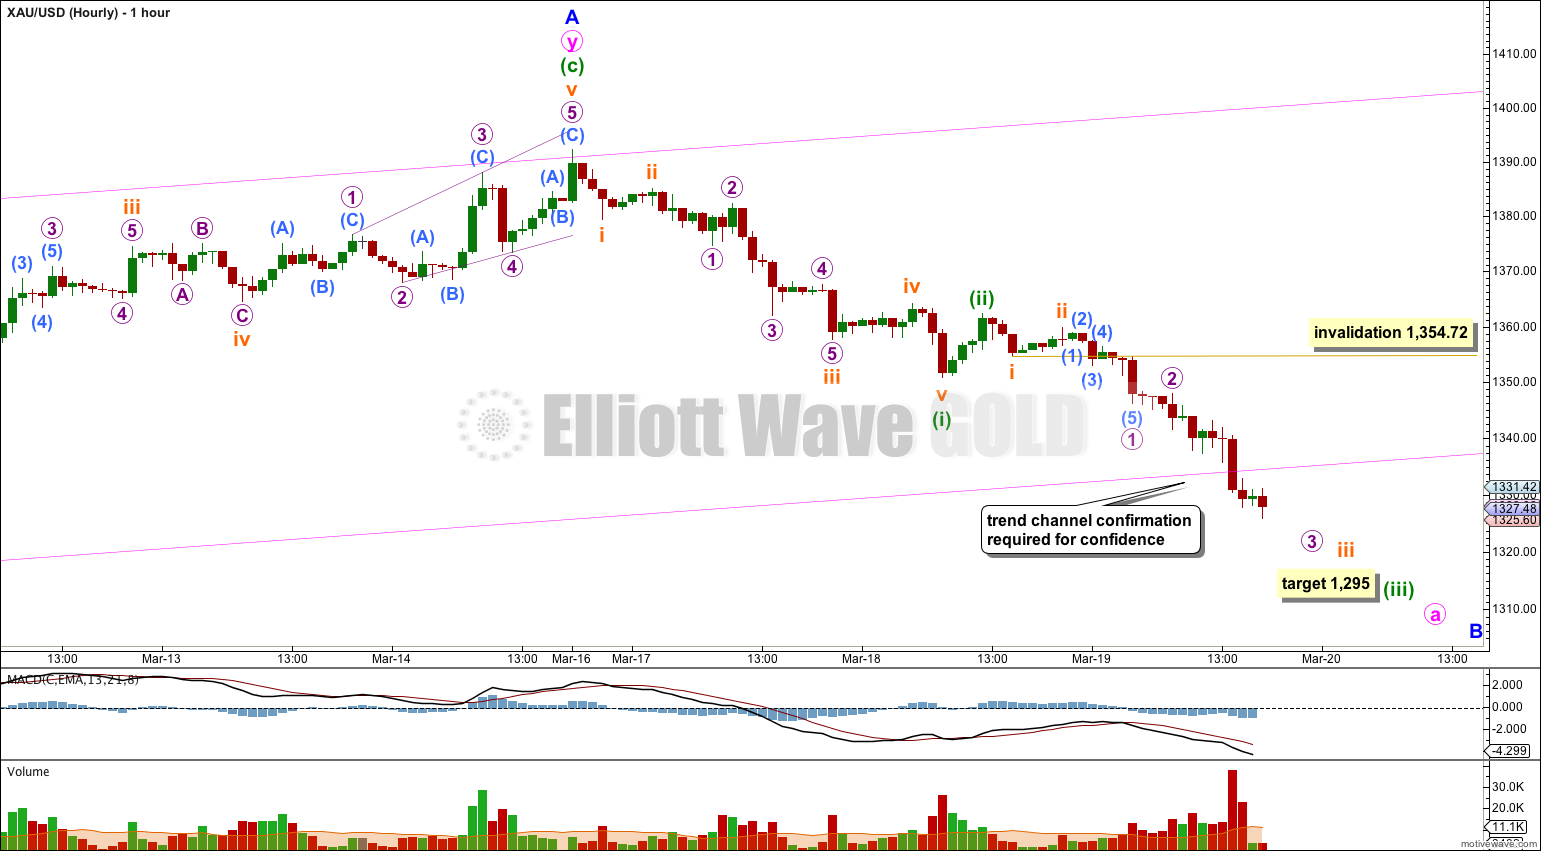
Downwards movement continues and is increasing in momentum. This indicates a third wave is underway, although as the momentum is not a huge increase it may also be a C wave.
If the next daily candlestick remains below the pink channel on the daily chart I would have confidence in a trend change at 1,392.30. At that stage I would use alternate wave counts for the various possible structures for minor wave B. There are more than thirteen possible structures, and within those minute wave a may subdivide as either a motive structure (impulse or diagonal) or a three. Initially alternates would be concerned with the structure of minute wave a.
Within the first 5-3-5 down the third wave (or C wave) would reach 1.618 the length of the first wave (or A wave) at 1,295. This target may be met within one day if this is a third wave down, or two days if it is a C wave down.
Within minuette wave (iii) its upcoming fourth wave correction for subminuette wave iv may not move back into subminuette wave i price territory. This wave count is invalidated with movement above 1,354.72.
Alternate Wave Count.
This alternate idea looks at the possibility that minor wave A is an incomplete single zigzag. This alternate wave count has a low probability for several reasons.
This wave count is the same as the main wave count for the first part of minor wave A with a leading diagonal followed by a triangle, but thereafter if differs.
If minute wave c began at 1,247.40 then within it minuette wave (ii) barely shows on the daily chart as a small green doji, but minuette wave (iv) shows on the daily chart as two clear red candlesticks. In my experience of impulses within Gold the second and fourth wave subdivisions should both be clear on the daily chart.
Minuette wave (v) may be an ending expanding diagonal which is incomplete. Within this diagonal subminuette waves ii and iv show clearly on the daily chart, yet they are one degree lower than minuette wave (ii) which does not show up on the daily chart. This would be highly unusual for Gold and reduces the probability of this wave count.
Furthermore, today subminuette wave iv has breached the lower edge of the wider pink channel. This further reduces the probability of this alternate wave count.
The diagonal would still be incomplete.
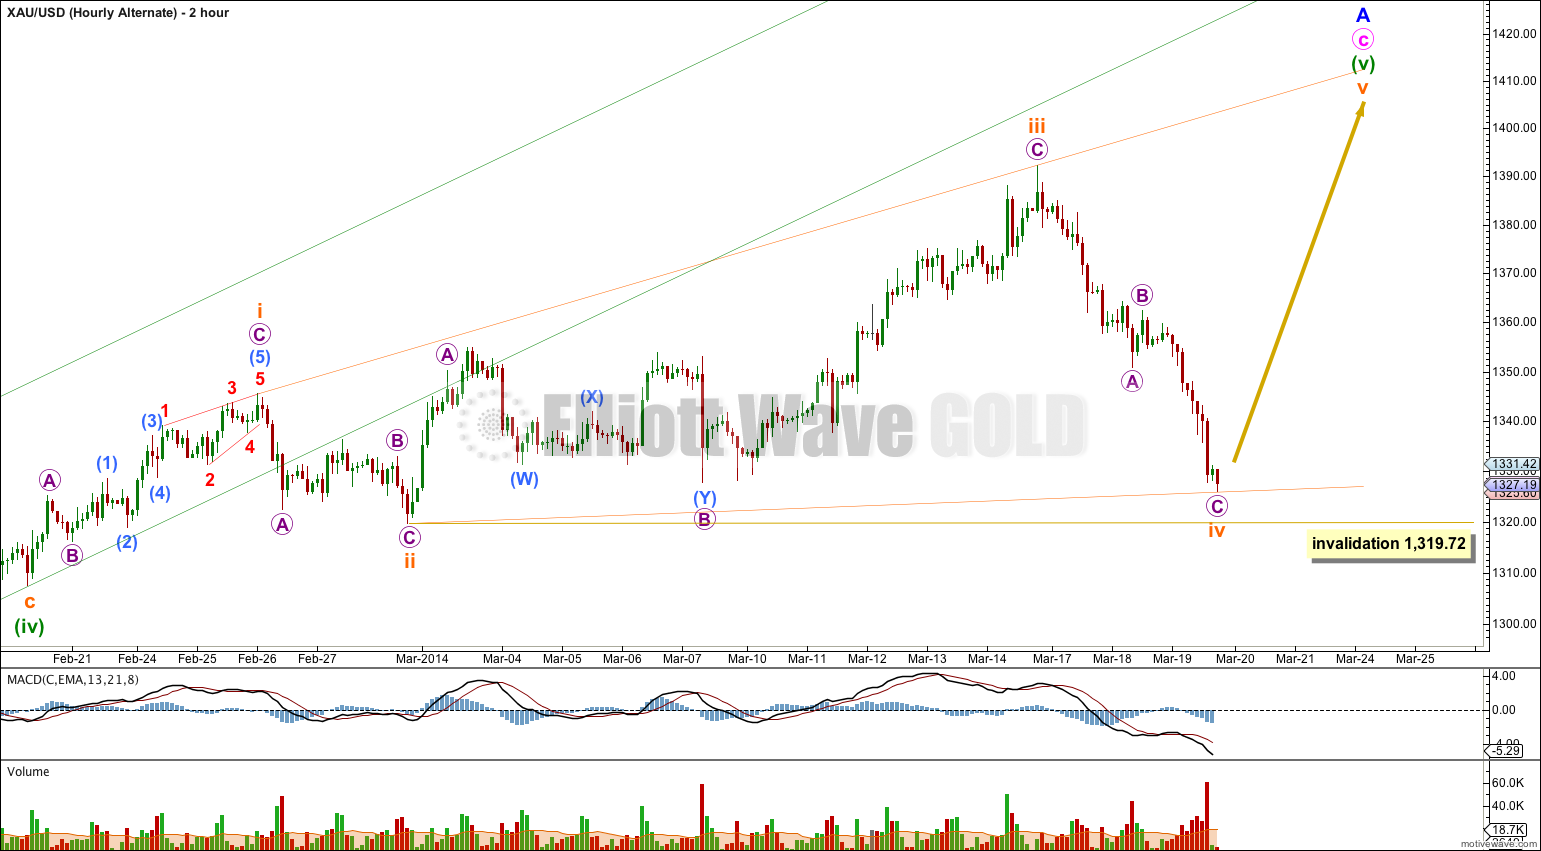
The fifth wave diagonal within minute wave c falls below the green parallel channel draw using Elliott’s technique about minute wave c. This is highly unusual for Gold and further reduces the probability of this wave count.
Within diagonals the second and fourth waves normally correct to between 66% to 81% of the first and third waves. Here subminuette wave ii is a 70% correction of subminuette wave i, nicely within the normal range. Subminuettte wave iv is now a 91% correction of subminuette wave iii which is outside normal range and so further reduces the probability of this wave count.
Within diagonals subwaves ii and iv should have about even momentum. In this instance downwards momentum for subminuette wave iv is significantly stronger than it was for subminuette wave ii. In my opinion this is enough to now discard this wave count as its probability is now low. I expect it will be invalidated within the next several hours.
Subminuette wave iv may not move beyond the end of subminuette wave ii. This wave count is invalidated with movement below 1,319.72.
Alternate Daily Wave Count – Triangle.
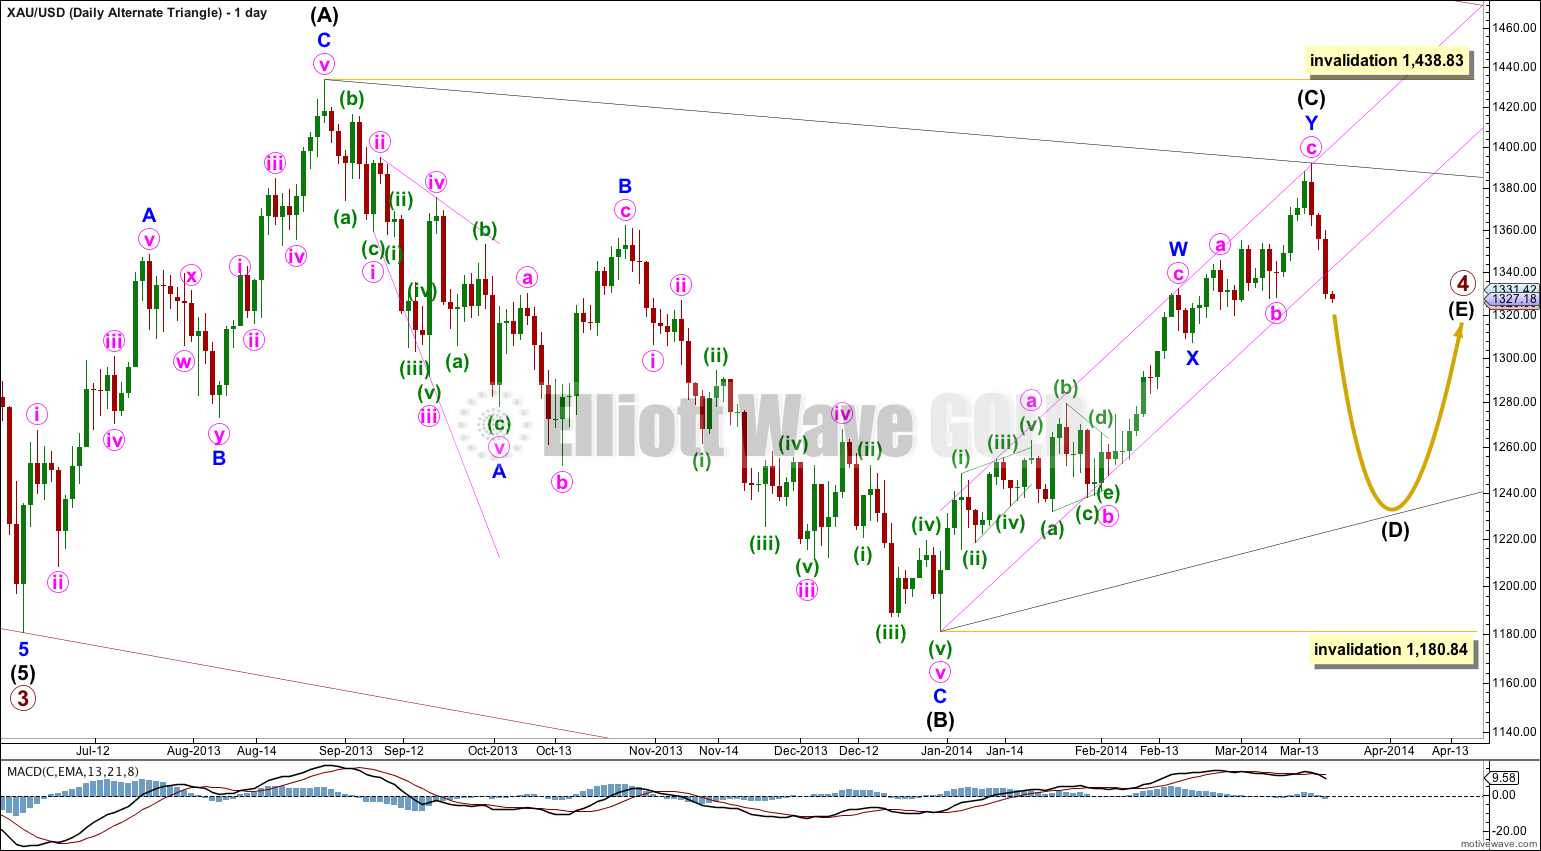
It is also possible that primary wave 4 may continue as a regular contracting (or barrier) triangle. With MACD moving reasonably close to the zero line on the daily chart this triangle looks typical. This wave count has an even probability with the main wave count.
This wave count has a good probability. It does not diverge from the main wave count and it will not diverge for several weeks yet.
Triangles take up time and move price sideways. If primary wave 4 unfolds as a triangle then I would expect it to last months rather than weeks.