
As expected upwards movement found resistance at the pink trend line on the daily chart. Downwards movement continues towards the target.
We now have a clear breach of the pink channel on the daily chart providing final confirmation of a trend change at minor degree.
Summary: Downwards movement should continue for another two or three days. There will be corrections along the way. The target remains at 1,270.
This analysis is published about 04:50 p.m. EST. Click on charts to enlarge.
Main Wave Count.
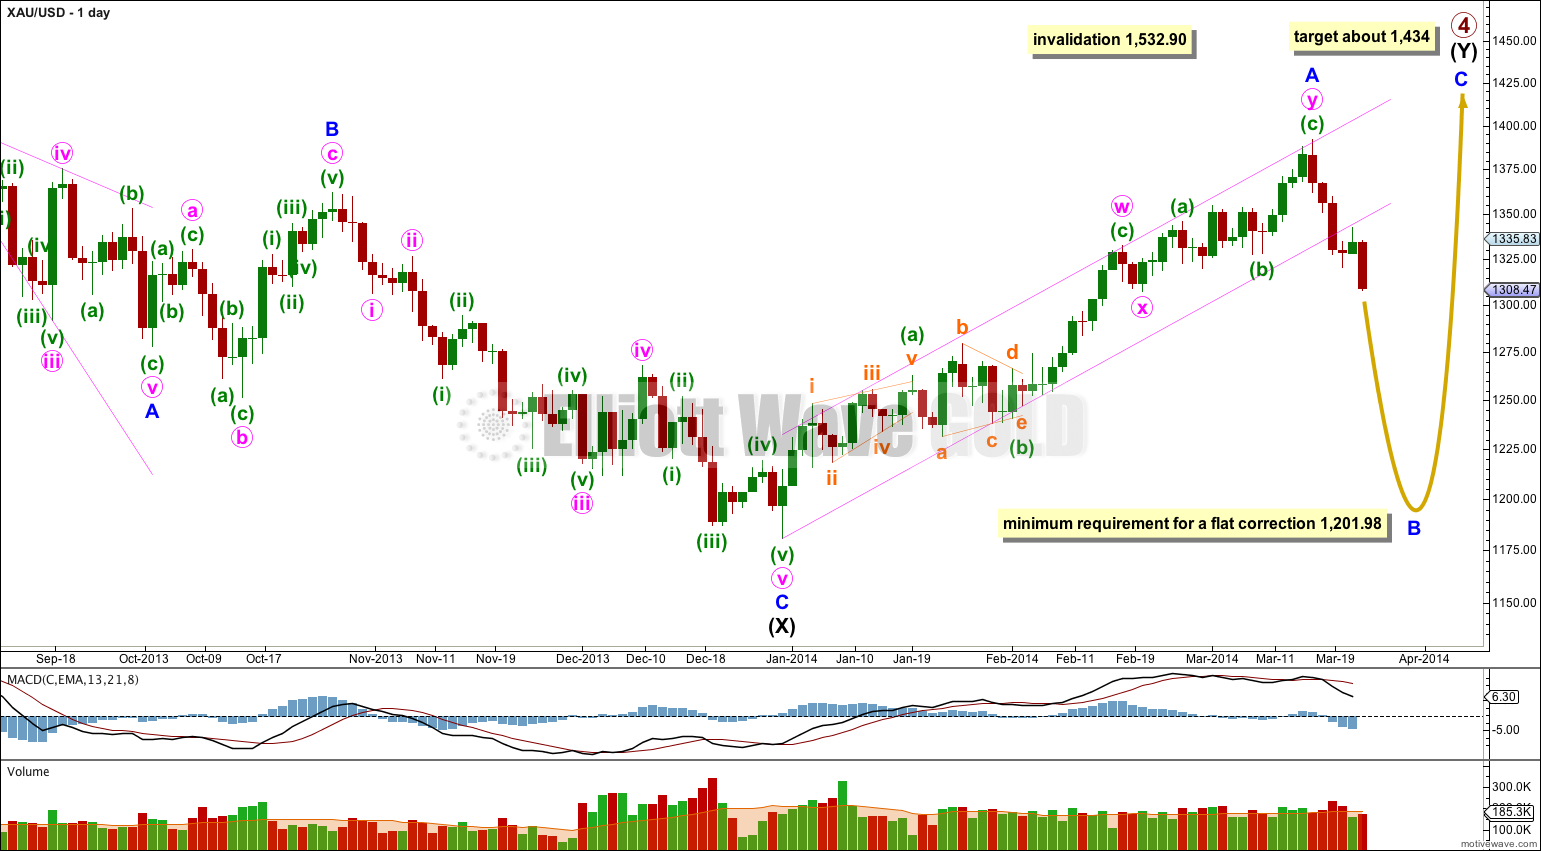
Gold is still within a large fourth wave correction at primary wave degree which is incomplete.
Primary wave 2 was a rare running flat. Primary wave 4 is unlikely to be a flat correction because it is likely to show structural alternation with primary wave 2.
The first upwards wave within primary wave 4 labeled intermediate wave (W) subdivides as a three wave zigzag. Primary wave 4 cannot be an unfolding zigzag because the first wave within a zigzag, wave A, must subdivide as a five.
Primary wave 4 is unlikely to be completing as a double zigzag because intermediate wave (X) is a deep 99% correction of intermediate wave (W). Double zigzags commonly have shallow X waves because their purpose it to deepen a correction when the first zigzag does not move price deep enough.
Primary wave 4 is most likely to be completing as a double combination: zigzag – X – second structure. The second structure labeled intermediate wave (Y) may be either a flat or a triangle. For both these structures minor wave A must be a three.
Primary wave 4 may not move into primary wave 1 price territory. This wave count is invalidated with movement above 1,532.90.
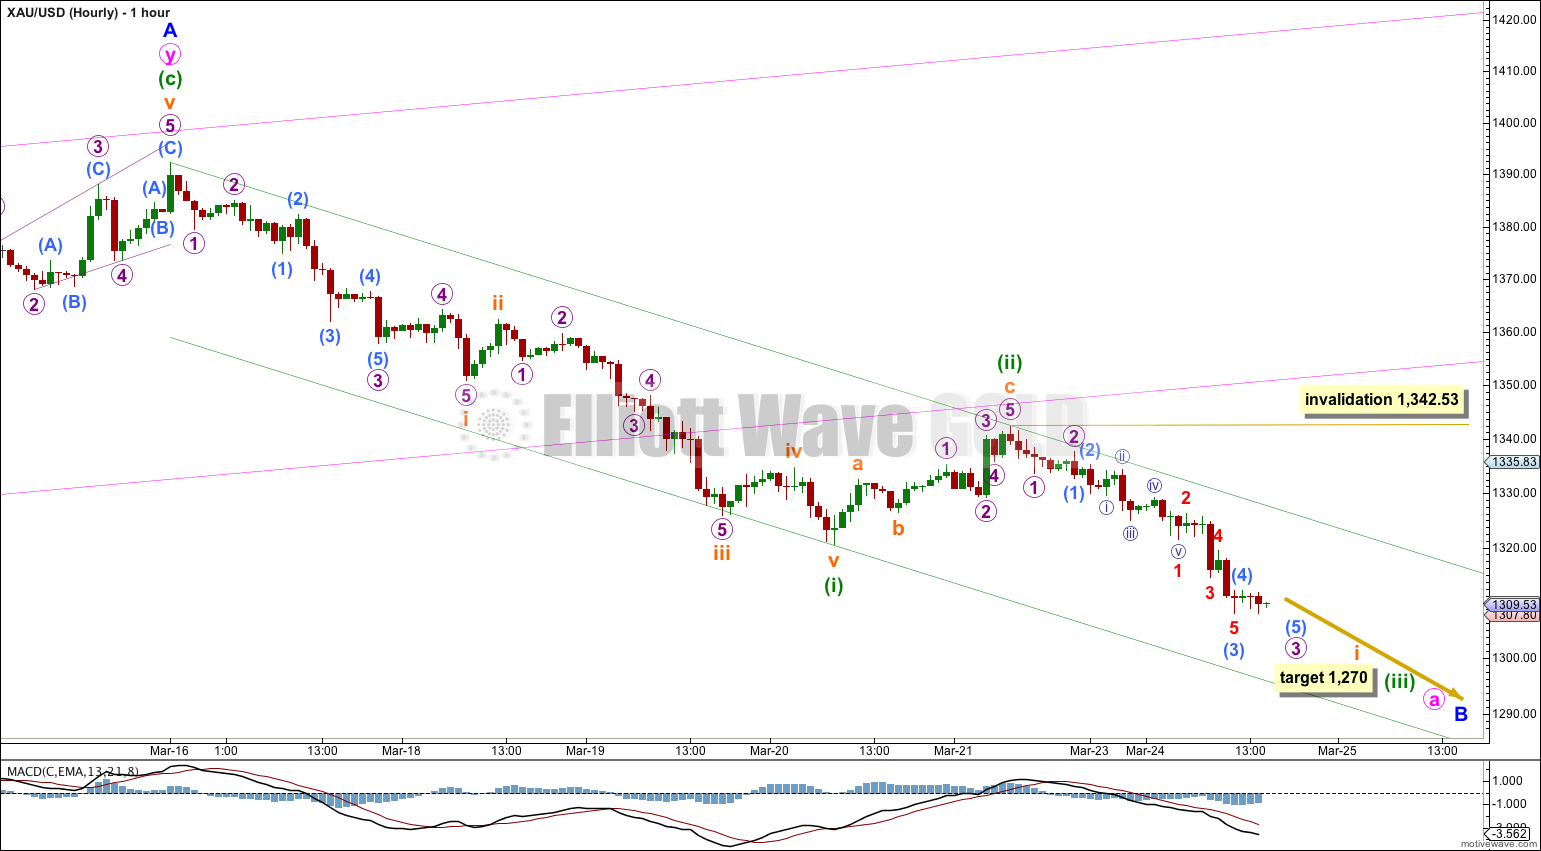
There are more than thirteen possible corrective structures that minor wave B may take. It is most likely to be a zigzag. Within a zigzag minute wave a must subdivide as a five wave motive structure, either a leading diagonal or an impulse. This downwards movement so far is clearly not a diagonal and it may be an impulse.
This main hourly wave count follows the most likely structure of a zigzag for minor wave B.
At 1,270 minuette wave (iii) would reach equality with minuette wave (i). This target may be met in another two to three days. Minuette wave (iii) down should show a clear and strong increase in downwards momentum when it passes the middle strongest part, which may come tomorrow.
Within minuette wave (iii) so far subminuette wave i is incomplete. It should complete within a few hours and be followed by an upwards correction for subminuette wave ii.
The channel drawn about downwards movement is a base channel around minuette waves (i) and (ii). Minuette wave (iii) should clearly and strongly breach the lower edge of this channel. Corrections along the way should find resistance at the upper edge of the channel.
Subminuette wave ii may not move beyond the start of subminuette wave i. This wave count is invalidated with movement above 1,342.53.
Alternate Hourly Wave Count.
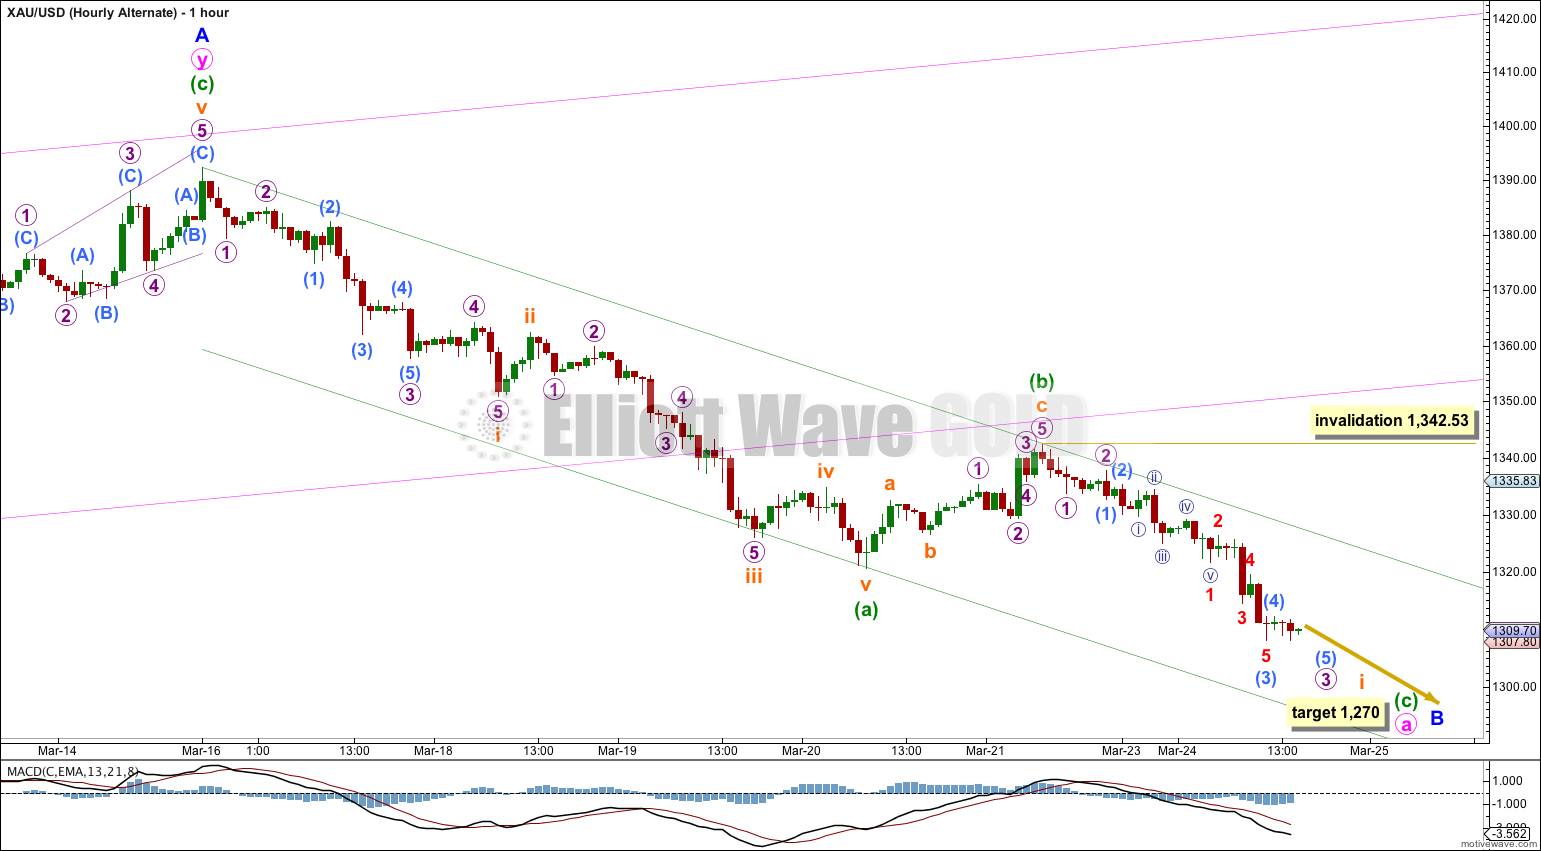
If minor wave B is a flat (or a combination with a flat as the first structure) then minute wave a within it must subdivide as a three. Minute wave a for this alternate is seen as an incomplete zigzag.
A-B-C of a zigzag and 1-2-3 of an unfolding impulse subdivide in exactly the same way. It is impossible to tell the difference, unless downwards momentum of the next wave does not show a clear and strong increase. But C waves often do show stronger momentum than A waves.
This wave count does not diverge from the main wave count and will not diverge for a few days yet.
The channel drawn here is termed a corrective channel when it is drawn about a correction. Minuette wave (c) may end at the lower edge, although sometimes C waves overshoot these channels. Corrections along the way should find resistance at the upper edge of the channel.
Within minuette wave (c) subminuette wave ii may not move beyond the start of subminuette wave i. This wave count is invalidated with movement above 1,342.53.
Alternate Daily Wave Count – Triangle.
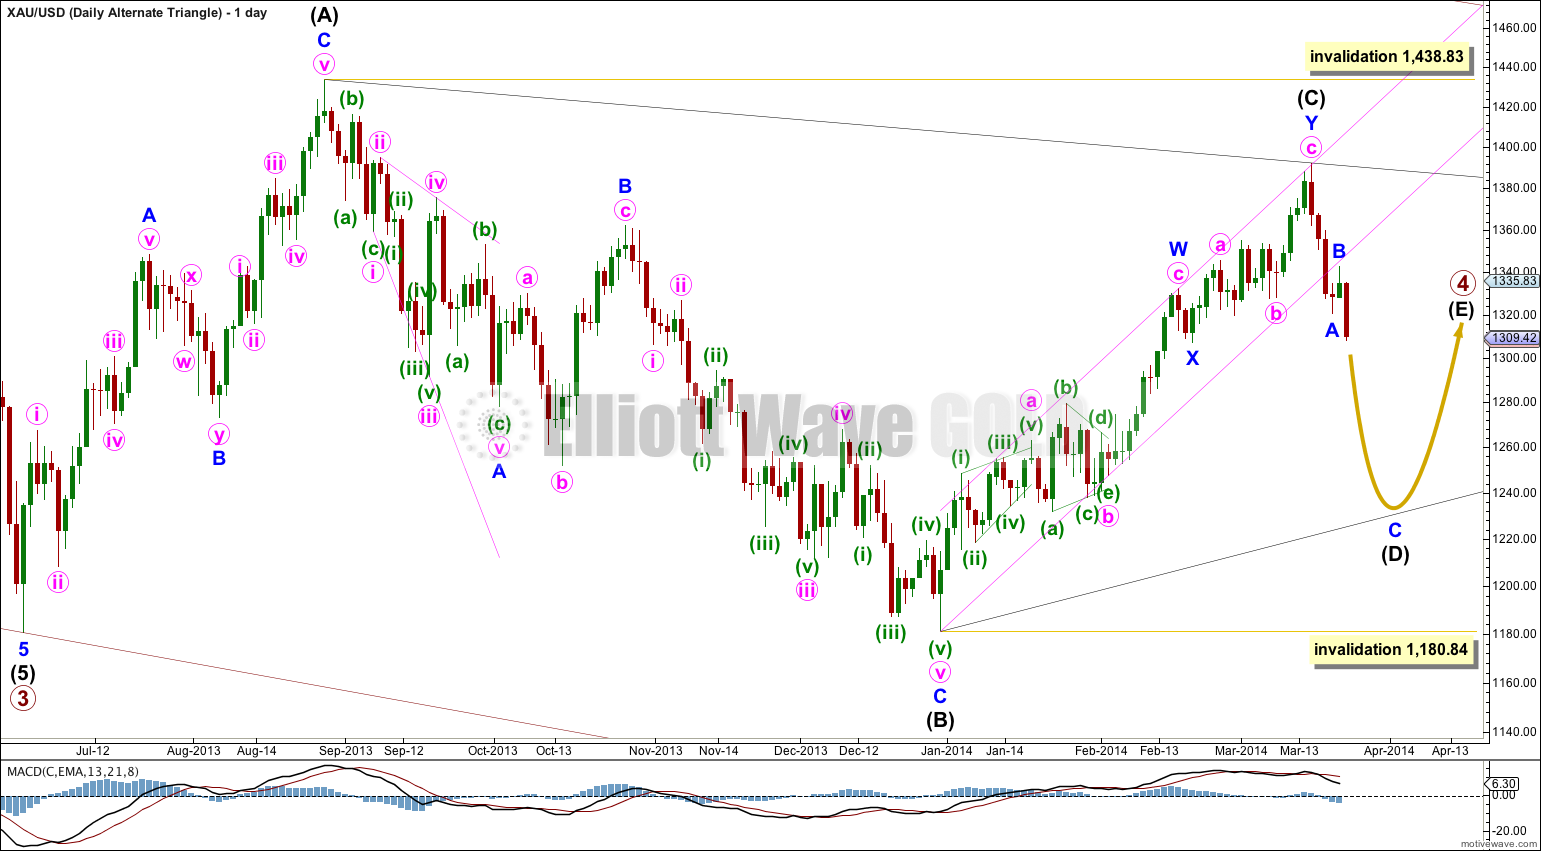
It is also possible that primary wave 4 may continue as a regular contracting (or barrier) triangle. With MACD moving reasonably close to the zero line on the daily chart this triangle looks typical. At this stage the subdivisions within primary wave 4 do not indicate whether it is a triangle or combination, both are possible. A triangle is less likely only because it is not as common a structure as a double combination.
This wave count has a good probability. It does not diverge from the main wave count and it will not diverge for several weeks yet.
Triangles take up time and move price sideways. If primary wave 4 unfolds as a triangle then I would expect it to last months rather than weeks.