
Downwards movement continues as expected, but we have not yet seen the increase in momentum I had expected.
Summary: A third wave down has still most likely begun. The target for it to end is 1,247 and this may be reached in six more days.
This analysis is published about 06:35 p.m. EST. Click on charts to enlarge.
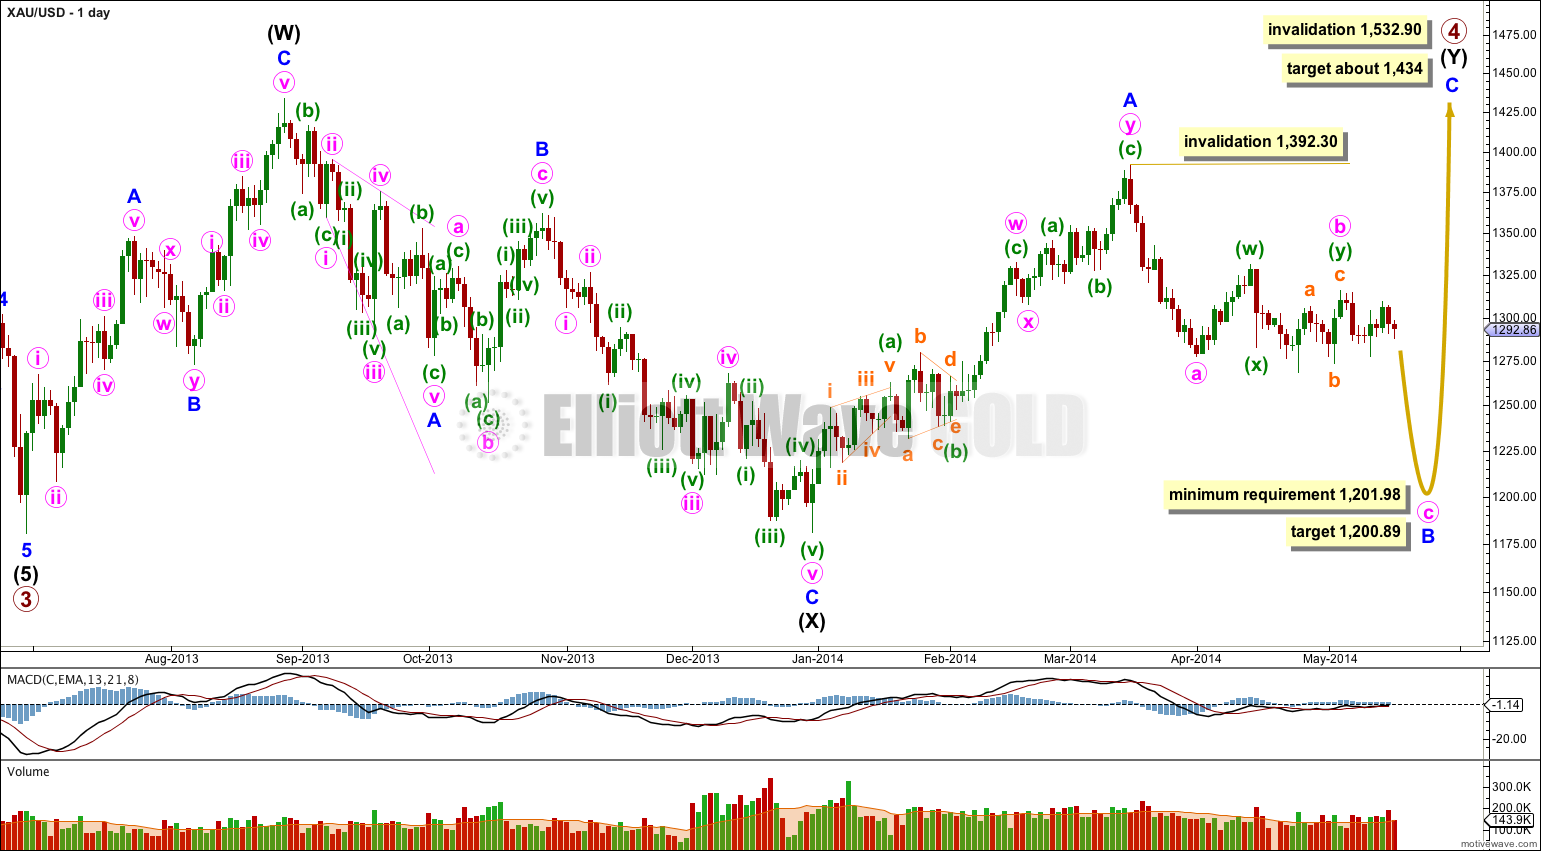
Gold is still within a large fourth wave correction at primary wave degree which is incomplete.
Primary wave 2 was a rare running flat. Primary wave 4 is unlikely to be a flat correction because it is likely to show structural alternation with primary wave 2.
Primary wave 4 is most likely to be completing as a double combination: zigzag – X – second structure. The second structure labeled intermediate wave (Y) is most likely to be a flat correction. Within the flat correction minor wave B must reach a minimum 90% the length of minor wave A at 1,201.98.
If downwards movement does not reach 1,201.98 or below then intermediate wave (Y) may not be a flat correction and may be a contracting triangle. I will keep this alternate possibility in mind as this next wave down unfolds. If it looks like a triangle may be forming I will again chart that possibility for you.
Overall the structure for primary wave 4 should take up time and move price sideways, and the second structure should end about the same level as the first at 1,434. Primary wave 4 may not move into primary wave 1 price territory. This wave count is invalidated with movement above 1,532.90.
Within intermediate wave (Y) minor wave B downwards is an incomplete corrective structure, and at this stage the structure may be either a single zigzag (as labeled here) or a double zigzag (relabel A-B-C to W-X-Y). While this next wave unfolds I will have to consider two structural possibilities: it may be an impulse for a C wave, or it may be a zigzag for a Y wave.
If minor wave B is a single zigzag then within it minute wave b may not move beyond the start of minute wave a above 1,392.30. Minute wave c would reach equality in length with minute wave a at 1,200.89.
If minor wave B is a double zigzag, relabeled minute w-x-y, then within it there is no invalidation point for minute wave x. But X waves within double zigzags are usually relatively brief and shallow, as they very rarely make new price extremes beyond the start of the first zigzag in the double.
Main Hourly Wave Count.
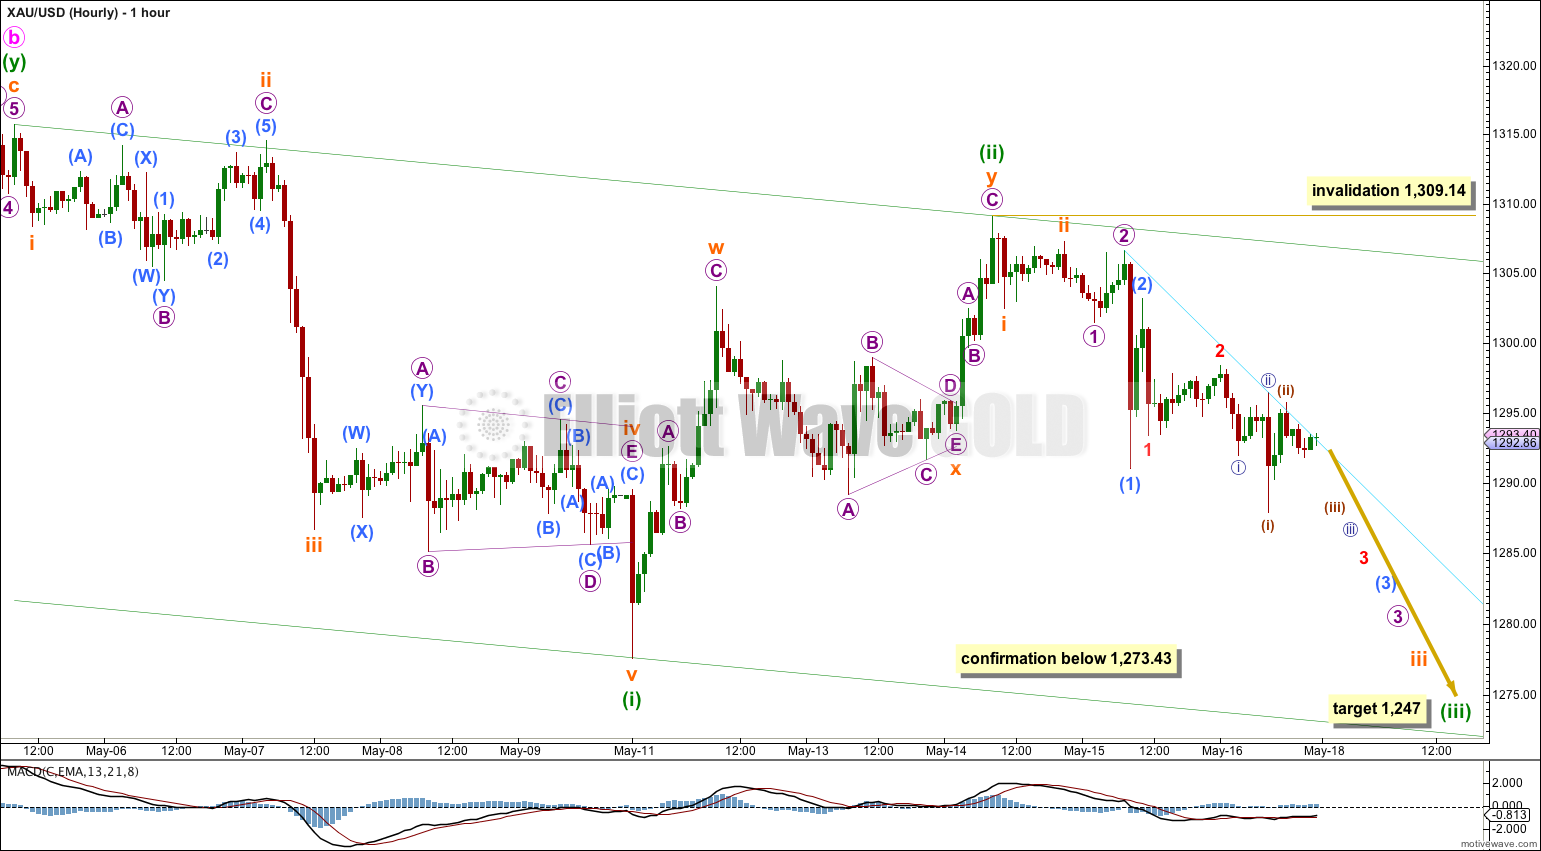
Friday’s price action could be another series of small first and second wave corrections down, to make a total of six so far.
This is actually very common to see when third waves extend; they necessarily begin with a series of first and second waves which can be quite long, with flat momentum. When this happens the waiting and choppy price action may convince us that a third wave will not show up, right before it does.
The expected direction for Monday is downwards. This main wave count would expect no more upwards movement first, and price could simply “fall off a cliff”, showing a strong acceleration of downwards momentum.
The channel drawn here is a base channel about minuette waves (i) and (ii). On the way down upwards corrections should find resistance at the upper edge of the channel, and downwards movement should break through support at the lower edge and then remain below the channel.
The light aqua blue trend line is a tentative trend line for this series of second wave corrections and may continue to provide resistance. It is rather steep and has only been tested three times in quick succession.
At 1,247 minuette wave (iii) would reach 1.618 the length of minuette wave (i).
Within minuette wave (iii) no second wave correction may move beyond the start of its first wave above 1,309.14.
Eventually price movement below 1,273.43 would provide final confirmation that Gold has broken out of its sideways trading range.
Alternate Hourly Wave Count.
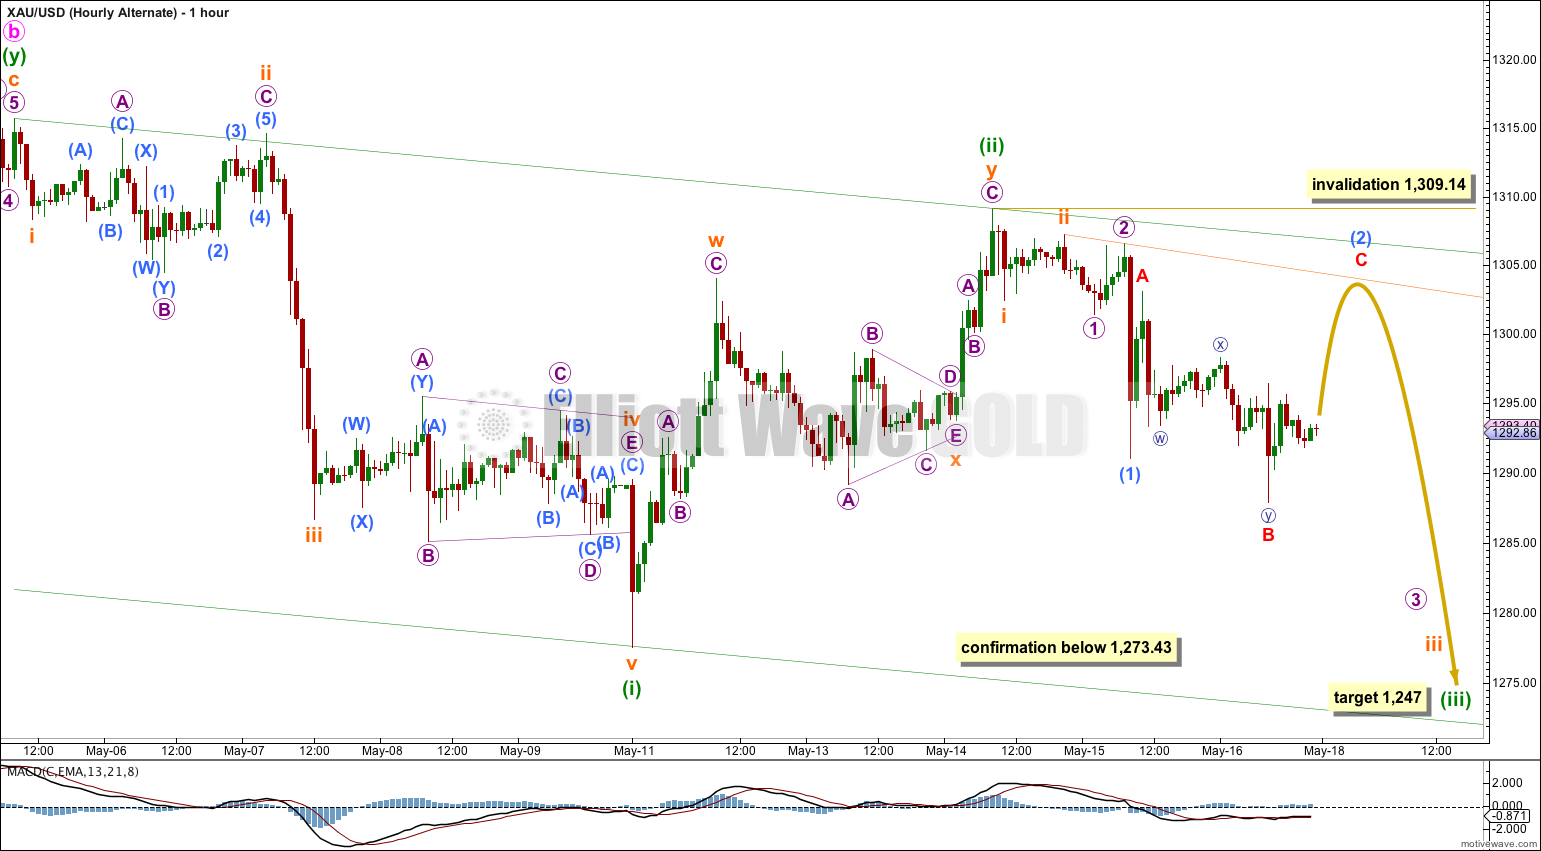
In trying to see all possibilities for Monday I will consider Friday’s price movement as part of a smaller second wave correction. I would expect this correction for submicro wave (2) to find strong resistance at the orange trend line joining micro wave 2 and subminuette wave ii; second wave corrections rarely breach such trend lines.
If this alternate is correct then Monday should still show as a red candlestick. Submicro wave (2) should not show up on the daily chart, and should be over well within that time frame.
When submicro wave (2) is complete then I would expect to see a strong increase in downwards momentum.