
Finally we have the breakout we were expecting, and as expected it is to the downside. Movement below the lower triangle trend line and below 1,283.43 has confirmed this.
Summary: The short term target is 1,256 for the first five down to end. Once this is complete I will expect a second wave correction, which could be deep and may show up on the daily chart as a green candlestick. The mid term target for downwards movement to end is 1,178 which may be met in ten days.
This analysis is published about 06:03 p.m. EST. Click on charts to enlarge.
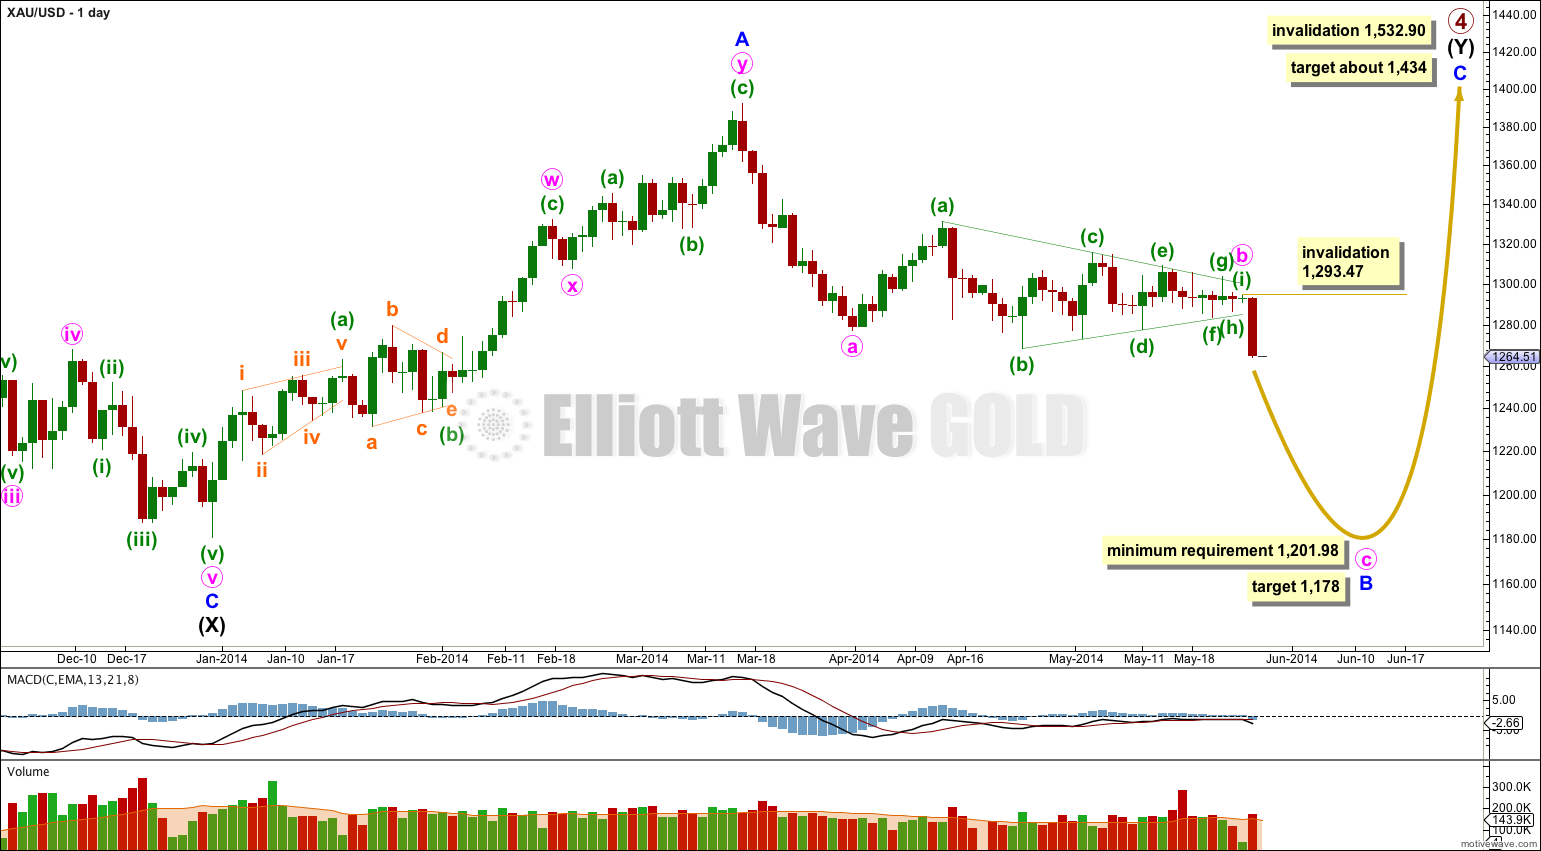
Gold is still within a large fourth wave correction at primary wave degree which is incomplete.
Primary wave 2 was a rare running flat. Primary wave 4 is unlikely to be a flat correction because it is likely to show structural alternation with primary wave 2.
Primary wave 4 is most likely to be completing as a double combination: zigzag – X – second structure. The second structure labeled intermediate wave (Y) is most likely to be a flat correction. Within the flat correction minor wave B must reach a minimum 90% the length of minor wave A at 1,201.98.
If downwards movement does not reach 1,201.98 or below then intermediate wave (Y) may not be a flat correction and may be a contracting triangle. I will keep this alternate possibility in mind as this next wave down unfolds. If it looks like a triangle may be forming I will again chart that possibility for you.
It remains possible that primary wave 4 in its entirety is a huge contracting triangle. If 1,201.98 is not met I would also consider this possibility.
Overall the structure for primary wave 4 should take up time and move price sideways, and the second structure should end about the same level as the first at 1,434. Primary wave 4 may not move into primary wave 1 price territory. This wave count is invalidated with movement above 1,532.90.
Within intermediate wave (Y) minor wave B downwards is an incomplete corrective structure, and at this stage the structure is most likely to be a single zigzag with a triangle for minute wave b which is now complete. At 1,178 minute wave c would reach equality in length with minute wave a. This would see minor wave B 101% the length of minor wave A and so intermediate wave (Y) would be a regular flat correction.
Within minute wave c no second wave correction may move beyond the start of its first wave above 1,293.47. If minute wave c reaches equality in duration with minute wave a it will end in another ten days.
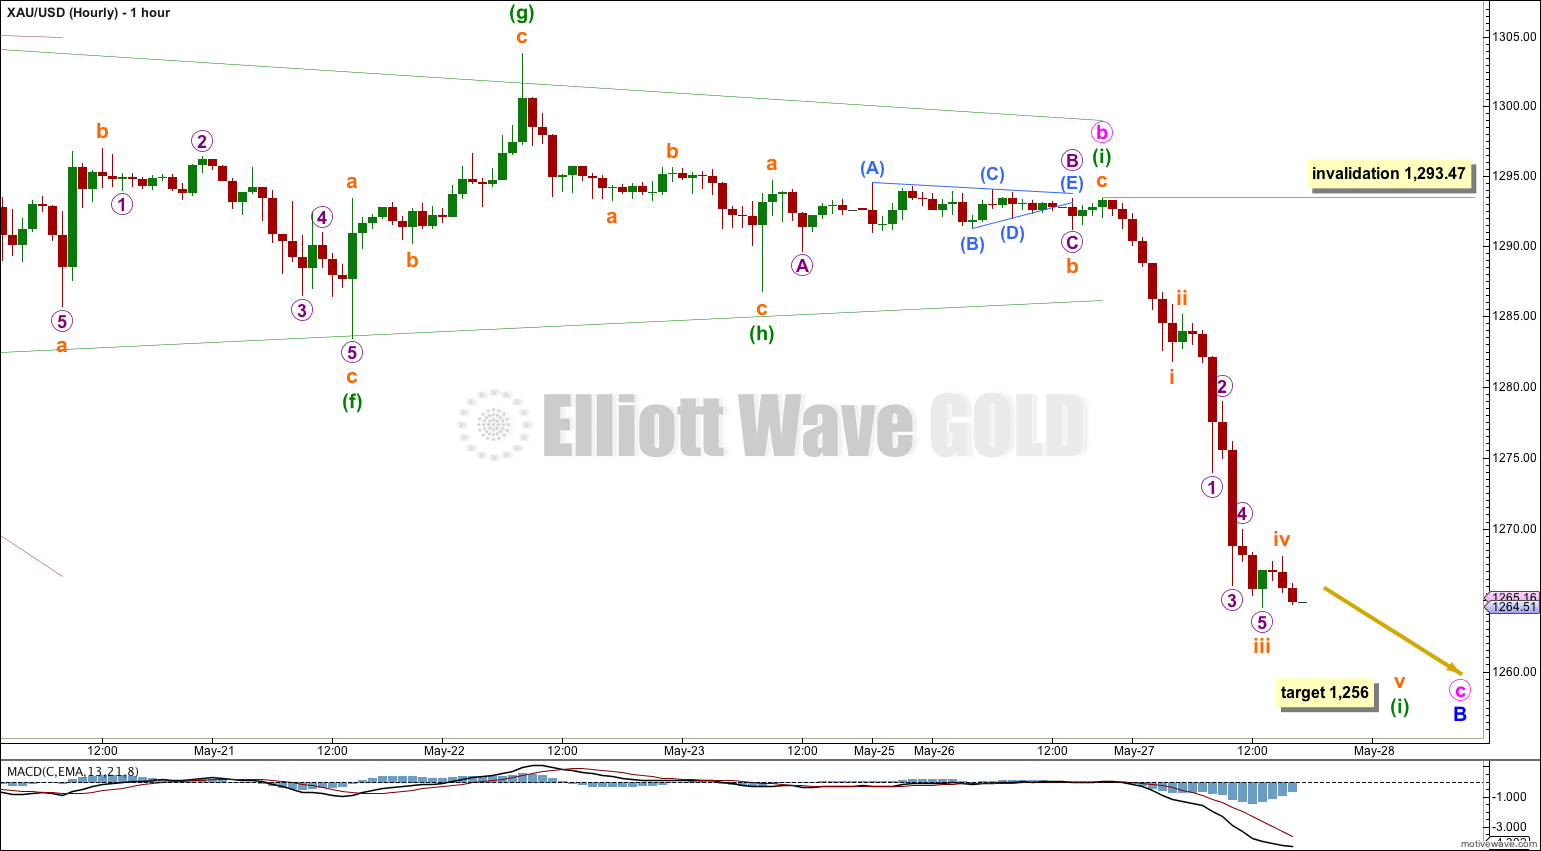
So far to the downside there is not yet a completed five wave structure; only waves 1 through to 4 are complete. Subminuette wave iii is 0.50 longer than 1.618 the length of subminuette wave i. At 1,256 subminuette wave v would reach equality in length with subminuette wave i.
Within subminuette wave iii there are no adequate Fibonacci ratios between micro waves 1, 3 and 5.
When minuette wave (i) is a completed five wave structure then I would expect to see a correction for minuette wave (ii). I would expect to see minuette wave (ii) show up on the daily chart as at least one green candlestick, and maybe two or three. It could be deep, as second wave corrections often are.
Minuette wave (ii) may not move beyond the start of minuette wave (i) above 1,293.47.