Downwards movement continues as expected. This strong red candlestick for Wednesday gives me more confidence the main wave count is correct.
When price breaks below 1,273.43 I will have full confidence in this wave count and the target.
Summary: The target for downwards movement to end is at 1,200.89. This target may be about nine days away. In the short term I expect to see some sideways movement for a correction which may last up to one day.
This analysis is published about 05:25 p.m. EST. Click on charts to enlarge.
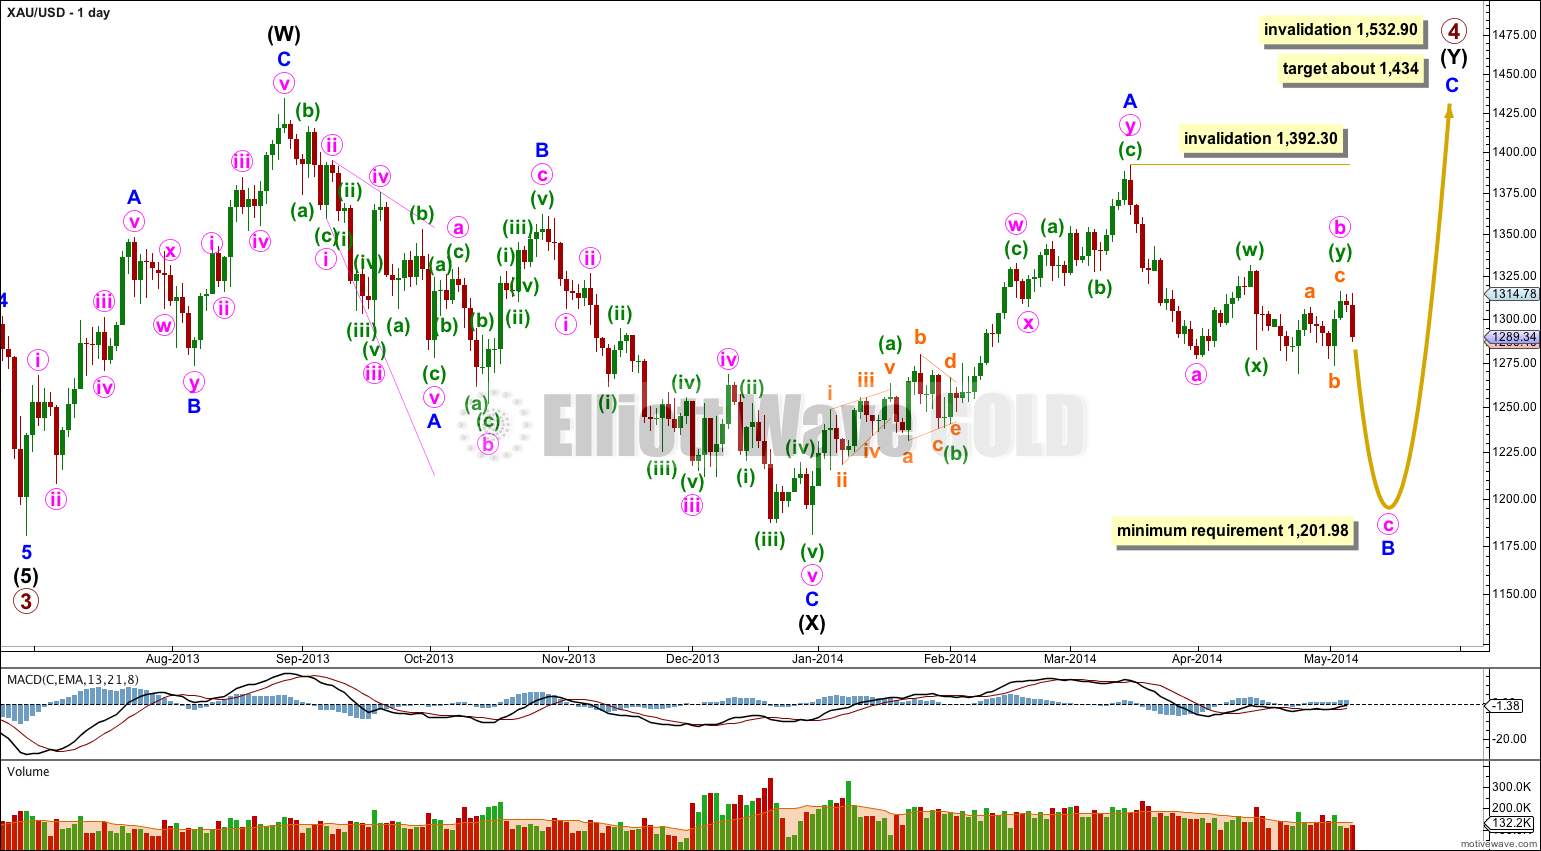
Gold is still within a large fourth wave correction at primary wave degree which is incomplete.
Primary wave 2 was a rare running flat. Primary wave 4 is unlikely to be a flat correction because it is likely to show structural alternation with primary wave 2.
Primary wave 4 is most likely to be completing as a double combination: zigzag – X – second structure. The second structure labeled intermediate wave (Y) is most likely to be a flat correction. Within the flat correction minor wave B must reach a minimum 90% the length of minor wave A at 1,201.98.
Overall the structure for primary wave 4 should take up time and move price sideways, and the second structure should end about the same level as the first at 1,434. Primary wave 4 may not move into primary wave 1 price territory. This wave count is invalidated with movement above 1,532.90.
Within intermediate wave (Y) minor wave B downwards is an incomplete corrective structure, and at this stage the structure may be either a single zigzag (as labeled here) or a double zigzag (relabel A-B-C to W-X-Y). When minute wave b is finally confirmed as complete then I will have two hourly wave counts for the two possibilities of the next downwards wave: either an impulse for a C wave or a zigzag for a Y wave.
If minor wave B is a single zigzag then within it minute wave b may not move beyond the start of minute wave a above 1,392.30.
If minor wave B is a double zigzag, relabeled minute w-x-y, then within it there is no invalidation point for minute wave x. But X waves within double zigzags are usually relatively brief and shallow, as they very rarely make new price extremes beyond the start of the first zigzag in the double.
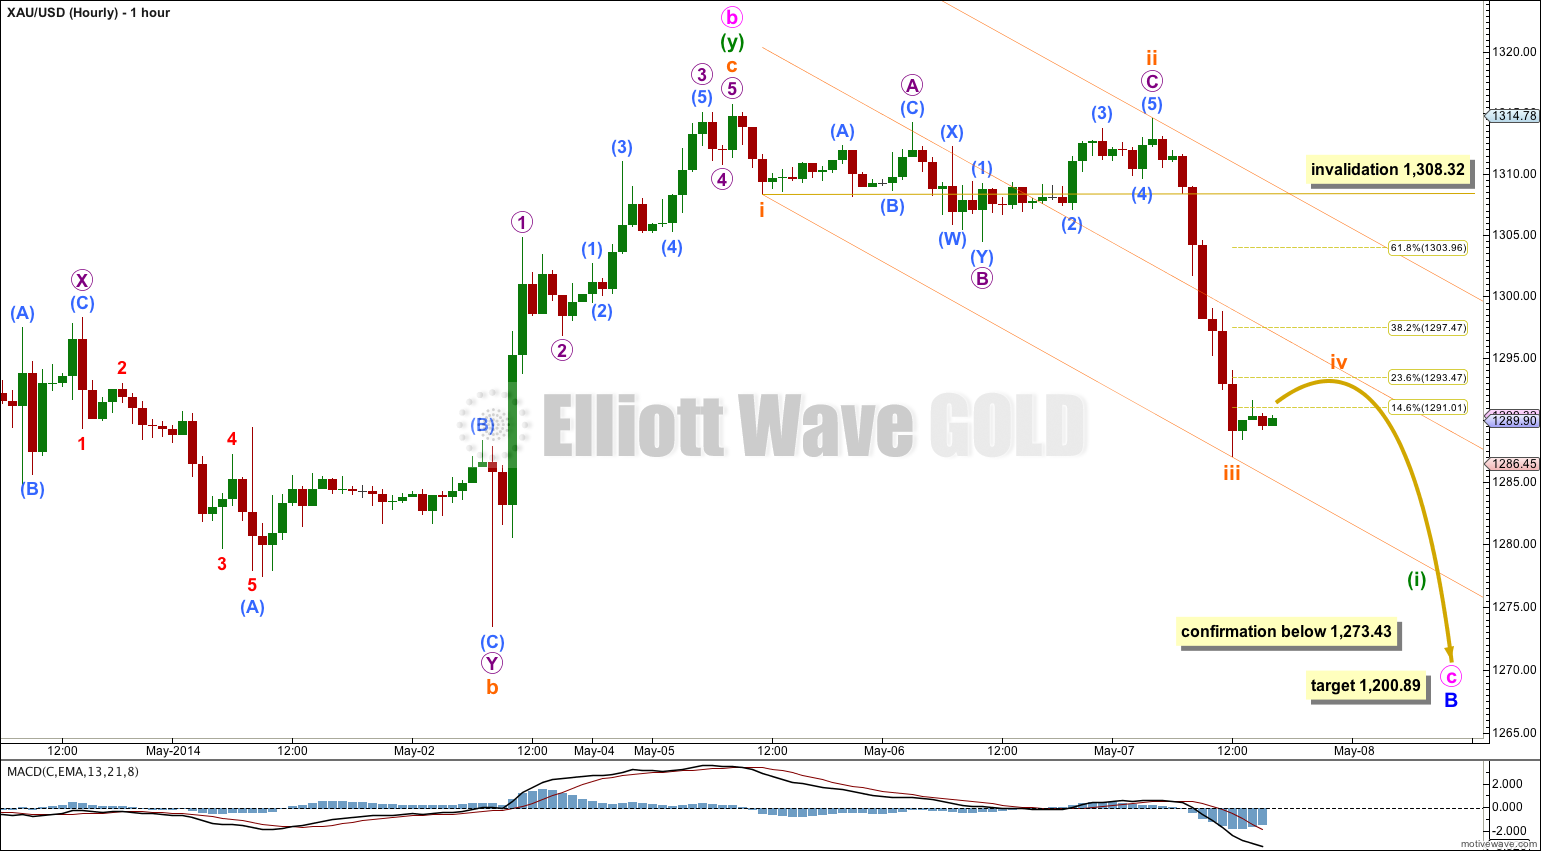
Main Hourly Wave Count.
Strong downwards movement was a clear third wave; it shows a clear strong increase in downwards momentum. This fits the main wave count perfectly and provides some confidence in it.
There is no Fibonacci ratio between subminuette waves i and iii.
Subminuette wave ii was a deep expanded flat correction. I would expect subminuette wave iv to be a relatively shallow sideways moving correction, most likely to end about the 0.236 or 0.382 Fibonacci ratios of subminuette wave iii. It may show on the daily chart as a small doji or possibly a very small green candlestick. It would be most likely to end about the mid line of the parallel channel, or less likely to find resistance at the upper edge.
Draw a parallel channel about this downwards movement using Elliott’s first technique; draw the first trend line from the lows of subminuette waves i to iii, then place a parallel copy upon the high of subminuette wave ii. Expect subminuette wave iv to remain within this channel, and subminuette wave v to end about the lower edge of the channel.
Subminuette wave iv may not move into subminuette wave i price territory above 1,308.32.
Movement below 1,273.43 would invalidate the alternate wave count below and so provide full and final confidence in this main wave count.
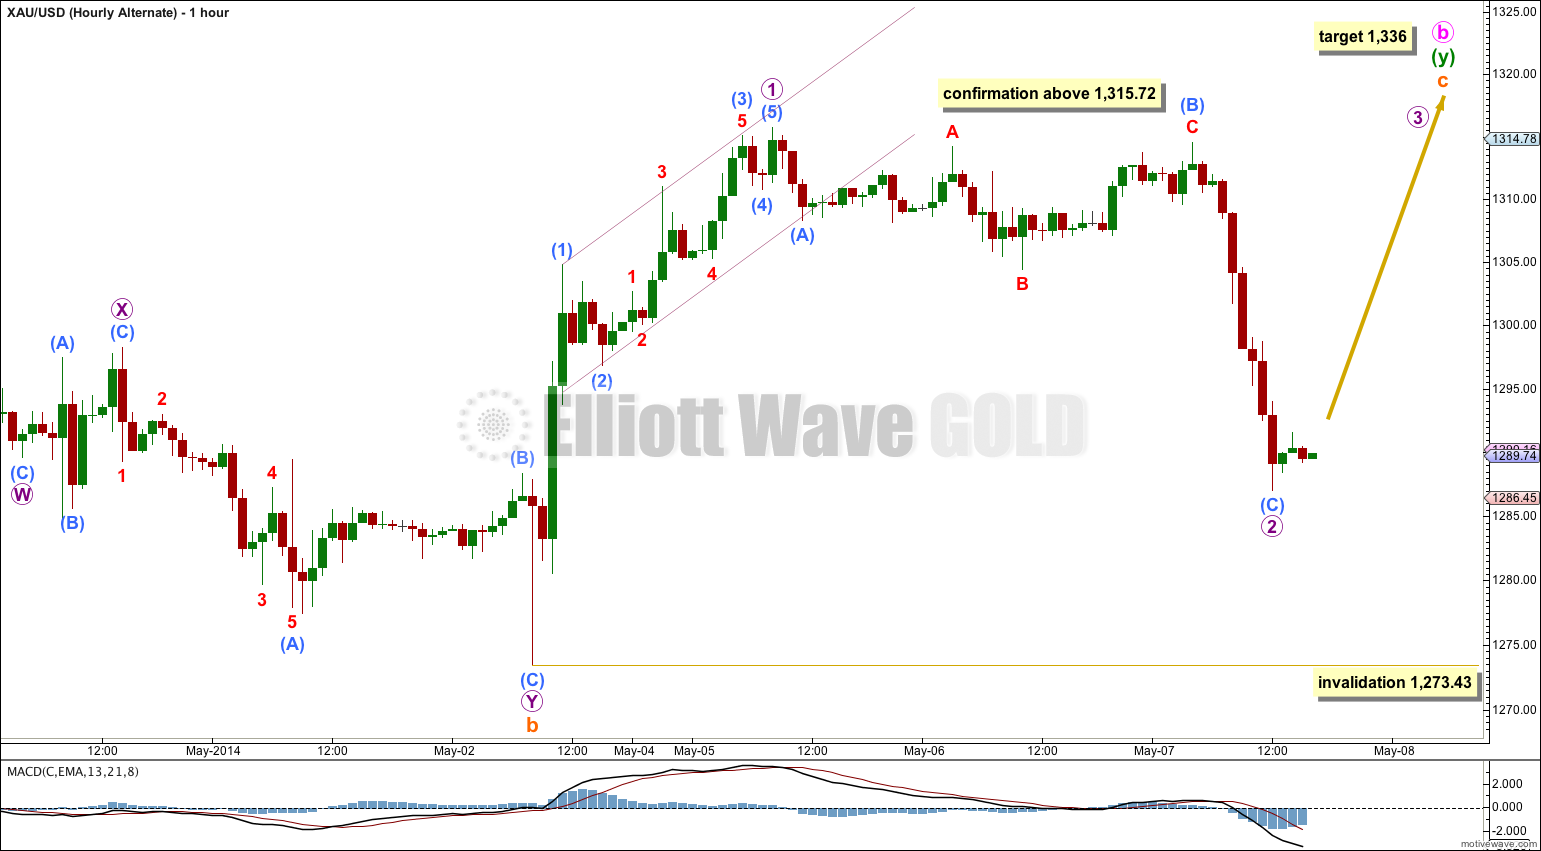
Alternate Hourly Wave Count.
If we see movement above 1,315.72 then I would use this wave count.
A-B-C and 1-2-3 have exactly the same subdivisions. Downwards movement could have been the completion of a deep second wave correction. Momentum indicates this is less likely than the main wave count though; C waves can be very strong and can look like this sometimes, but third waves always look like this. It is more likely that this strong downwards movement is a third wave as per the main wave count.
Micro wave 2 may not move below the start of micro wave 1 at 1,273.43.


