I expected upwards movement for Friday towards a target at 1,350. Price moved sideways and there was no new high. Although the invalidation point was not breached the wave count has been adjusted.
Summary: I expect downwards movement from here next week towards a target of either 1,305 or 1,280. When there is some structure downwards to analyse I will be able to identify which target is more likely. Initially I expect the lower target to be more likely. It may be reached by the end of next week.
Click on charts to enlarge.
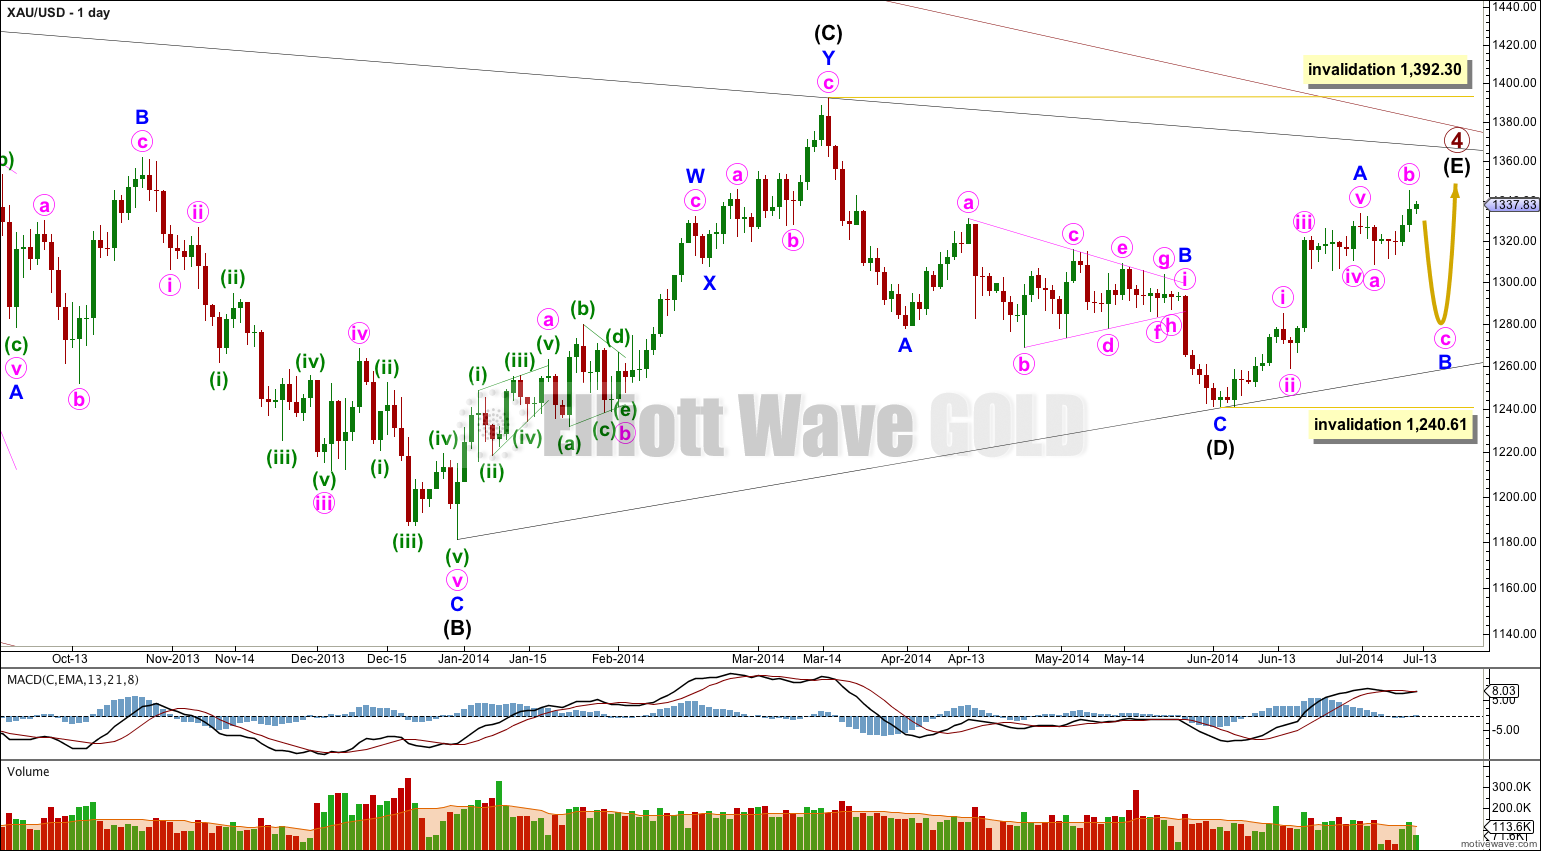
Main Wave Count.
It is likely that only minor wave A is complete and sideways movement is an incomplete minor wave B. This wave count could see primary wave 4 last another two weeks to complete in a total Fibonacci 55 weeks which would be very satisfying analytically.
Minor wave B may not move beyond the start of minor wave A below 1,240.61. Invalidation of this wave count at the daily chart level would provide full confidence in the alternate wave count.
If minor wave B moved substantially lower it should find very strong resistance at the (B)-(D) trend line. A breach of this trend line would look very atypical and at that stage this main wave count would significantly reduce in probability, so much so I may discard it.
B waves exhibit the greatest variety in form and structure of all waves. At this stage it looks like minor wave B is an expanded flat, which when it is done should have a similar look as minor wave B within intermediate wave (B) (at the left hand side of the chart).
I still judge this main wave count to be more likely than the alternate below. I would judge this main wave count to be about 90% likely, with the alternate the remaining 10%. The change from yesterday is due to the size of this sideways movement. It does not fit the alternate well at all.
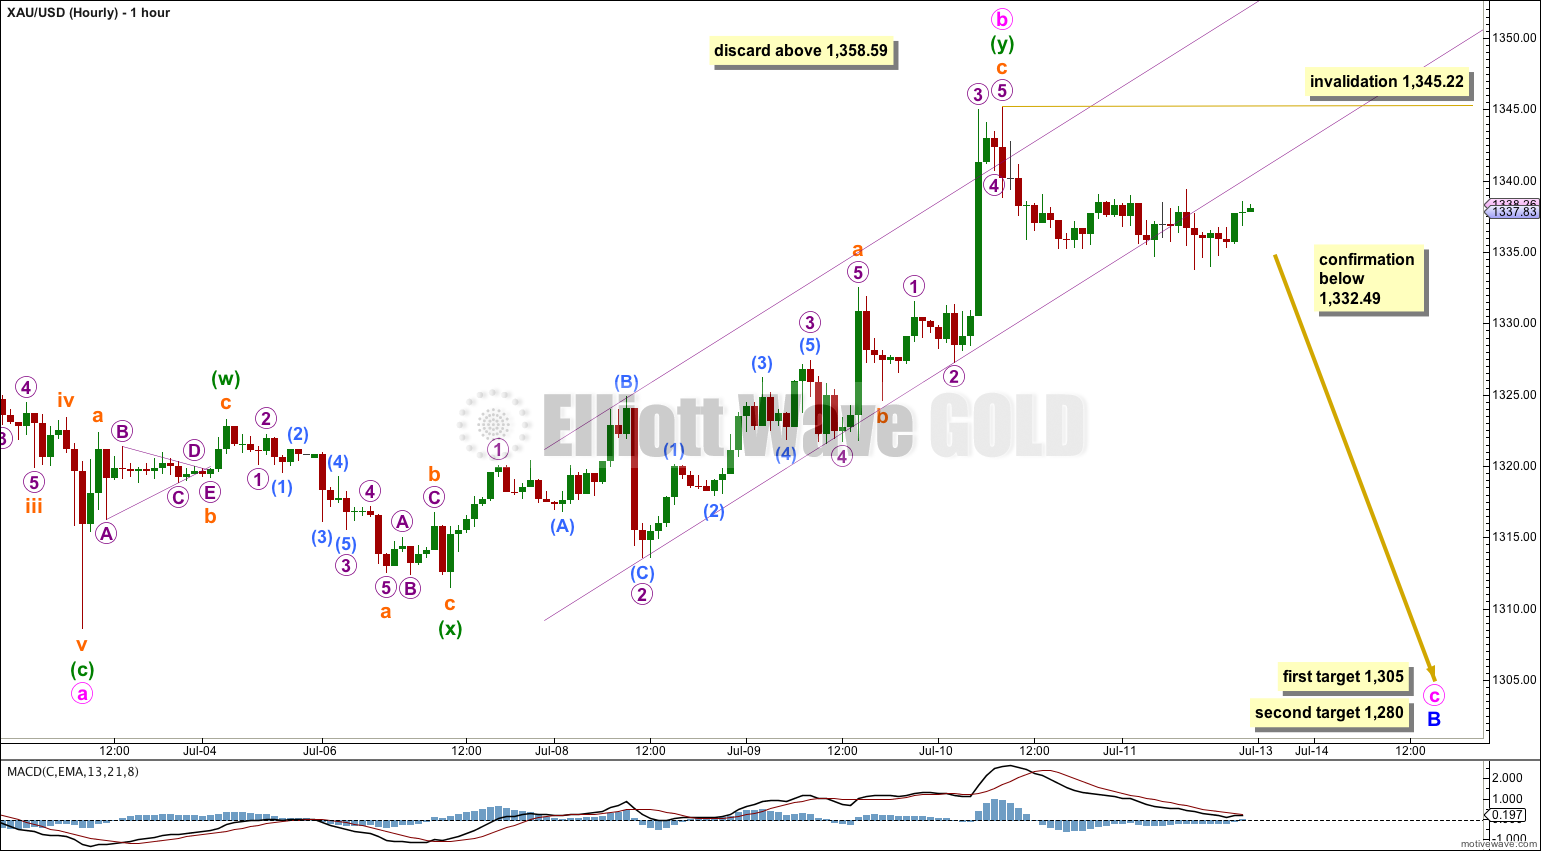
I have adjusted the wave count within most recent upwards movement. I have done this because sideways movement substantially breaches the lower edge of the best fit channel, no matter how it is drawn.
Minute wave b is now very likely to be over. If it does continue higher I would not expect it to move up much further. When it reaches twice the length of minute wave a at 1,358.59 then the probability of this wave count would be so low it should be discarded.
Minute wave b is a double zigzag. Within the second zigzag of the double, minuette wave (y), subminuette waves a and c are now just 0.37 off perfect equality in length.
Ratios within subminuette wave a are: micro wave 3 is just 0.03 longer than 1.618 the length of micro wave 1, and micro wave 5 has no Fibonacci ratio to either of micro waves 1 or 3.
Ratios within subminuette wave c are: micro wave 3 is 0.43 short of 2.618 the length of micro wave 1, and micro wave 5 0.26 longer than 0.618 the length of micro wave 1.
Overall this labeling has the closest Fibonacci ratios and an excellent fit. I think I’ve finally got this piece of movement correctly labeled. If this is correct then we should see only overall downwards movement next week.
Movement below 1,332.49 would invalidate the alternate wave count below and provide confidence in this main wave count.
Minute wave b is a 146% correction of minute wave a so minor wave B is an expanded flat correction.
At 1,305 minute wave c would reach 1.618 the length of minute wave a. This first target would not see minute wave c moving substantially below the end of minute wave a, which is abnormal for an expanded flat, and so this first target has a low probability.
At 1,280 minute wave c would reach 2.618 the length of minute wave a. This second target would see minute wave c moving substantially below the end of minute wave a and the expanded flat would have a very typical look. This second target has a higher probability.
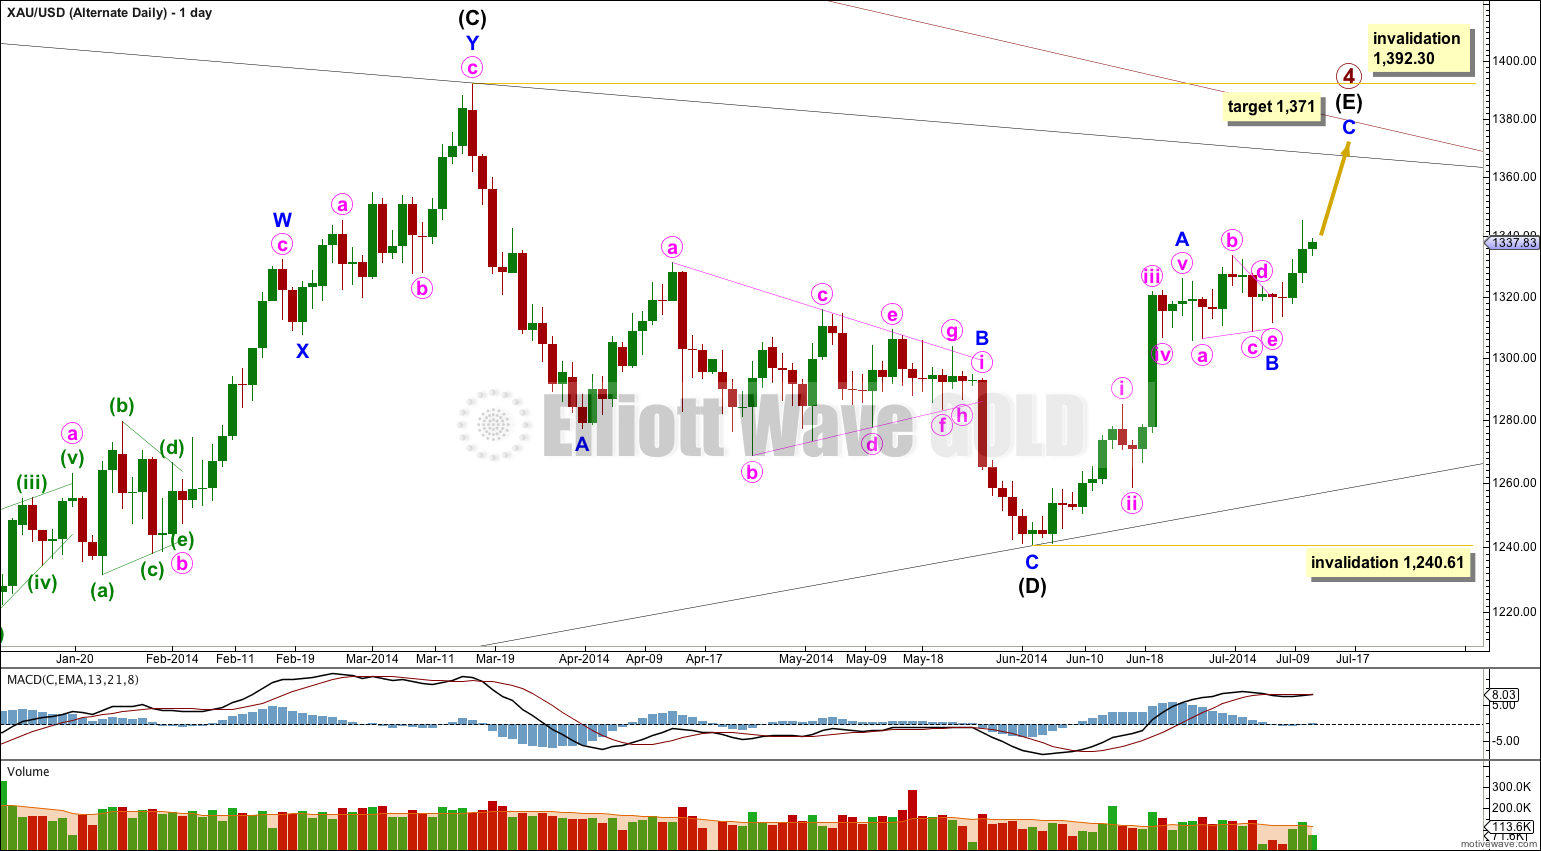
Alternate Wave Count.
In trying to see if minor wave B could be complete I have considered the possibility of a triangle. If this is correct then minor wave C may have begun at 1,311.49.
At 1,371 minor wave C would reach 0.618 the length of minor wave A. This would see intermediate wave (E) only slightly overshoot the (A)-(C) trend line which does not have a typical look. The target may be a little too low… or too high. Once minute waves iii and iv within minor wave C have ended I could calculate the target at minute wave degree which would have a higher probability. I cannot do that yet.
If this wave count becomes the main wave count with price movement above 1,358.59 then the target at 1,371 will be recalculated at minute wave degree towards the end of upwards movement.
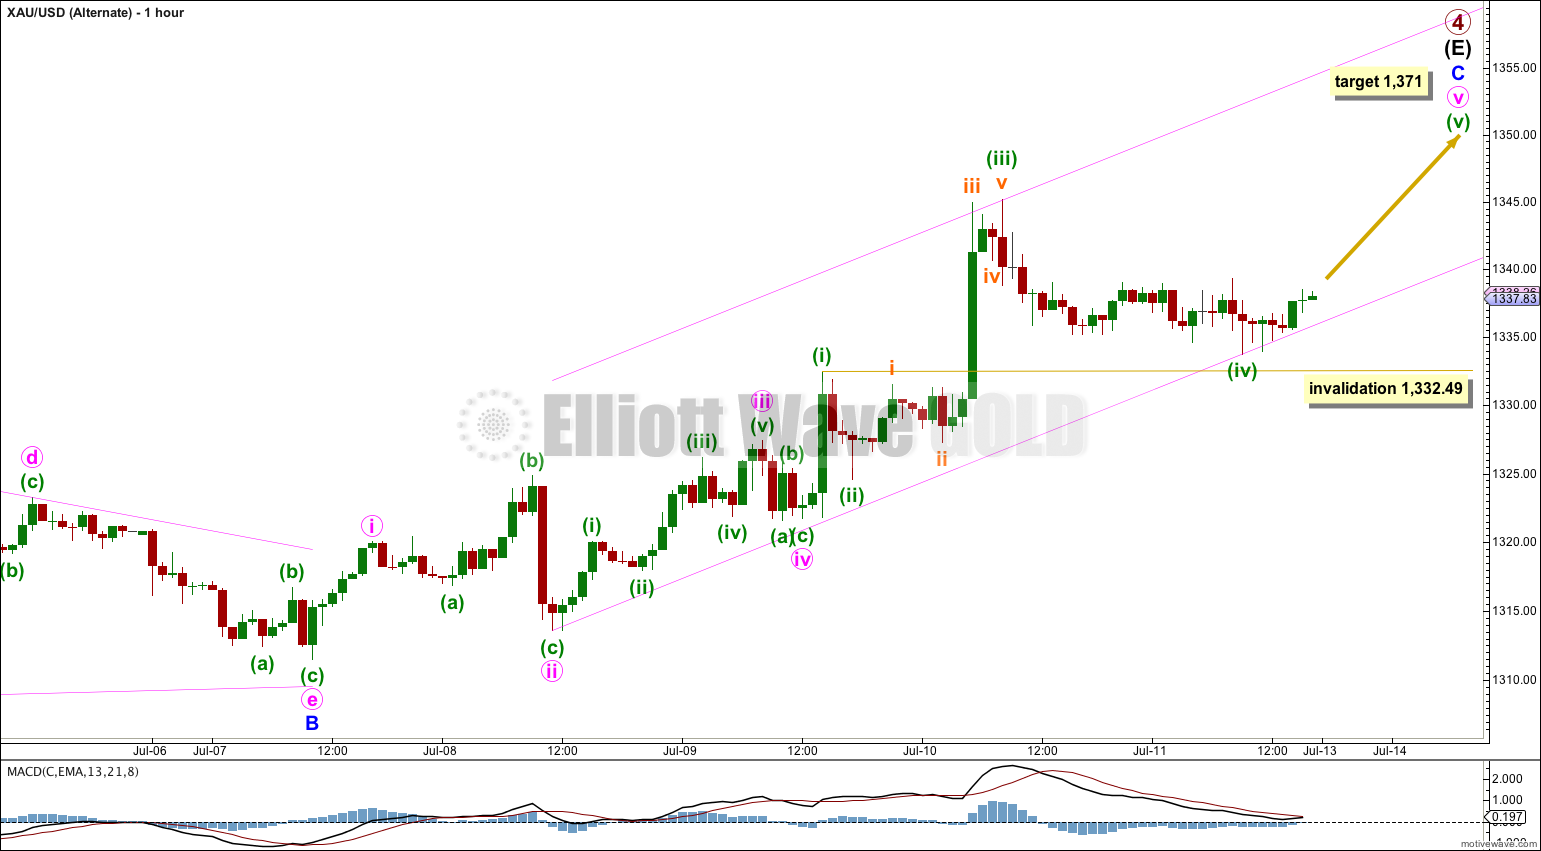
I have adjusted the analysis within minor wave C.
I have tried to see if current sideways movement could be minute wave iv, which would be better in proportion to minute wave ii. But the piece of movement from the low labeled minute wave ii to the high labeled minuette wave (iii) does not fit as a five wave impulse.
If minor wave C is incomplete then it may have an extended fifth wave.
Minuette wave (iii) is 0.03 longer than 1.618 the length of minuette wave (i). Minuette wave (v) may not exhibit a Fibonacci ratio to minuette waves (i) or (iii).
Minuette wave (iv) is hugely out of proportion to minuette wave (ii) which substantially reduces the probability of this wave count.
Minuette wave (iv) may not move into minuette wave (i) price territory below 1,332.49.
This analysis is published about 08:15 p.m. EST.


Between 8-11 July, extremely important time cycles for gold matured. Despite the perfect look on the weekly chart gold did not break to the downside. This market has made a decision and it wants to go UP. If the price of gold stays above 1330 by the end of this week, then all the minimum requirements will be met and gold should make a very large move within a very short time. The worst case scenario for gold would be to test the 1500 level, but most likely it should go higher.
Palobar
Very interested to hear more on this possibiity. Would you please explain the cycles which indicate gold will rise?
Sounds like hurst cycle analysis..
Never proven reliable in my experience with it..
I use a wide range of weekly, monthly and yearly cycles. A number of cycles bottomed at the same time. The 1st large candle came on 14 July, which is 1 TD away from the range I indicated. Very strong long-term support lines from major lows (680, 1180 [6/2013], 1182 [12/2013] cross around 1289-1292. Below this level the EW analysis (weekly) should be taken very seriously. At this stage I prefer not to consider the daily or hourly EW charts because of the invalidations we had after the 1240 low. Today’s huge red candle looks very bearish when in fact it is the opposite. Please take a look at the Dow Jones (monthly) chart and study carefully what happened in 1987 and you will notice the similarities. Any downward pressure will be exhausted by the beginning of August. In my view, it is most likely that the 1240 low will not be broken. That low SQUARED the $1920 all time high and the 2008 low of $680 (1920-680).
19 September 2014 (+/- 3TD) will bring a mega change in trend for equity markets which means that gold must resume its long term trend by then.
ps Trade based on what you see and not what are reading :). Good luck.
Palobar–appreciate your detailed comments. One question I have please.
In your comments (below) what long-term trend will gold resume? The long-term EW trend Lara has provided or some long-term trend you derive from various methods? As I do not understand your meaning, could you describe the long-term gold trend you see after 19 September?
Palobar said: “19 September 2014 (+/- 3TD) will bring a mega change in trend for equity markets which means that gold must resume its long term trend by then”
You are welcome.
(1) Around 19/9/2014 many multyyear cycles will bottom (+/- week). As we approach that date there is a high probability that we will strong downward pressure on the equity markets. That will happen 3 years after the all time high in gold.
Lara if your main count is correct, Minor wave B & C are going to have to play out fairly quickly. With the downtrend upper weekly trend channel sitting under $1370 now, Minor wave C should not breach the channel at all, but also end above $1345. From a time perspective, the alternate fits much better possibly ending in a fib 55 weeks with a target $1365-$1367 which would touch the upper trendline from the weekly chart. I know it has a terrible look, but just my thinking. If $1334 does not act as support, the main count is most likely in play.
The Fed is speaking this week which always creates volatility in gold. It could be big! Thanks for your hard work as always!
Main count it is and off to a nice start to happen quickly. Ideally, we would see $1280ish by the end of the week. Who knows maybe we see it on Wed when Yellen concludes speaking?
Hello Lara, hope you are fine and enjoying weekend, kindly do not mind what i said on earlier messages, actually i just wanted to see both above and below levels now you are on right track, your analysis are really very good but i just need to see what will happen if invalidation point will hit and what are the targets. Again i really do not want to hurt and do not want to say any thing wrong about you personally. hope you will not mind. take care