
Sideways movement has not clarified the situation. The Elliott wave counts remain the same.
Summary: The situation is unclear. A break above 1,324.73 would indicate a third wave up may be unfolding. A break below 1,304.60 would indicate more downwards movement, which could be a third wave down but may only be a fifth wave to 1,280.
Click on charts to enlarge.
Main Wave Count.
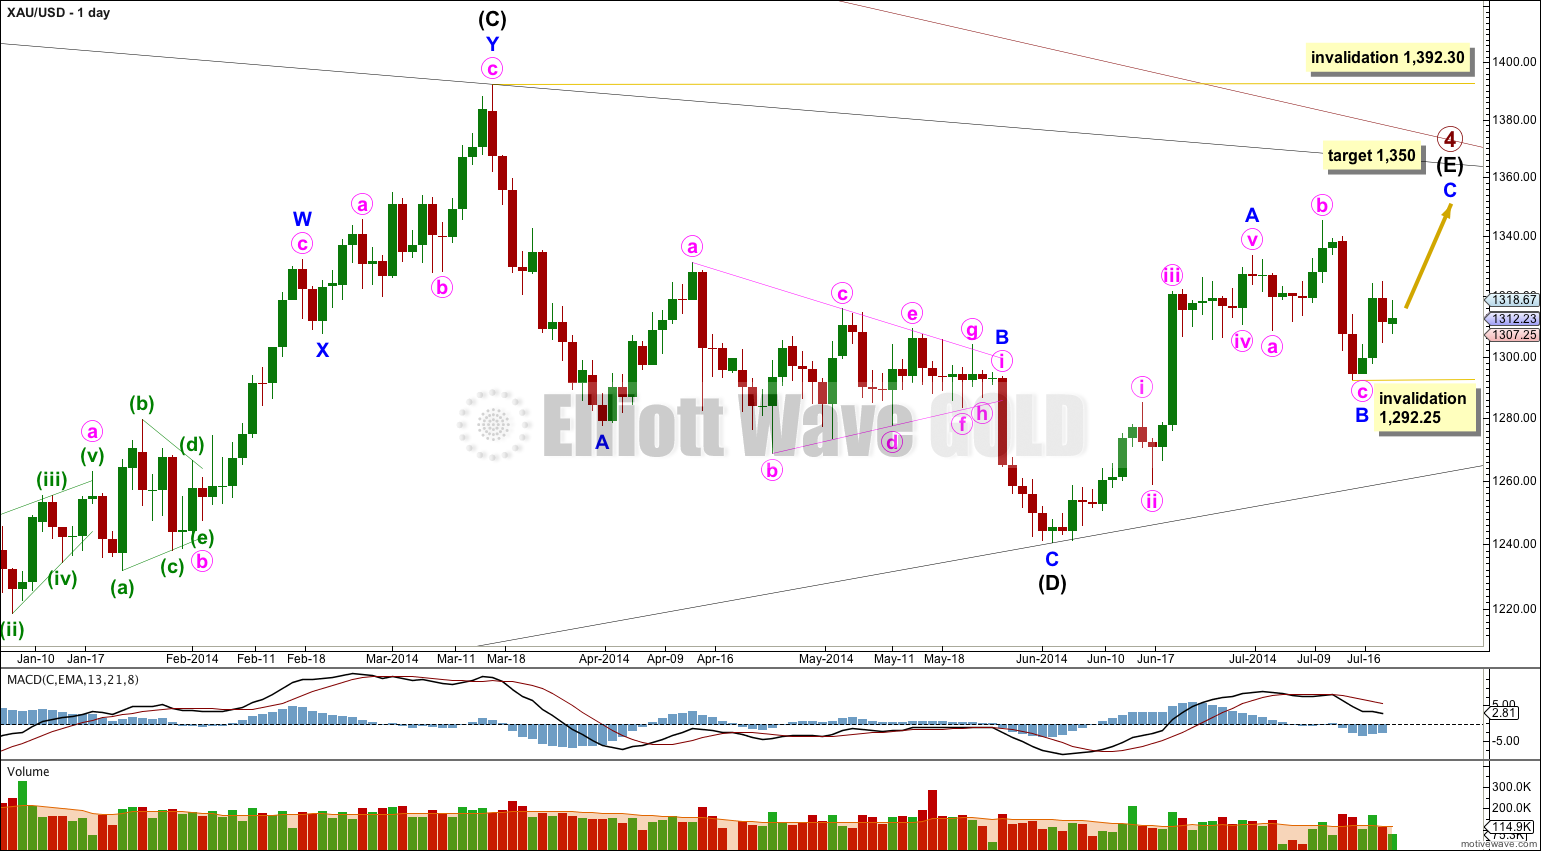
Primary wave 4 is an almost complete regular contracting triangle, now in its 55th week. If it ends within the next six days it will be close enough to a Fibonacci 55 weeks to exhibit a Fibonacci duration.
The final zigzag of intermediate wave (E) may be just a few days away from completion. Within it minor wave B can be seen as a complete expanded flat. There is no Fibonacci ratio between minute waves a and c.
At 1,350 minor wave C would reach 0.618 the length of minor wave A. Minor wave C is extremely likely to at least make a new high above the end of minor wave A at 1,333.61 to avoid a truncation.
When minor wave C is a complete five wave structure then I will expect a primary degree trend change. Eventually a clear breach of the lower (B)-(D) trend line of this triangle will provide confirmation that primary wave 4 has ended and primary wave 5 has then begun.
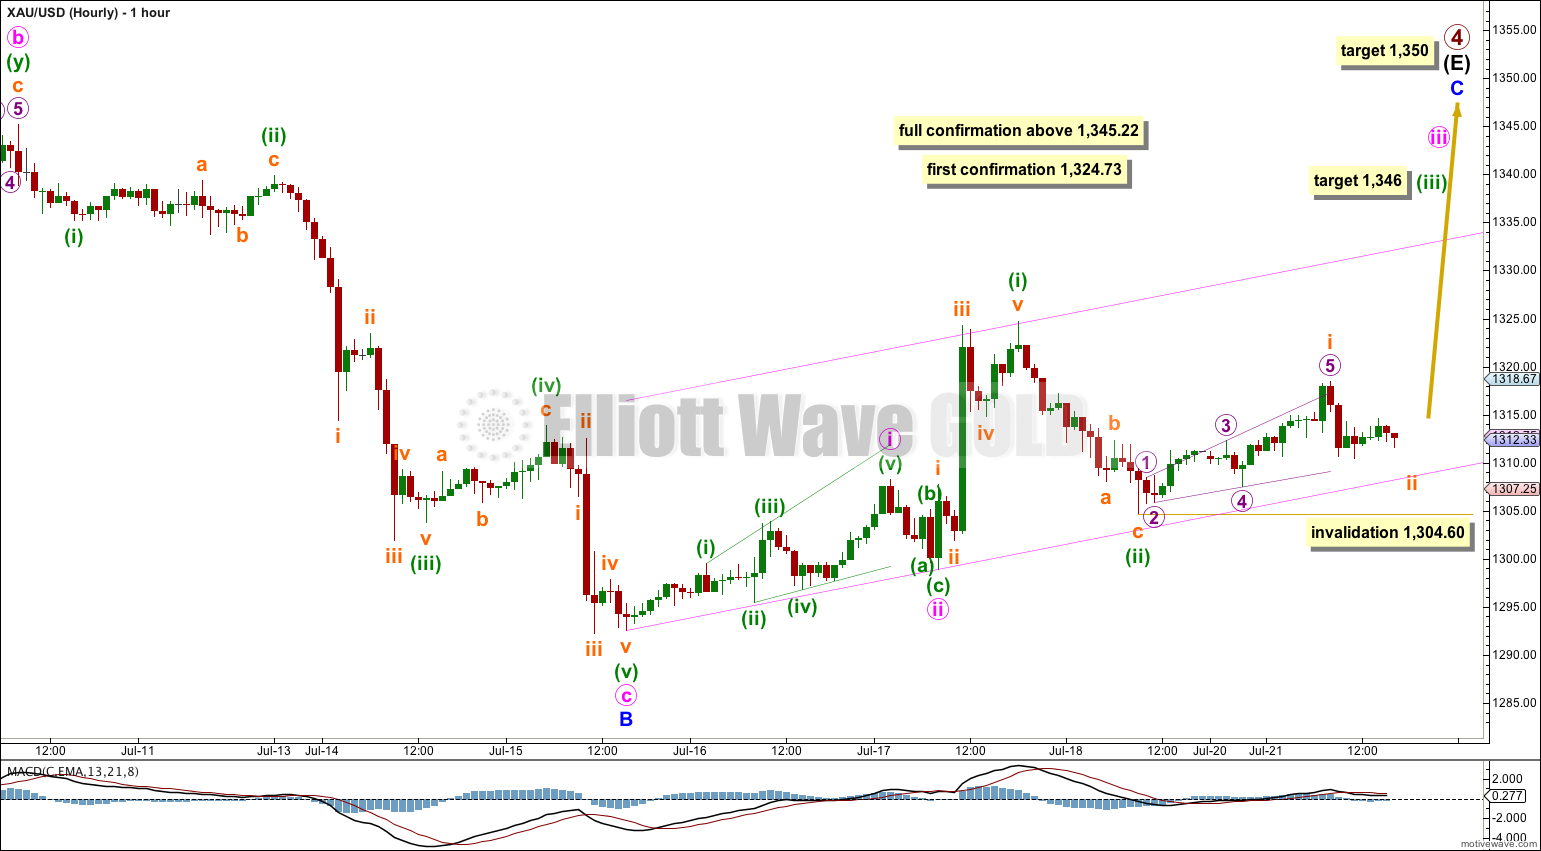
This first hourly wave count has a reasonable fit, but on the five minute chart for most recent movement the subdivisions within minuette wave (ii) and subminuette wave i do not fit as neatly as the second hourly chart below. For this reason today I expect this wave count has decreased in probability, closer to even with the second hourly chart below.
If minor wave B is over then minor wave C upwards has begun. At 1,350 minor wave C would reach 0.618 the length of minor wave A.
Within minor wave C minute wave i is a leading expanding diagonal, followed by a second wave zigzag which is only 58% of minute wave i. Second waves following leading diagonals are most often deeper than this.
Subminuette wave i does not have a good fit on the five minute chart. Within it micro wave 2 looks like a triangle, but if this is a second wave within a diagonal it can only be a zigzag. This leads me to think this movement may be corrective, and not the start of a third wave.
However, third waves often begin slowly like this. When they do they convince us they will not arrive, right before momentum sharply increases.
At 1,346 minuette wave (iii) would reach 1.618 the length of minuette wave (i).
I have drawn a best fit channel about the start of minor wave C. Along the way up downwards corrections should find strong support at the lower trend line. If this trend line is breached by downwards movement this wave count would decrease further in probability.
Subminuette wave ii may not move beyond the start of subminuette wave i below 1,304.60. If price breaks below 1,304.60 then I would use the second hourly chart below.
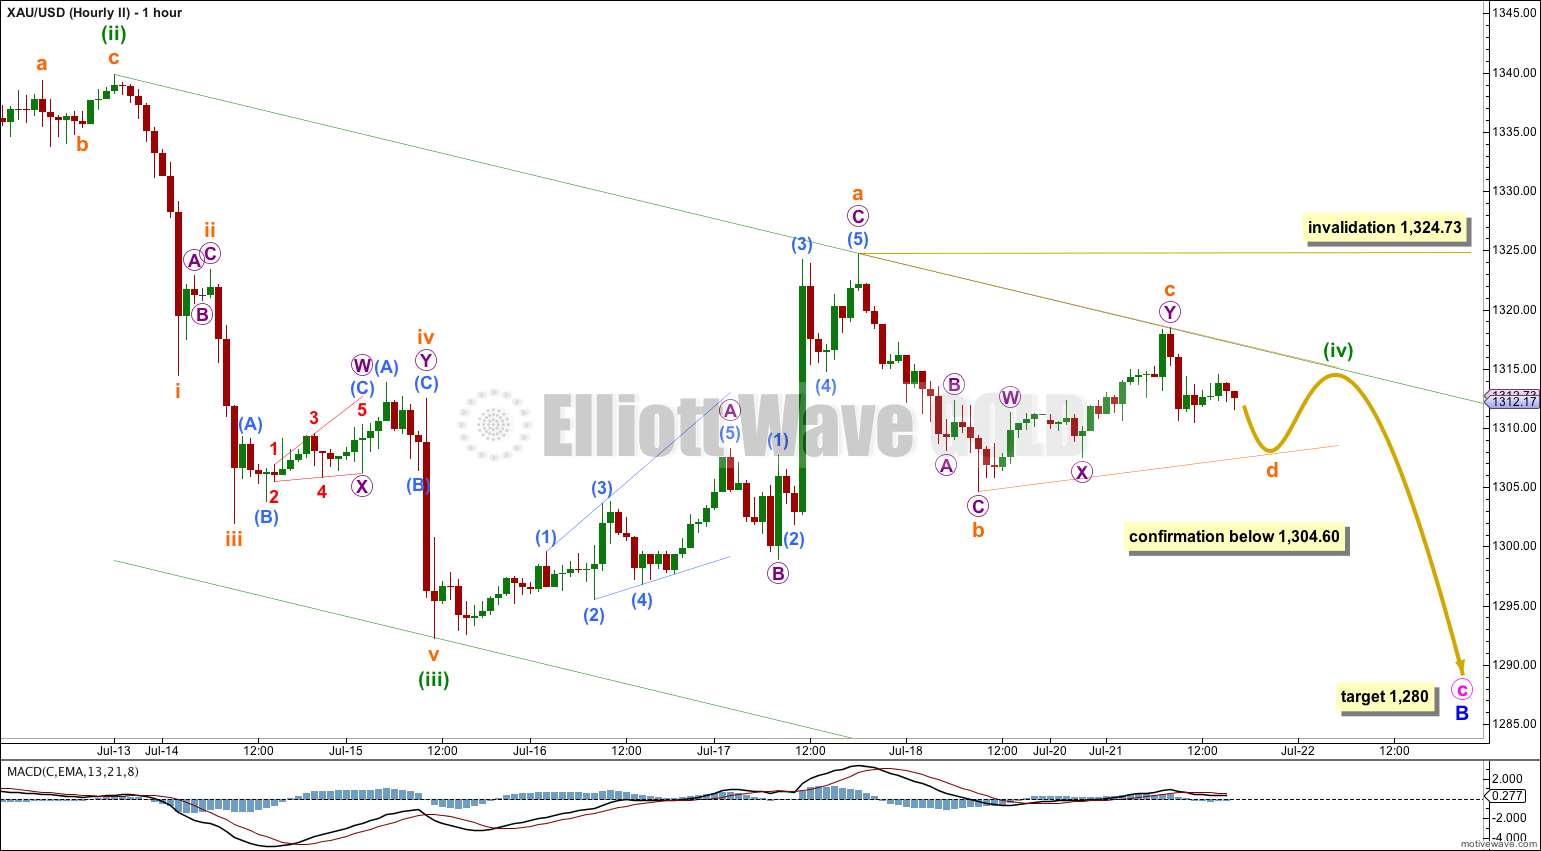
This second hourly chart looks at the possibility that minor wave B expanded flat correction is not over.
Sideways movement has increased the probability of this second wave count. The subdivisions fit perfectly on the five minute chart. Minuette wave (iv) may be an incomplete regular contracting triangle.
At the daily chart level this wave count has a good look: minuette wave (ii) shows as a small green candlestick and minuette wave (iv) should also show on the daily chart as one or more green candlesticks. On the hourly chart though minuette waves (ii) and (iv) are grossly out of proportion: minuette wave (ii) lasted just 25 hours and so far minuette wave (iv) has lasted 101 hours. Triangles do tend to take up more time than most other corrective structures, but so far this is four times the duration and it is incomplete.
Within the triangle subminuette waves a, b and c are complete. Subminuette wave d may not move beyond the end of subminuette wave b below 1,304.60. Thereafter, subminuette wave e may not move beyond the end of subminuette wave c above 1,318.47.
This second hourly chart now expects choppy overlapping movement for about one more day before this fourth wave triangle is over. Thereafter, it expects to see most likely a new low below 1,292.25 so that minuette wave (v) avoids a truncation.
At 1,280 minute wave c would reach 2.618 the length of minute wave a. If price breaks below 1,304.60 invalidating the first hourly chart then I would have some confidence in this target.
Alternate Wave Count.
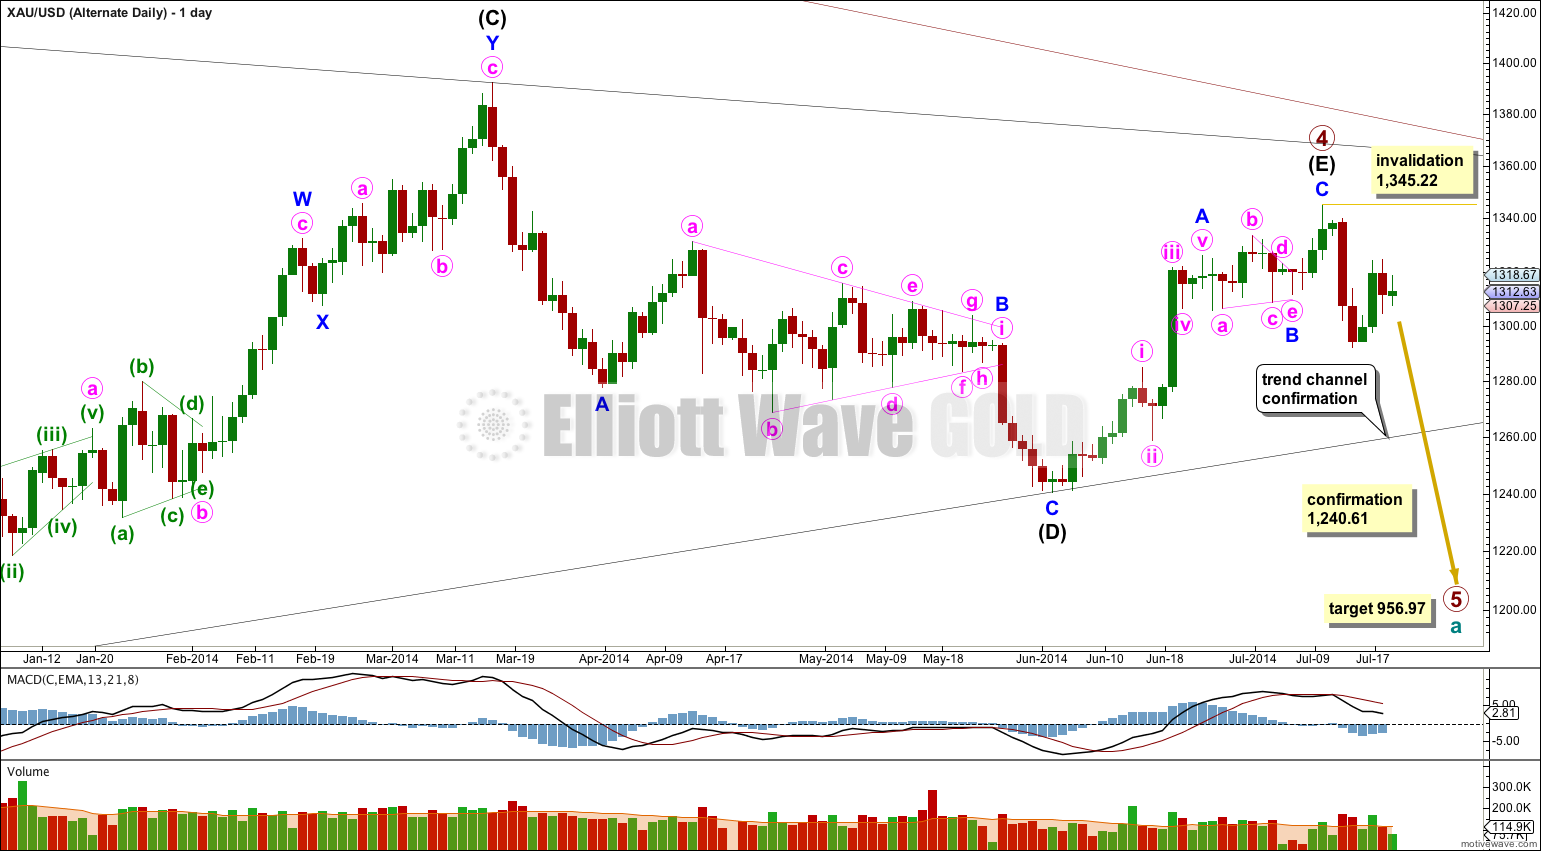
It is possible that primary wave 4 is complete in a total 54 weeks, just one short of a Fibonacci 55 and just one week longer than primary wave 2 which was 53 weeks in duration.
The subdivisions for this alternate do not have as neat a fit as the main wave count:
– The triangle for minor wave B has an overshoot of the b-d trend line within minute wave c which looks significant on the hourly chart.
– At the end of minor wave A minute wave v does not subdivide well as a five wave structure on the hourly chart. This movement fits better as a three.
– Minor wave C subdivides here as a five wave structure, but it has a much better fit as a zigzag (which is how the main wave count sees it).
For the three reasons above this alternate has a lower probability. I would judge it at this stage to have a 20 – 30% probability.
The differentiating point is the lower (B)-(D) trend line here on the daily chart. If this trend line is breached by a full daily candlestick below it and not touching it then I would discard the main wave count and this alternate would be my only wave count.
At 956.97 primary wave 5 would reach equality in length with primary wave 1. Primary wave 1 was a remarkably brief three weeks in duration. Primary wave 5 could also be as brief, but it is more likely to show a little alternation and be longer lasting.
At this stage I do not want to publish an hourly wave count for this alternate because the situation for the short term is unclear. Downwards movement may be a completed first wave, or it may be only within a fourth wave triangle and the first wave down may be incomplete. Movement below 1,304.60 would increase the probability of this alternate, but only a breach of the (B)-(D) trend line would provide me with confidence in it.
This analysis is published about 05:57 p.m. EST.