
Another green candlestick was expected, but we are not seeing an increase in upwards momentum. I have a new alternate hourly Elliott wave count for you to consider today.
Summary: The direction of the next wave should be up. If it shows an increase in momentum then the target is at 1,307. If momentum does not increase at the time of a new high above 1,291.06 then the new alternate may be correct, and the next upwards wave may be followed by a very deep second wave correction.
Click on charts to enlarge.
Main Wave Count.
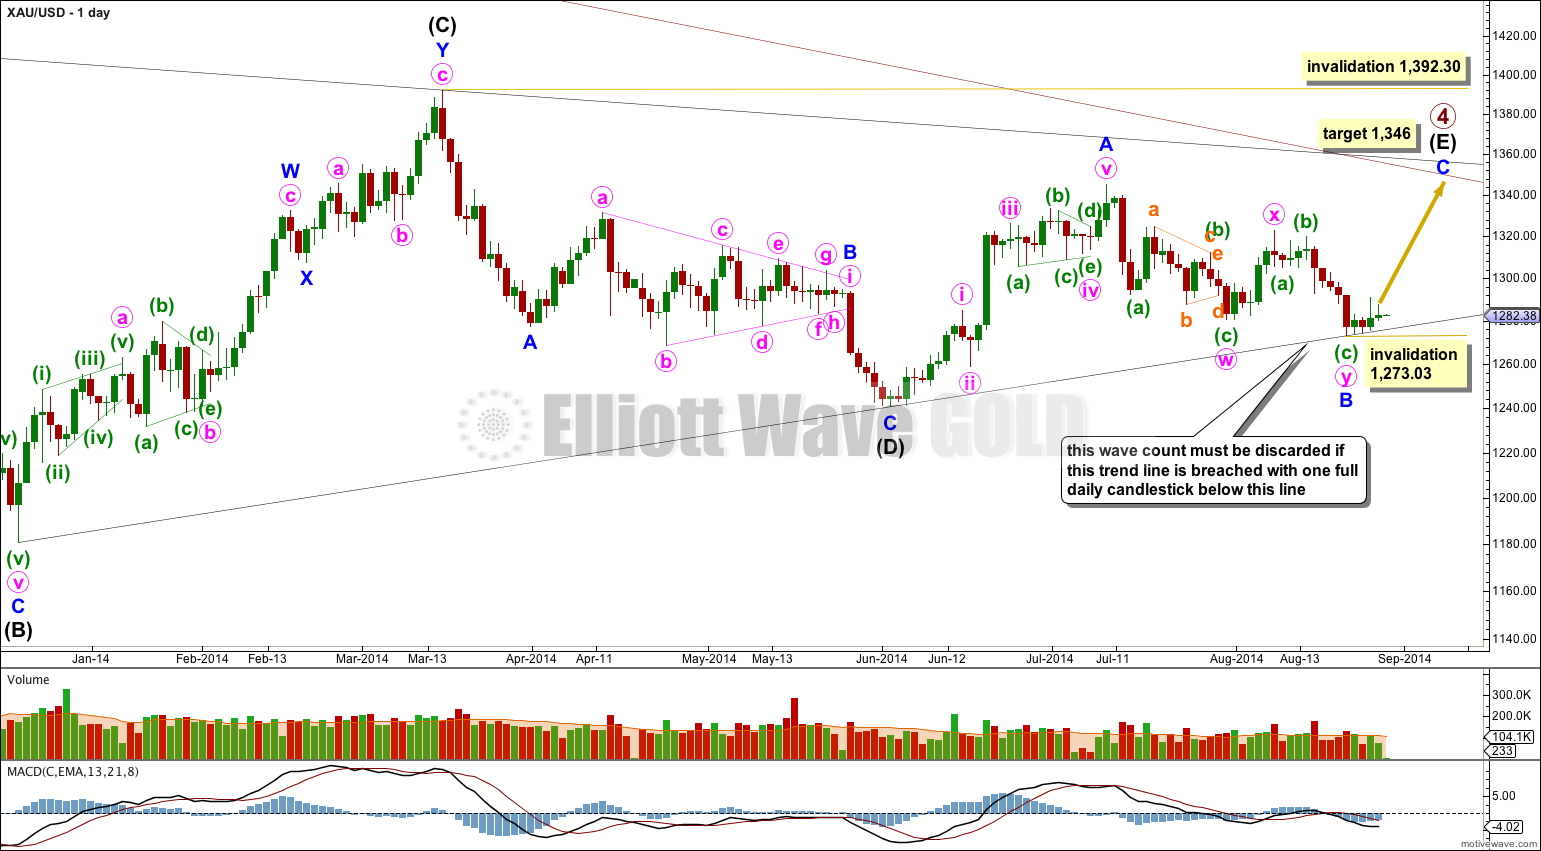
Primary wave 4 is an incomplete regular contracting triangle. Primary wave 2 was a deep 68% running flat correction. Primary wave 4 is showing alternation in depth and some alternation in structure.
Within the triangle of primary wave 4 intermediate wave (E) is unfolding as a zigzag: minor wave A is a five wave impulse and minor wave B downwards now fits as a completed double zigzag.
There are four nice examples of completed triangles on this daily chart. When triangles are complete the first movement out of them is most often quite swift and sharp. Importantly, this first movement does not hesitate at the B-D trend line and will plough straight through the trend line, which ceases to provide support or resistance. It is significant that at this stage the (B)-(D) trend line is still providing support to downwards movement. This is one reason why I consider this main wave count to have a higher probability.
If minor wave C is to avoid a truncation it should move above the end of minor wave A at 1,345.22. At 1,346 it would do this, and may end when price comes to touch the upper edge of the maroon channel copied over here from the weekly chart. This may see minor wave C last a Fibonacci 13 days in total.
The four examples of completed triangles here on the daily chart also show that the final subwave of a triangle most often ends comfortably short of the A-C trend line. The target at 1,346 would see this happen for primary wave 4.
Intermediate wave (E) may not move beyond the end of intermediate wave (C) above 1,392.30.
Within minor wave C no second wave correction may move beyond the start of its first wave below 1,273.03.
Hourly Wave Count – Main.
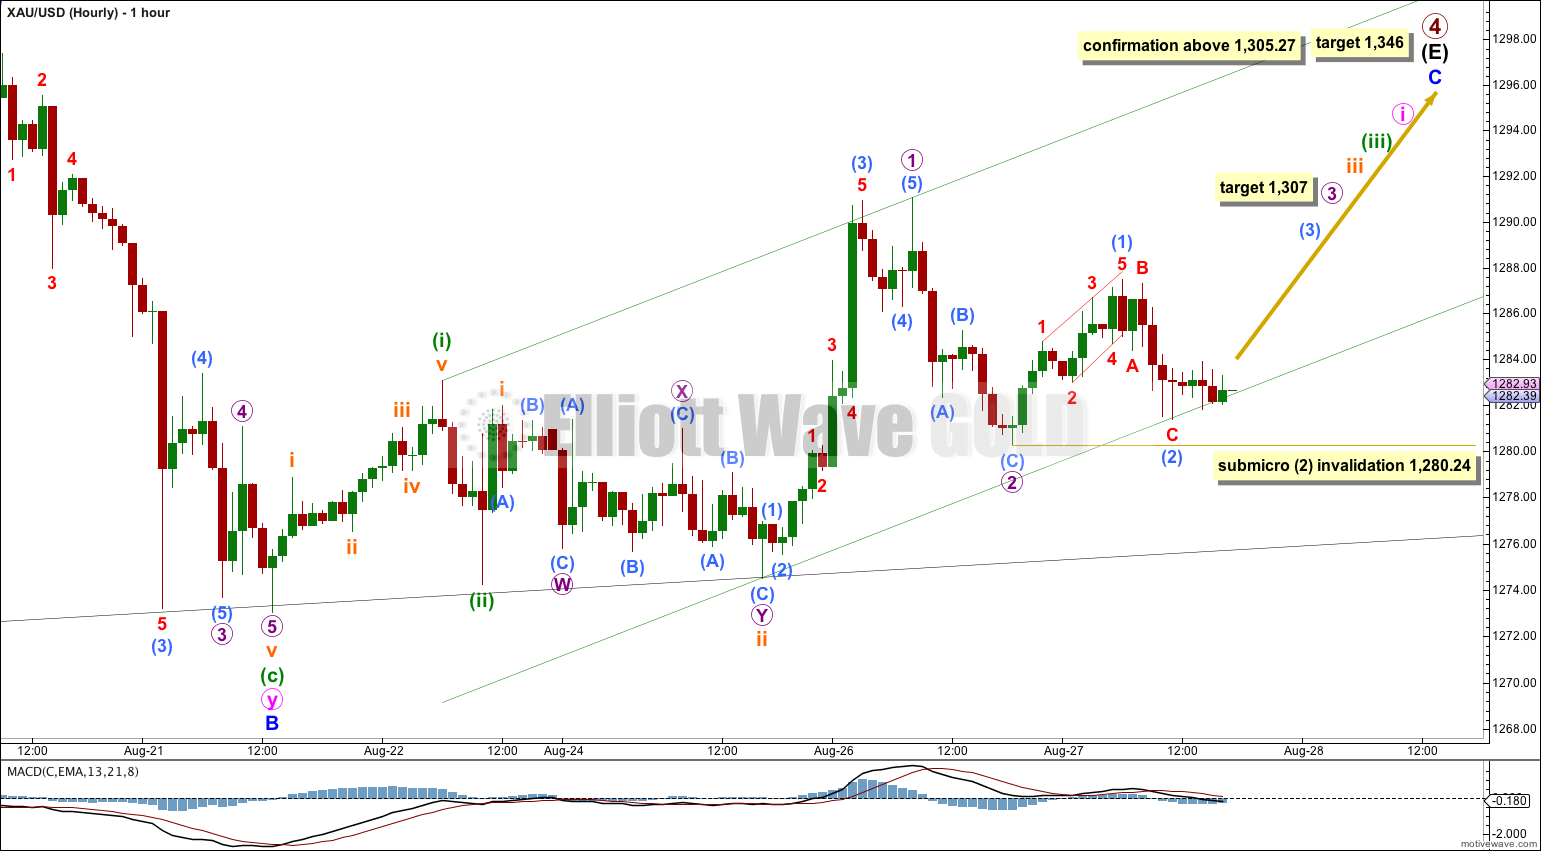
This wave count has the best fit in terms of subdivisions. We may now have a series of four overlapping first and second waves.
There is no divergence in my expectation of the next direction: this first hourly chart and the new alternate below both require a new high above 1,291.06. Micro wave 3 must move beyond the end of micro wave 1.
At 1,307 micro wave 3 would reach 1.618 the length of micro wave 1.
Within micro wave 3 I am seeing submicro wave (1) as a leading contracting diagonal, followed by a deep second wave correction for submicro wave (2). Submicro wave (2) may not move beyond the start of submicro wave (1) below 1,280.24.
If this wave count is correct then not only should price move above 1,291.06 but when it gets there momentum should have increased beyond that seen for micro wave 1. If momentum does not increase then the new alternate below will be more likely.
I have drawn an acceleration channel about this upwards movement: draw the first trend line from the highs of minuette wave (i) to micro wave 1, then place a parallel copy on the low of subminuette wave ii. So far downwards movement is finding some support at this lower trend line. If this wave count is correct it should continue to do so. If this trend line is breached that shall be the earliest indication that the new alternate may be correct.
Hourly Wave Count – Alternate.
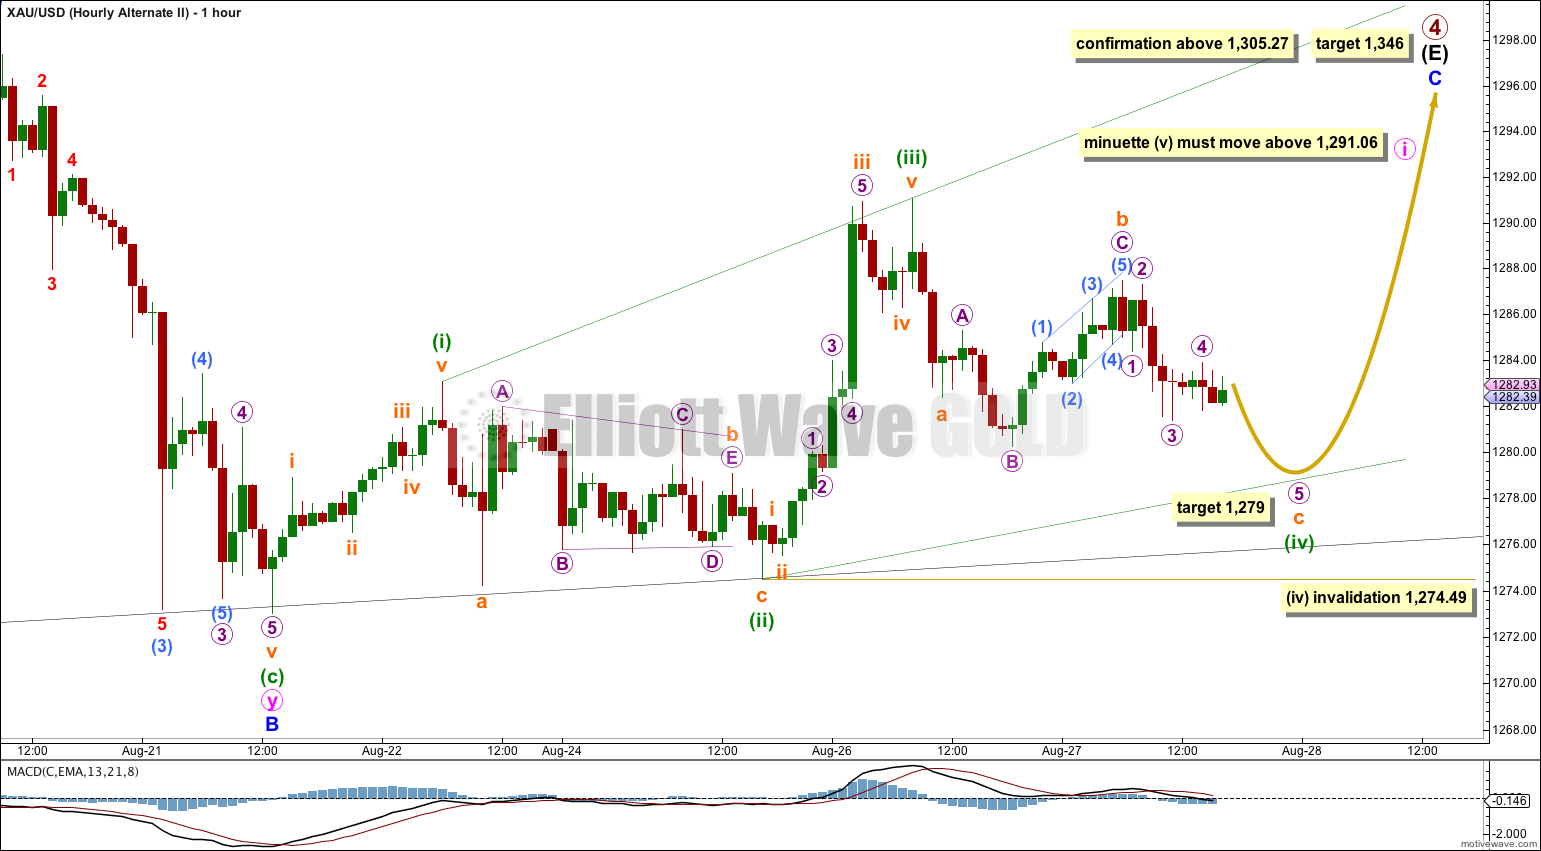
Minute wave i may be unfolding as a leading expanding diagonal. Leading diagonals are not exactly rare, but they are not common either. When they do arrive in first wave positions they are most often contracting. The expanding variety is more unusual. This must reduce the probability of this wave count.
Within leading diagonals waves 1, 3 and 5 are most often zigzags (but they may also be impulses), waves 2 and 4 may only be zigzags, and wave 4 must overlap wave 1 price territory. Also, waves 2 and 4 most often are between 0.66 to 0.81 the prior wave.
Here minuette wave (ii) is 0.85 the length of minuette wave (i), a little longer than the maximum common length. At 1,279 minuette wave (iv) would be 0.73 the length of minuette wave (ii), within normal range. At 1,279 subminuette wave c would reach equality in length with subminuette wave a.
This wave count sees the downwards movement labeled micro wave B within subminuette wave b within minuette wave (iv) as a three wave zigzag. Looking at this movement on the five minute chart this subdivides best as a five wave impulse. This further reduces the probability of this alternate wave count.
Leading diagonals may not have truncated fifth waves, so minuette wave (v) must move beyond the end of minuette wave (iii). Therefore, a new high above 1,291.06 is required for this wave count. Minuette wave (v) would not be expected to show an increase in momentum; the strongest upwards momentum for this wave count would be expected to be seen for the third wave and not the fifth wave.
I will let momentum of the next wave up guide us to which wave count is most likely.
Leading diagonals in first wave positions are commonly followed by very deep second waves. If this wave count is correct then minute wave ii may be very deep, and may bring price right back down to the black (B)-(D) trend line on the daily chart.
Minuette wave (iv) of the diagonal may not move beyond the end of minuette wave (ii) below 1,274.49.
Alternate Daily Wave Count
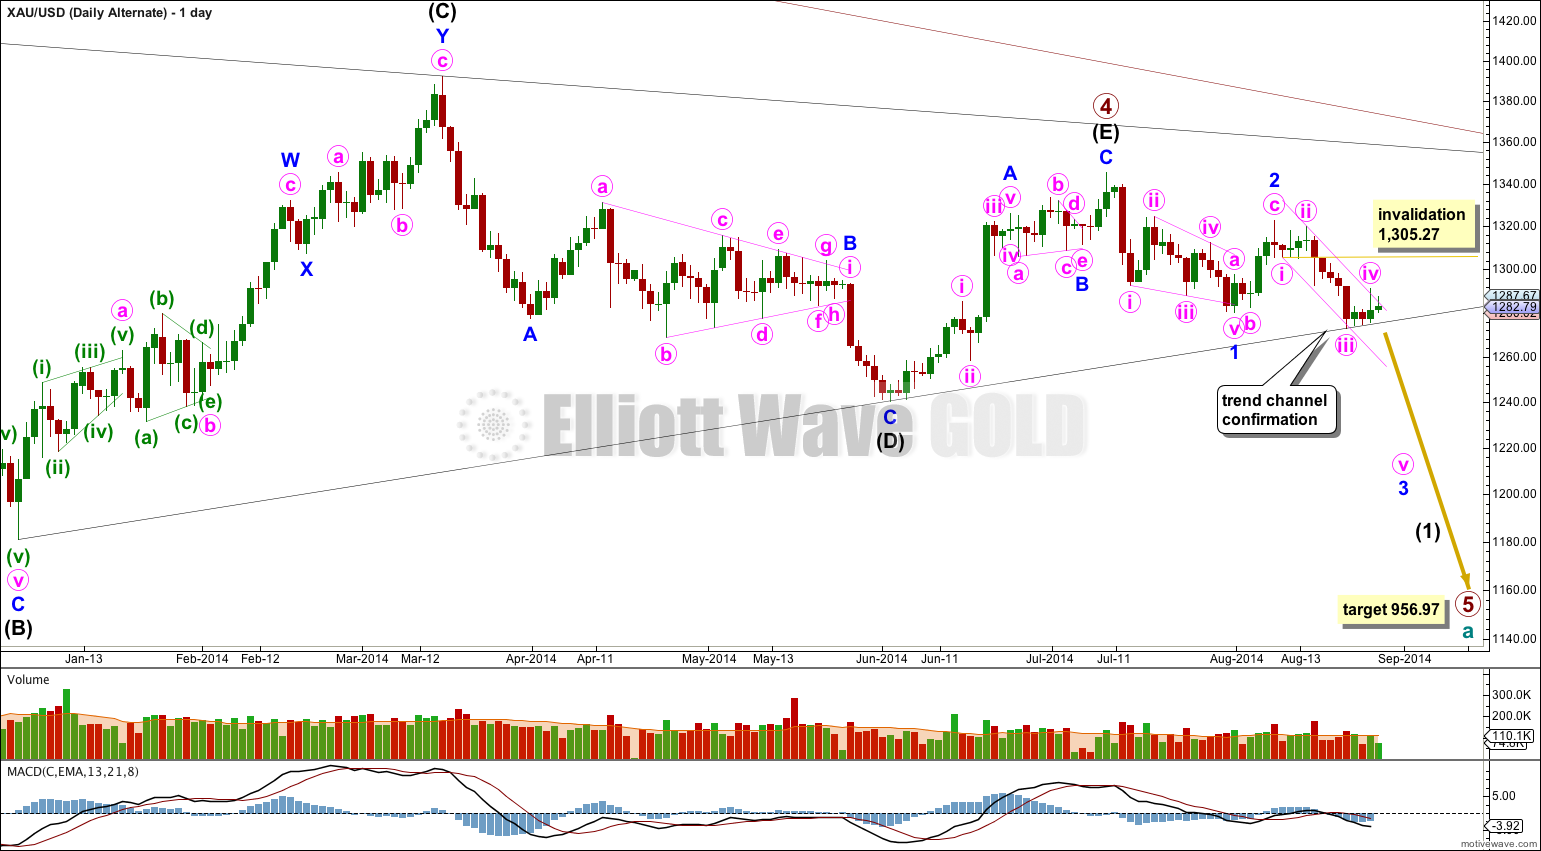
It is possible that primary wave 4 is over at the high of 1,345.22. This wave count still requires confirmation with a clear breach of the (B)-(D) trend line on this daily chart.
If primary wave 4 is over then primary wave 5 downwards would reach equality in length with primary wave 1 at 956.97. Primary wave 1 was a remarkably brief 3 weeks duration. I would expect primary wave 5 to last some months, and is already longer than one month.
The only structure which fits for minor wave 1 is a leading contracting diagonal. While leading diagonals are not rare, they are not very common either. This slightly reduces the probability of this wave count.
Within diagonals the second and fourth waves are commonly between 0.66 to 0.81 the prior wave. Here minute wave ii is 0.61 the length of minute wave i, just a little shorter than the common length, slightly reducing the probability of this wave count. Minute wave iv is 0.66 the length of minute wave iii, just within the common length.
Leading diagonals in first wave positions are normally followed by very deep second wave corrections. Minor wave 2 is deep at 65% the length of minor wave 1, but this is not “very” deep. This again very slightly reduces the probability of this wave count.
The biggest problem I have with this wave count and the main reason for it still being an alternate is the leading diagonal following the end of the triangle for primary wave 4. When triangles end the first piece of movement out of the triangle is almost always very strong and swift. Diagonals are not strong and swift movements. To see a first wave out of a triangle subdividing as a diagonal is highly unusual and does not at all fit with typical behaviour.
Also, price continues to find strong support at the (B)-(D) trend line, which should have ceased to provide any support or resistance if the triangle was over. This is unusual and further reduces the probability of this alternate wave count.
Within minor wave 3 minute wave iv may not move into minute wave i price territory above 1,305.27.
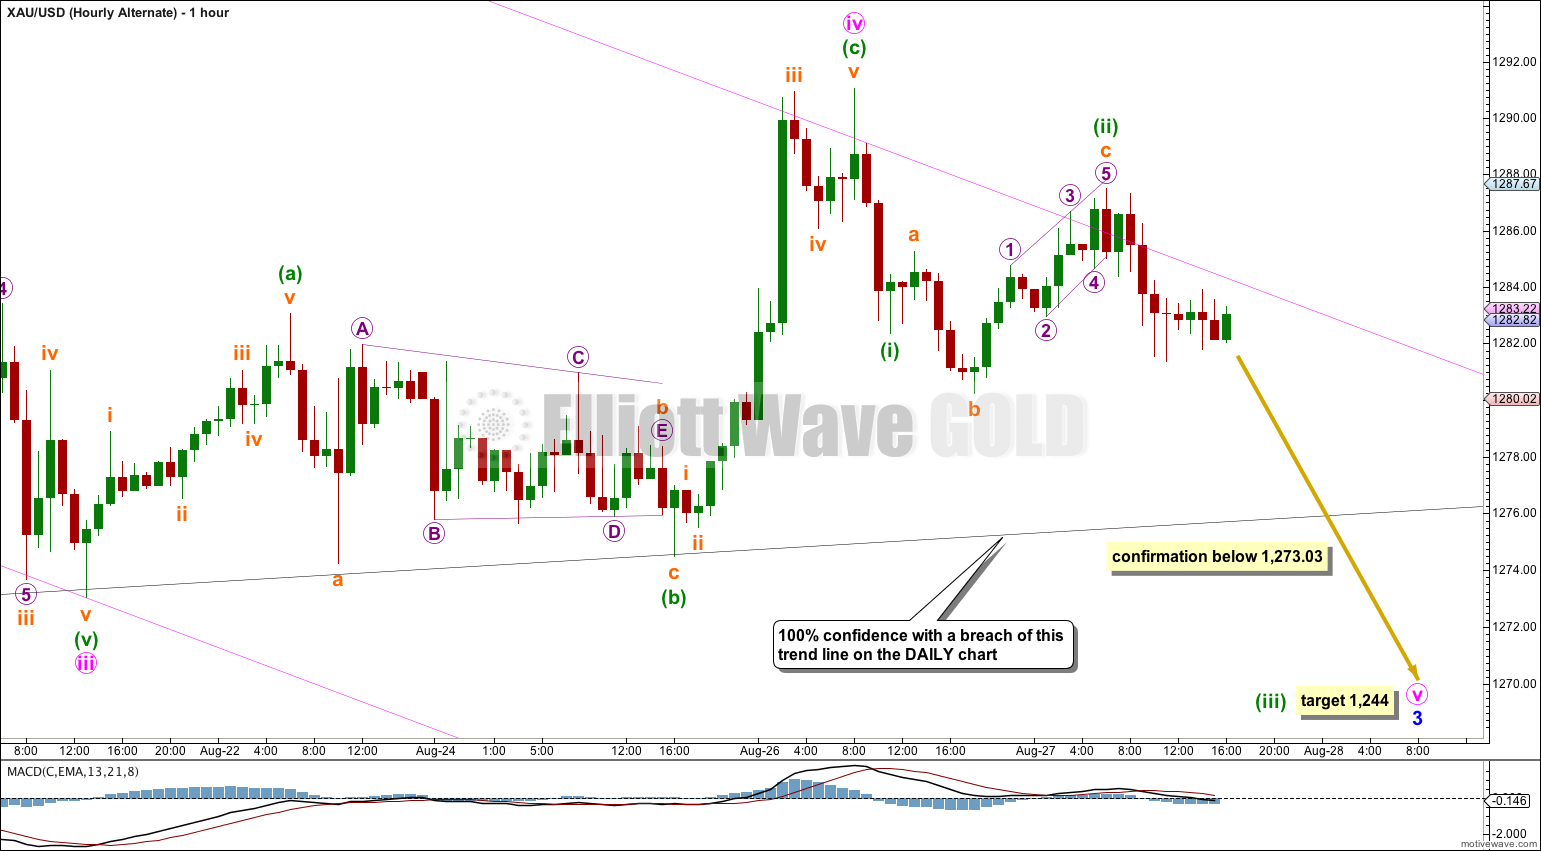
A clear breach of the lower (B)-(D) trend line of the primary wave 4 triangle would provide full and final confirmation of this alternate. A full daily candlestick below that trend line would provide me with 100% confidence in this wave count.
Draw a channel about minor wave 3 here on the daily chart using Elliott’s first technique and copy it over to the hourly chart: draw the first trend line from the lows labeled minute waves i to iii, then place a parallel copy on the high labeled minute wave ii.
This alternate now also suffers from the same problem as the new alternate above: the downwards wave labeled here subminuette wave b within minuette wave (ii) subdivides best as a five wave impulse on the five minute chart, but this wave count must see it as a three wave zigzag. The probability is further reduced today.
At 1,244 minute wave v would reach equality in length with minute wave iii. Both minute waves iii and v would be extended.
This wave count requires confirmation initially with a new low below 1,273.03. Thereafter, I would wait for one full daily candlestick below the black (B)-(D) trend line on the daily chart before I would have full confidence in the idea that primary wave 5 has begun.
I would only take this wave count seriously with some confirmation.
This analysis is published about 06:16 p.m. EST.