Upwards movement continued as expected. The Elliott wave count remains the same.
Summary: A small second wave correction may be about to begin, interrupting this upwards movement. It may reach down to about 1,294.73 and it may show on the daily chart as one or two red candlesticks or dojis. When it is complete upwards movement should continue with very strong momentum.
Click on charts to enlarge.
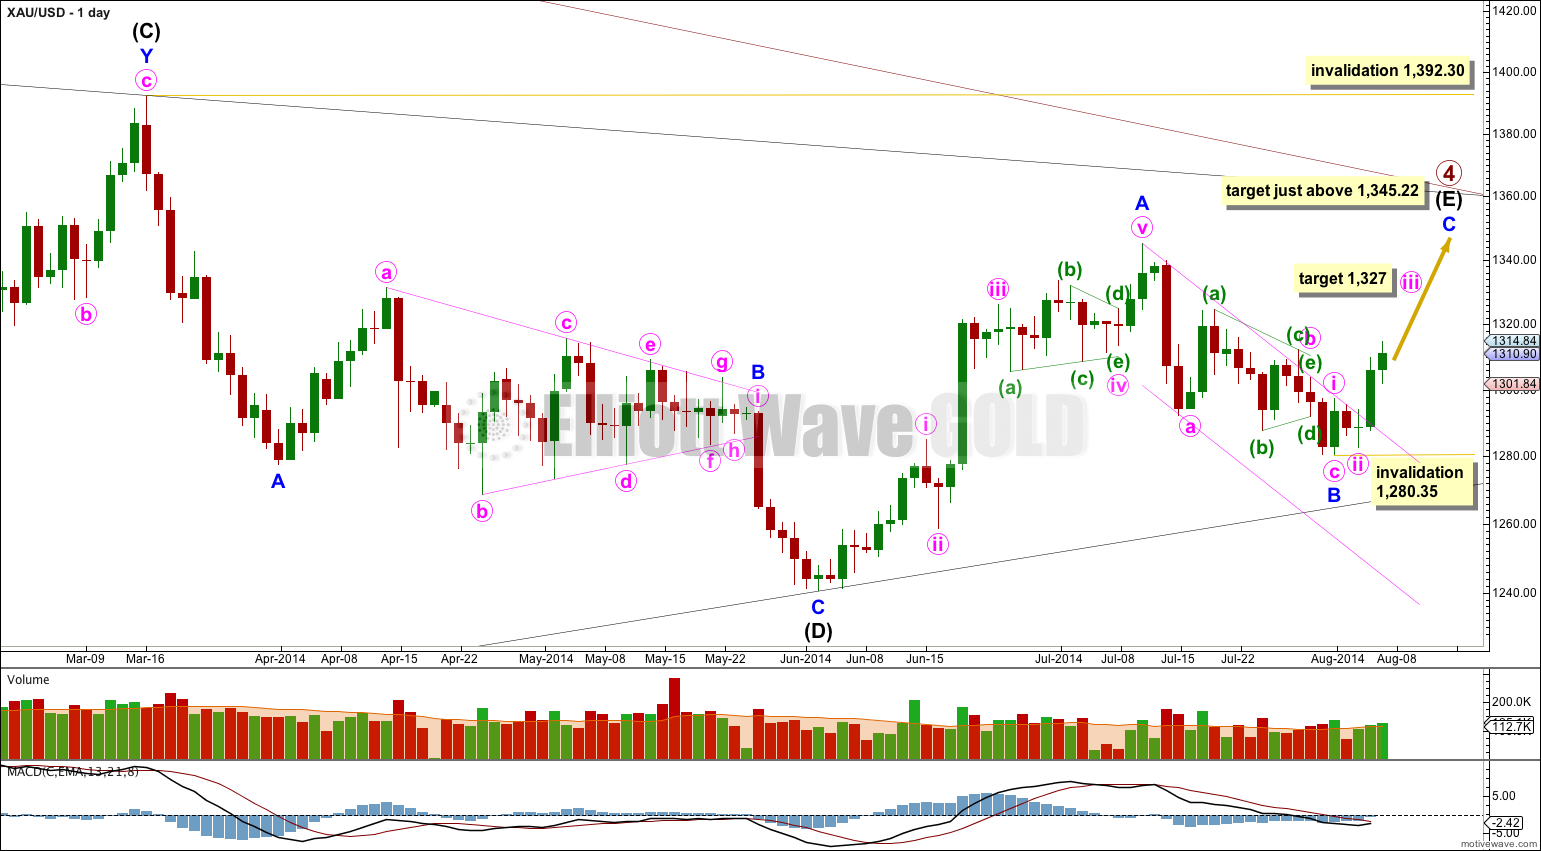
Primary wave 4 is an incomplete regular contracting triangle. Primary wave 2 was a deep 68% running flat correction. Primary wave 4 is showing alternation in depth and some alternation in structure.
Within the triangle of primary wave 4 intermediate wave (E) is unfolding as a zigzag: minor wave A is a five wave impulse and minor wave B downwards is a zigzag. I have drawn a corrective channel about minor wave B downwards. This channel is now breached by a full candlestick above the channel and not touching it, confirming minor wave B is over and minor wave C upwards has begun.
Because there is a clear triangle within this downwards wave of minor wave B, this movement cannot be a new impulse to the downside because a triangle may not be the sole corrective structure in a second wave position. The position of this triangle indicates strongly that intermediate wave (E) is incomplete.
Within minor wave C no second wave correction may move beyond its start below 1,280.35.
Intermediate wave (E) may not move beyond the end of intermediate wave (C) above 1,392.30.
I can still see another alternate possibility today. If primary wave 4 is over at the high labeled minor wave A within intermediate wave (E) then it is possible that primary wave 5 has began with a leading diagonal in a first wave position which would be complete, and this would be followed by a very deep second wave correction. However, leading diagonals in first wave positions are not very common. This alternate idea is possible, but I judge it to have a very low probability, maybe as low as 5%. I will only publish this idea if the black (B)-(D) trend line is clearly breached.
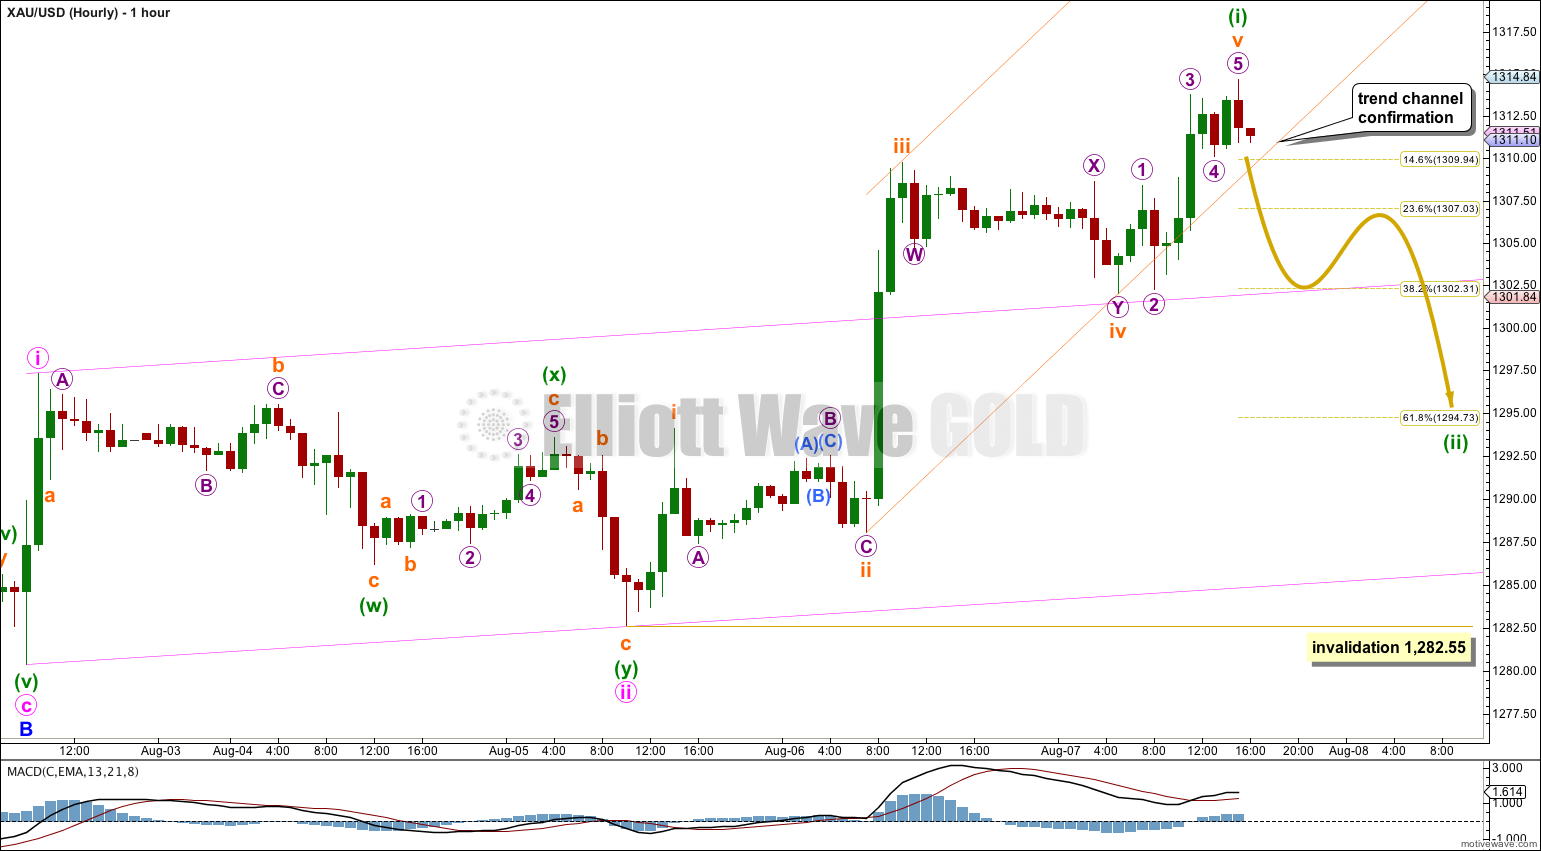
I have adjusted the wave count within minuette wave (i) and I expect it is now over as a complete five wave impulse.
Ratios within minuette wave (i) are: subminuette wave iii has no Fibonacci ratio to subminuette wave i, and subminuette wave v is 1.11 longer than equality with subminuette wave i.
Draw a channel about minuette wave (i) using Elliott’s second technique: draw the first trend line from the ends of subminuette waves ii to iv, then place a parallel copy on the end of subminuette wave iii. When this channel is clearly breached by downwards movement with at least one full hourly candlestick below it and not touching the lower trend line, then we shall have trend channel confirmation that minuette wave (i) is complete and minuette wave (ii) is underway.
When third waves extend for Gold they often (not always) show their subdivisions clearly on the daily chart. Within minute wave iii we may see minuette waves (ii) and (iv) show clearly on the daily chart as one or more red candlesticks or dojis each. This would give minute wave iii a typical look for Gold.
However, sometimes shorter minute degree third waves do not show their subdivisions clearly on the daily chart.
Minuette wave (ii) should unfold, but how long it will last is uncertain. It may last one to three days (with two or three days being unlikely), or it could be over within 24 hours. It is most likely to be a zigzag reaching down to the 0.618 Fibonacci ratio of minuette wave (i) above 1,294.73.
On the way down price should find support at the upper edge of the pink base channel drawn about minute waves i and ii. The correction for minuette wave (ii) could end here, close to the 0.382 Fibonacci ratio of minuette wave (i), or it could break through support to end lower.
When minuette wave (ii) looks like a clear three wave structure then I will expect a very strong third wave upwards to begin. At that stage the next movement for this wave count is expected to be minuette wave (iii) within minute wave iii.
Minuette wave (ii) may not move beyond the start of minuette wave (i) below 1,282.55.
This analysis is published about 04:56 p.m. EST.


