
A new low below 1,213.84 invalidated the main hourly wave count. The alternate hourly wave count allowed for downwards movement and had a target range of 1,211 – 1,206. No trend change has yet been confirmed.
Summary: The downwards structure now has a better fit. I will expect upwards movement from here for a fourth wave correction which should last at least one week, and maybe two. Minor wave 4 should be choppy and overlapping, and may include a new low. It is most likely to end about the 0.382 Fibonacci ratio of minor wave 3 at 1,250.78.
Click on charts to enlarge.
Main Wave Count
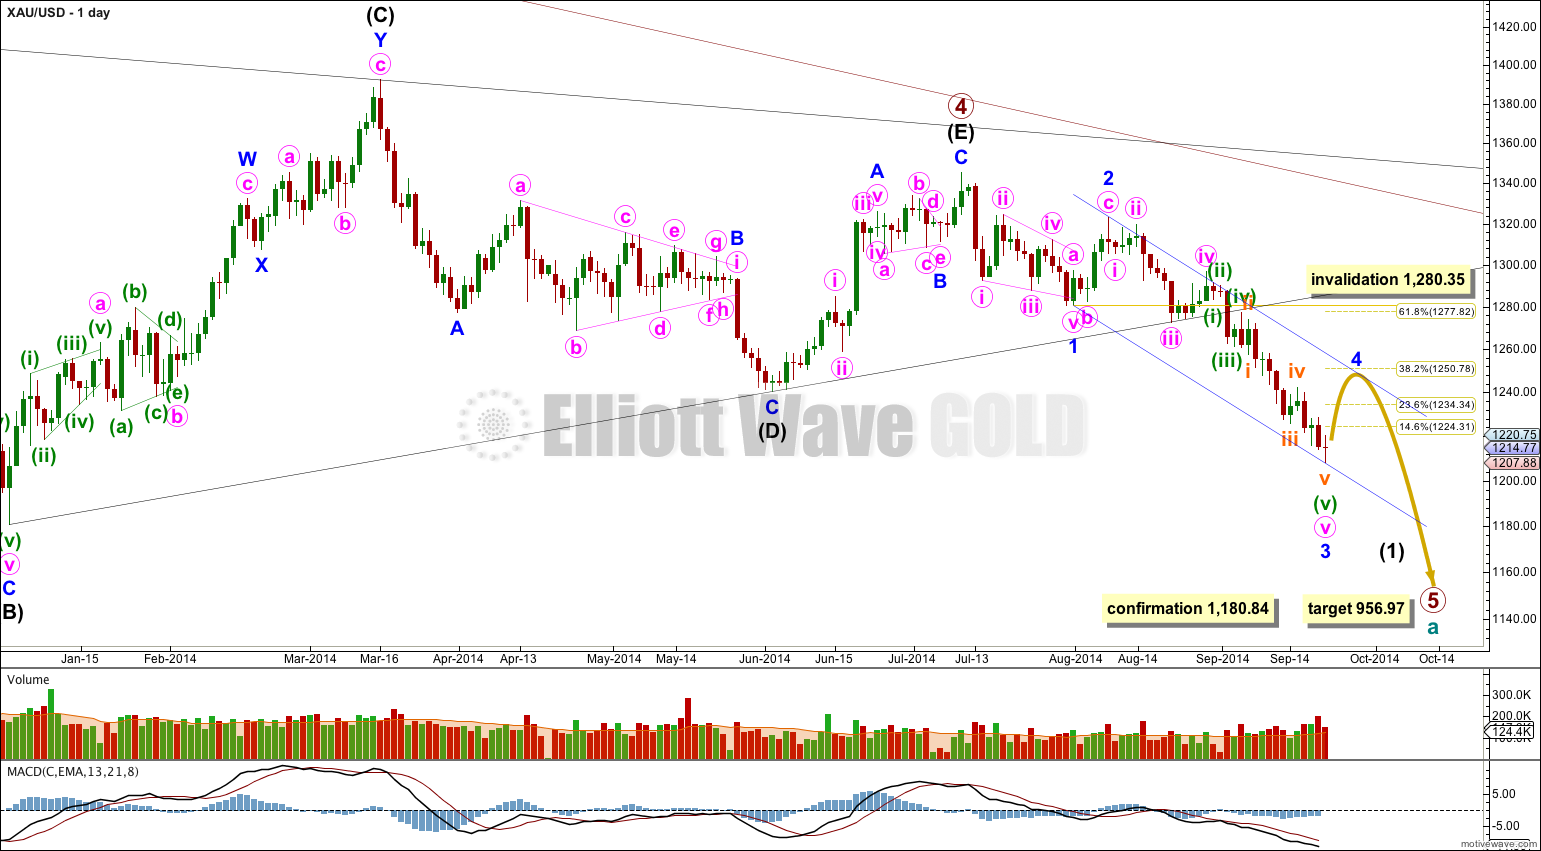
Extend the triangle trend lines of primary wave 4 outwards. The point in time at which they cross over may be the point in time at which primary wave 5 ends. This does not always work, but it works often enough to look out for. It is a rough guideline only and not definitive. A trend line placed from the end of primary wave 4 to the target of primary wave 5 at this point in time shows primary wave 5 would take a total 26 weeks to reach that point, and that is what I will expect. Primary wave 4 has begun its 11th week.
The black (B)-(D) trend line is now clearly breached on the daily chart, and also clearly breached on the weekly chart. This is significant.
At 956.97 primary wave 5 would reach equality in length with primary wave 1. Primary wave 3 is $12.54 short of 1.618 the length of primary wave 1, and equality between primary waves 5 and 1 would give a perfect Elliott relationship for this downwards movement.
However, when triangles take their time and move close to the apex of the triangle, as primary wave 4 has (looking at this on a weekly chart is clearer) the movement following the triangle is often shorter and weaker than expected. If the target at 956.97 is wrong it may be too low. In the first instance I expect it is extremely likely that primary wave 5 will move at least below the end of primary wave 3 at 1,180.40 to avoid a truncation. When intermediate waves (1) through to (4) within primary wave 5 are complete I will recalculate the target at intermediate degree because this would have a higher accuracy. I cannot do that yet; I can only calculate it at primary degree.
If minor wave 3 is over here it is 9.65 longer than 1.618 the length of minor wave 1. This variation is less than 10% the length of minor wave 3 and so I would consider it an acceptable Fibonacci ratio. Just.
Ratios within minor wave 3 are: minute wave iii is 0.98 longer than 2.618 the length of minute wave i, and minute wave v has no Fibonacci ratio to either of minute waves i or iii.
Ratios within the extended minute wave v are: there is no adequate Fibonacci ratio between minuette waves (i) and (iii), and minuette wave (v) is 2.70 short of 2.618 the length of minuette wave (iii).
Ratios within the extended minuette wave (v) are: there is no Fibonacci ratio between subminuette waves iii and i, and subminuette wave v is 1.39 short of 1.618 the length of subminuette wave i.
Movement comfortably below 1,180.84 would invalidate the alternate daily wave count below and provide further confidence in this main wave count.
I have drawn a Fibonacci retracement the length of minor wave 3. Minor wave 4 may correct up to the 0.236 at 1,234.34 (less likely) or 0.382 at 1,250.78 (more likely) Fibonacci ratio, so that there is alternation with the deep correction of minor wave 2. I expect this tendency to alternation may be stronger than a tendency for corrections following fifth wave extensions to reach up to the end of the second wave within the extended fifth wave.
Draw a channel about intermediate wave (1): draw the first trend line from the lows labeled minor waves 1 to 3, then place a copy on the high labeled minor wave 2. Minor wave 4 may find resistance and may end about the upper edge of this blue channel. This indicates minor wave 4 could last only one week / 5 days.
Main Hourly Wave Count
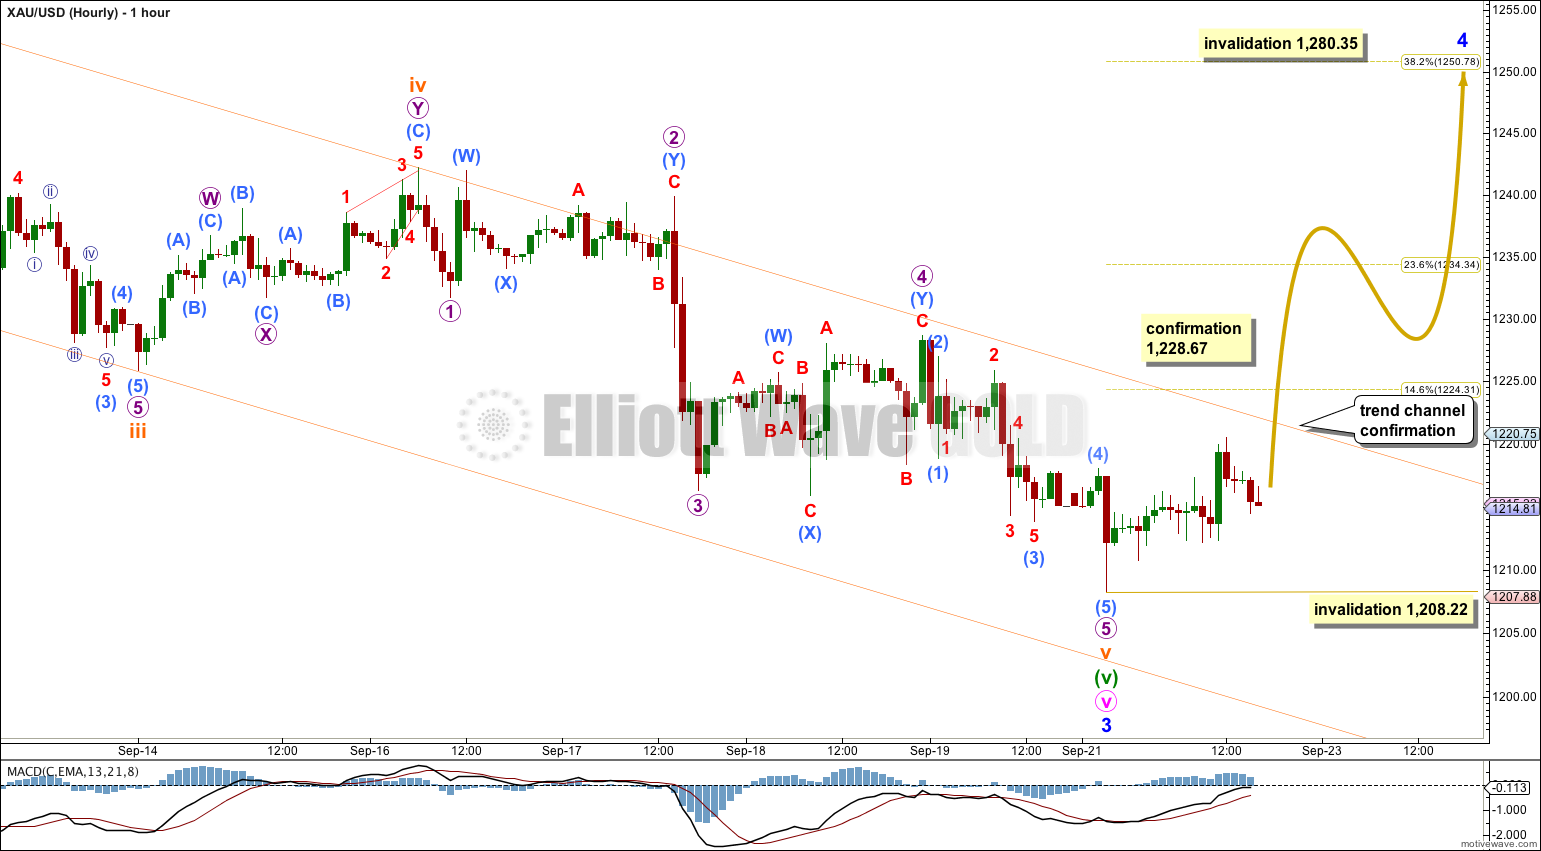
More downwards movement into the target zone for the last alternate hourly wave count has produced a better fifth wave for micro wave 5.
There are still no adequate Fibonacci ratios between micro waves 1, 3 and 5 within subminuette wave v. Micro waves 3 and 5 look like they are close to equality, but the difference of 3.11 is more than 10% the length of either. The ratio is inadequate.
The orange channel is important. Draw it from subminuette wave ii (find the high of subminuette wave ii on the daily chart, which is the green candlestick of 5th September) to subminuette wave iv then place a copy on the end of subminuette wave iii. It is essential that this trend channel is clearly breached by upwards movement before any confidence in this trend change. Only when there is at least one full hourly candlestick above this trend channel and not touching the upper trend line shall I have confidence that minor wave 3 has completed and minor wave 4 has begun.
The first movement up within minor wave 4 should be a five wave structure. Within it no second wave correction may move beyond the start of its first wave below 1,208.22.
If 1,208.22 is breached in the next 24 hours then the alternate below would be correct. While price remains within the orange channel and below 1,228.67 both wave counts will be valid.
Minor wave 4 is highly likely to show structural alternation with minor wave 2. Minor wave 2 was a deep zigzag. Minor wave 4 is most likely to be a flat, triangle or combination. At this early stage there are more than 13 possible corrective structures it may take, and it is impossible to rule out any. Expanded flats, running triangles and combinations may all included new price extremes beyond the start at 1,208.22, and so after the first upwards wave is done we may see a new low as part of minor wave 4. Analysis must be very flexible and I will have alternate wave counts regularly, plus the wave count will change as this correction unfolds. It should last at least one week and most likely be longer, maybe about two weeks, because sideways moving corrective structures are normally more long lasting than brief zigzags.
Alternate Hourly Wave Count
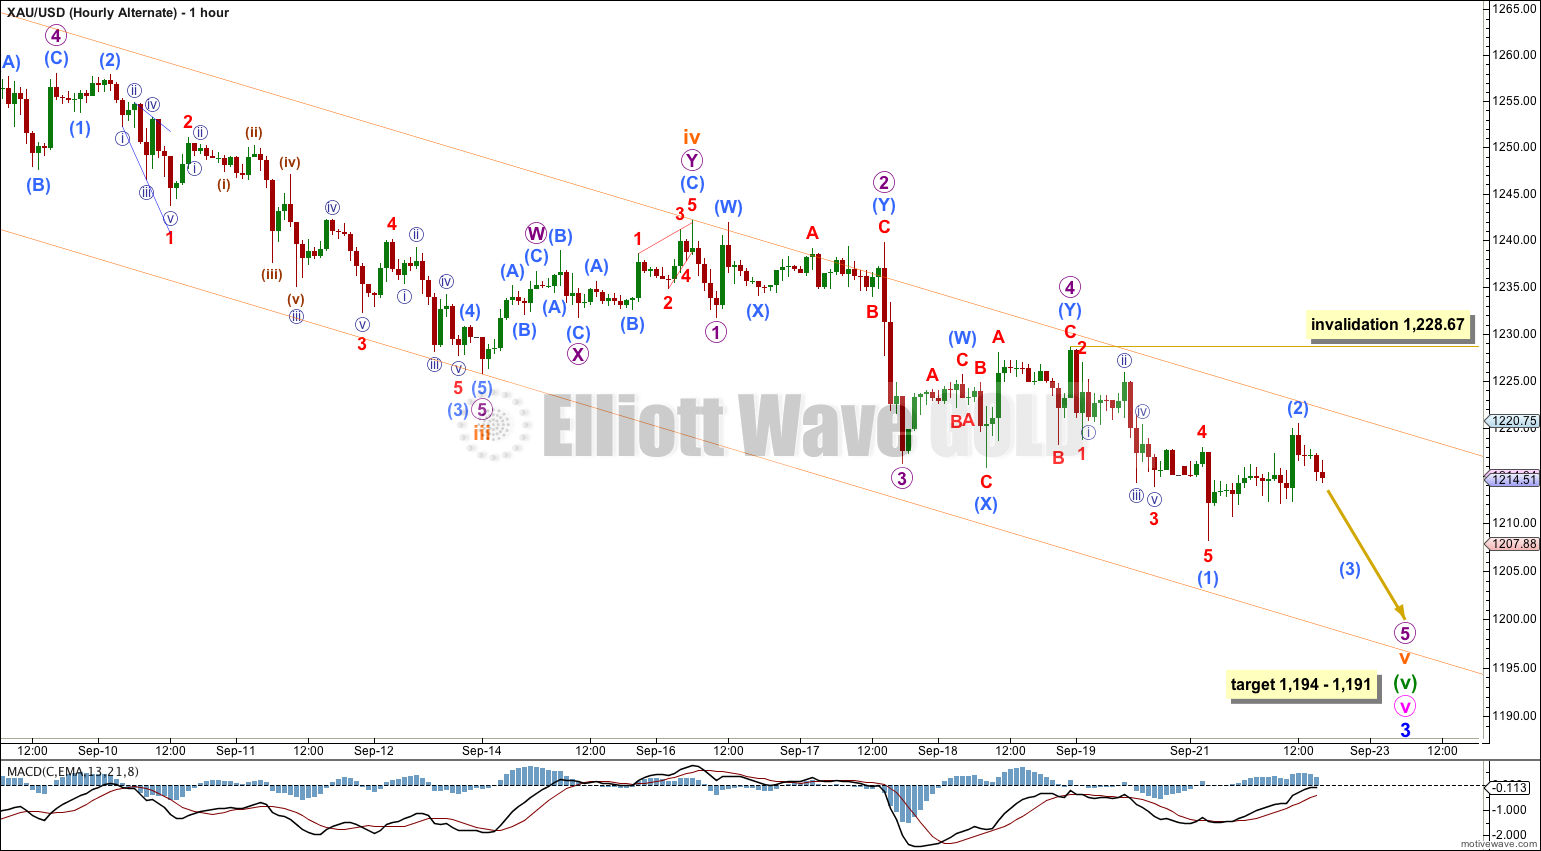
By simply moving the degree of labeling within the final fifth wave down one degree it is possible that we may see more downwards movement.
At 1,191 micro wave 5 would reach 1.618 the length of micro wave 3.
At 1,194 subminuette wave v would reach equality in length with subminuette wave iii.
This alternate wave count has a very low probability; I would judge it to be as low as 5% today. There is clear double divergence between price trending lower and MACD trending up between the end of minuette wave (iii) and the end of micro wave 3 within subminuette wave v. This strong double divergence indicates a trend change at this point, and does not support this alternate wave count. I expect it to be invalidated within the next 24 hours.
Alternate Wave Count
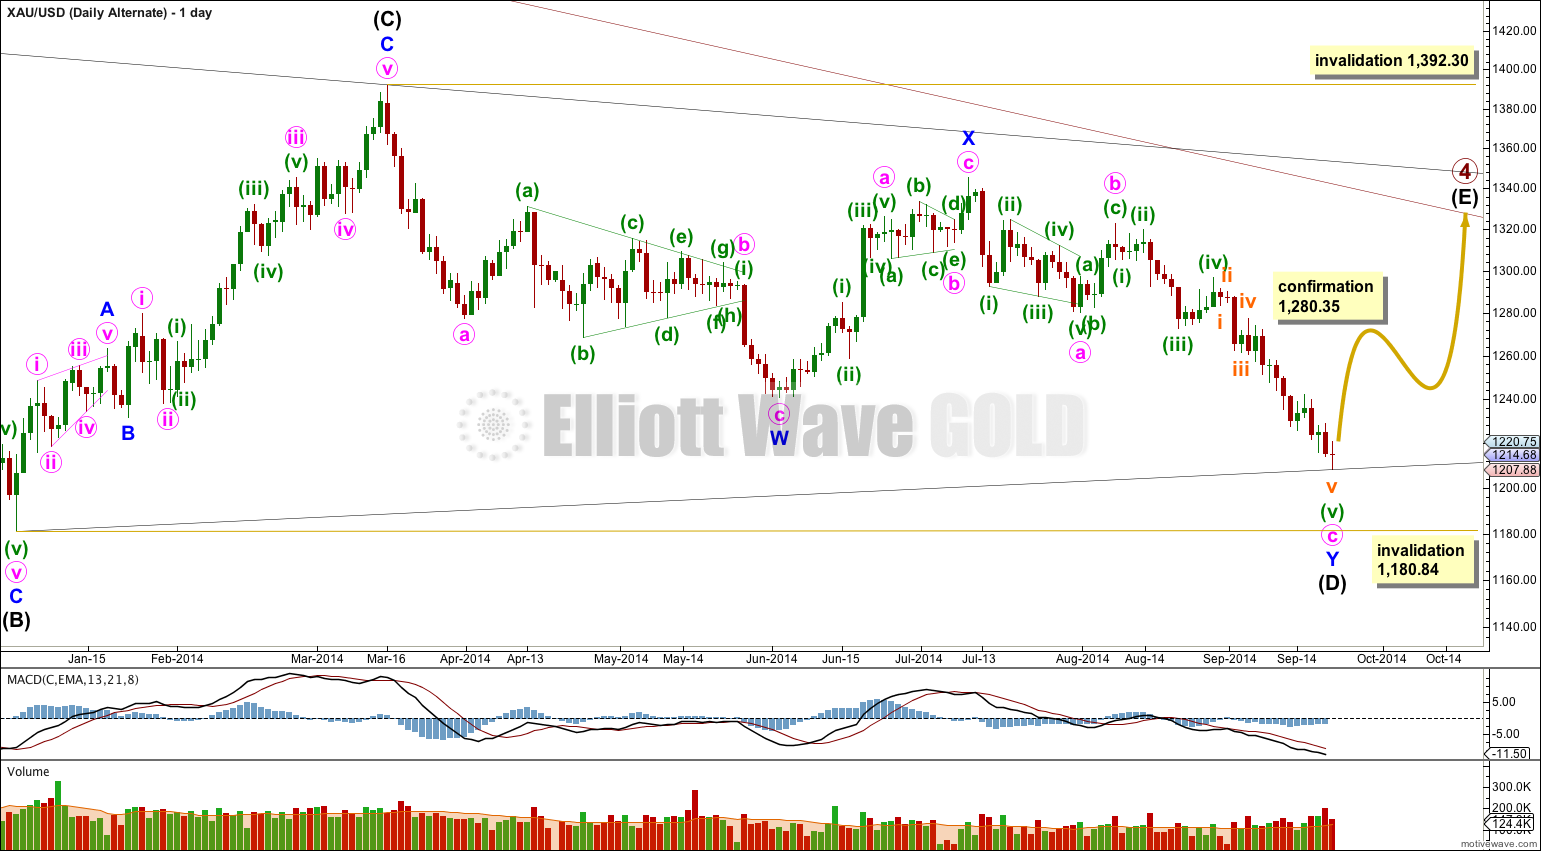
I would judge this wave count to have a very low probability only because of proportion between primary waves 2 and 4. The main wave count sees them almost exactly of the same duration, with primary wave 2 lasting 53 weeks and primary wave 4 lasting 54 weeks. This alternate would see primary wave 4 as much longer in duration than primary wave 2. It is the proportion between second and fourth waves within an impulse which gives the wave count what is called the “right look”. This alternate would still have the right look, but it would not look as good as the main wave count.
If intermediate wave (D) continued further it could only be as a double zigzag. For a contracting triangle intermediate wave (D) may not move beyond the end of intermediate wave (B) below 1,180.84. For a barrier triangle intermediate wave (D) should end about the same level as intermediate wave (B), as long as the (B)-(D) trend line is essentially flat. In practice this means that intermediate wave (D) could end slightly below 1,180.84 and the wave count would remain valid. Unfortunately, this invalidation point is not black and white.
If intermediate wave (D) is a double zigzag, then intermediate wave (C) must be seen as a single zigzag because only one of the five subwaves of a triangle may be a double.
It is possible to see intermediate wave (C) as a zigzag, but to do so a rather obvious triangle must be ignored after the end of minor wave A. The main wave count sees a triangle in that position. I think this reduces the probability of this alternate.
Within intermediate wave (C) the subdivision within minuette wave (i) of minute wave iii of minor wave C is problematic. On the hourly chart this upwards wave subdivides as a double zigzag and does not fit well at all as a five wave structure. This is another reason why I would prefer a wave count which sees a triangle in that position because the subdivisions of those waves fit a triangle perfectly. This further reduces the probability of this alternate.
This alternate wave count does not diverge from the main wave count at this stage, and will not diverge for another one or two weeks. The main wave count expects downwards movement to complete minor wave 3 and this alternate expects downwards movement to complete minute wave c. Thereafter, the main wave count would expect upwards movement for minor wave 4 and this alternate wave count would expect upwards movement for intermediate wave (E). If at that stage price moves above 1,280.35 for that upwards movement then the main wave count would be invalidated and this alternate confirmed.
Intermediate wave (E) of a contracting or barrier triangle may not move beyond the end of intermediate wave (C) at 1,392.30.
This analysis is published about 05:59 p.m. EST.