
Upwards movement was expected for the first hourly chart, sideways movement was expected for the second, and there are still three possible Elliott wave structures which may be unfolding.
Summary: This correction is incomplete and may either move higher to 1,251 – 1,253 or may move sideways for a few more days. When correction is complete the breakout should be downwards. I now expect this fourth wave correction may end next Thursday.
Click on charts to enlarge.
Main Wave Count
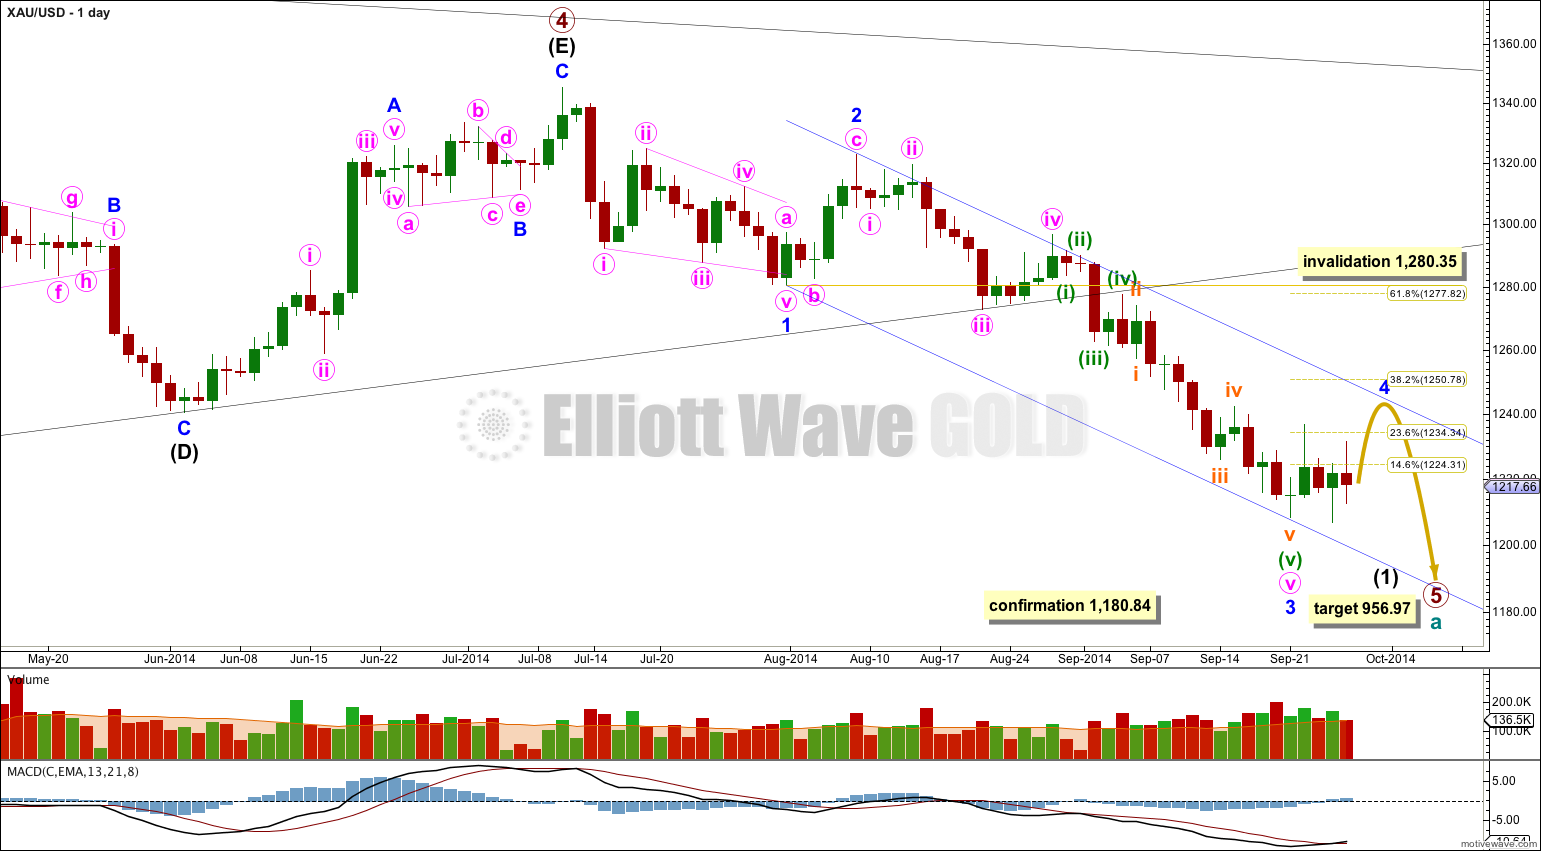
On the weekly chart extend the triangle trend lines of primary wave 4 outwards. The point in time at which they cross over may be the point in time at which primary wave 5 ends. This does not always work, but it works often enough to look out for. It is a rough guideline only and not definitive. A trend line placed from the end of primary wave 4 to the target of primary wave 5 at this point in time shows primary wave 5 would take a total 26 weeks to reach that point, and that is what I will expect. Primary wave 5 has begun its 11th week.
The black (B)-(D) trend line is now clearly breached on the daily chart, and also clearly breached on the weekly chart. This is significant.
At 956.97 primary wave 5 would reach equality in length with primary wave 1. Primary wave 3 is $12.54 short of 1.618 the length of primary wave 1, and equality between primary waves 5 and 1 would give a perfect Elliott relationship for this downwards movement.
However, when triangles take their time and move close to the apex of the triangle, as primary wave 4 has (looking at this on a weekly chart is clearer) the movement following the triangle is often shorter and weaker than expected. If the target at 956.97 is wrong it may be too low. In the first instance I expect it is extremely likely that primary wave 5 will move at least below the end of primary wave 3 at 1,180.40 to avoid a truncation. When intermediate waves (1) through to (4) within primary wave 5 are complete I will recalculate the target at intermediate degree because this would have a higher accuracy. I cannot do that yet; I can only calculate it at primary degree.
Minor wave 3 is $9.65 longer than 1.618 the length of minor wave 1. This variation is less than 10% the length of minor wave 3 and so I would consider it an acceptable Fibonacci ratio. Just.
Movement comfortably below 1,180.84 would invalidate the alternate daily wave count below and provide further confidence in this main wave count.
I have drawn a Fibonacci retracement the length of minor wave 3. Minor wave 4 has already reached up to the 0.236 at 1,234.34, and may yet move higher to the 0.382 at 1,250.78 Fibonacci ratio, so that there is alternation with the deep correction of minor wave 2. I expect this tendency to alternation may be stronger than a tendency for corrections following fifth wave extensions to reach up to the end of the second wave within the extended fifth wave.
Draw a channel about intermediate wave (1): draw the first trend line from the lows labeled minor waves 1 to 3, then place a copy on the high labeled minor wave 2. Minor wave 4 may find resistance and may end about the upper edge of this blue channel. If it overshoots the channel it should find some resistance at the upper blue trend line before breaking above it.
There is a nice morning doji star on this daily chart which supports this wave count. A morning doji star is a bottom reversal pattern, indicating the prior bear trend of minor wave 3 should change to a new trend. This new trend may be either upwards or sideways, and the wave count expects it is sideways.
There are still three structural possibilities for this fourth wave correction; a flat, a triangle or a combination. If fourth wave correction continues for another four days / sessions it may end in a total Fibonacci eight days, next Thursday. This expectation is now the same for all three hourly wave counts.
All three hourly wave counts below are viable and all three scenarios must be considered.
Hourly Wave Count – Flat
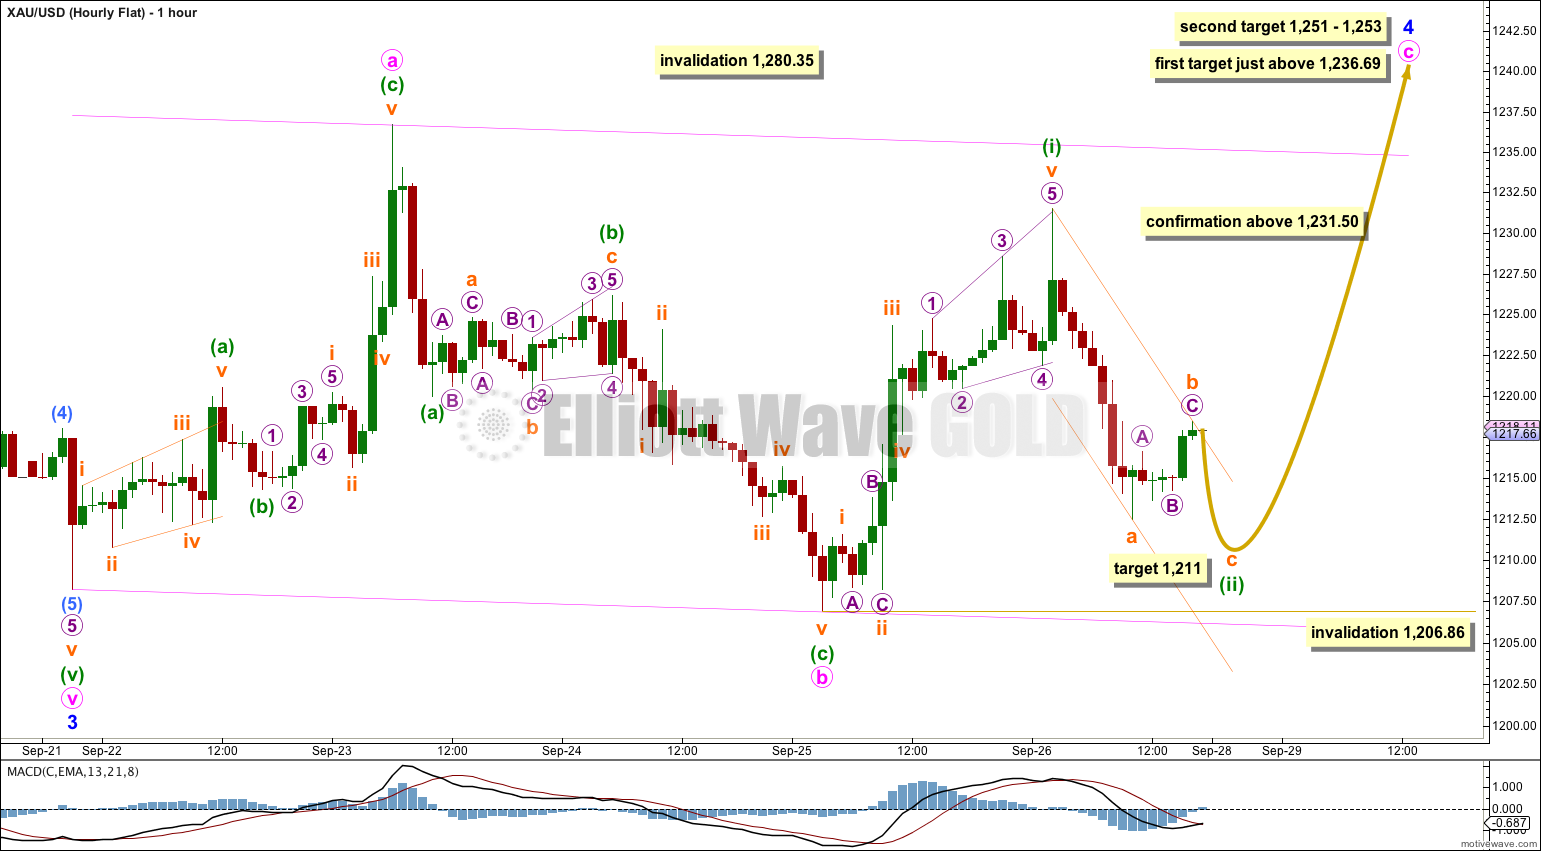
Although price moved overall lower for Friday’s session this wave count has the best fit and still has the highest probability.
The upwards movement of minuette wave (i) fits best as a five wave impulse. The ending expanding diagonal of subminuette wave v fits perfectly. However, there are no adequate Fibonacci ratios between subminuette waves i, iii and v.
Minuette wave (ii) is an incomplete zigzag. At 1,211 subminuette wave c would reach 0.382 the length of subminuette wave a. If subminuette wave b moves higher this target must be recalculated.
I have drawn a small channel about the incomplete zigzag of minuette wave (ii). After the structure is complete with some downwards movement then a breach of this channel with upwards movement would provide confirmation that minuette wave (ii) is over and minuette wave (iii) upwards should have begun.
Importantly, this wave count expects to see a third wave up begin on Monday. Minuette wave (iii) must make a new high above the end of minuette wave (i) at 1,231.50 and should show an increase in upwards momentum.
Movement above 1,231.50 would invalidate the triangle wave count and provide some confidence in this flat wave count.
Minute wave c of a flat correction is extremely likely to move at least slightly above the end of minute wave a at 1,236.69 to avoid a truncation and a very rare running flat.
At 1,253 minute wave c would reach 1.618 the length of minute wave a. This is just $2 above the 0.618 Fibonacci ratio of minor wave 3 at 1,251.
Minuette wave (ii) may not move below the start of minuette wave (i) at 1,206.86.
Hourly Wave Count – Triangle
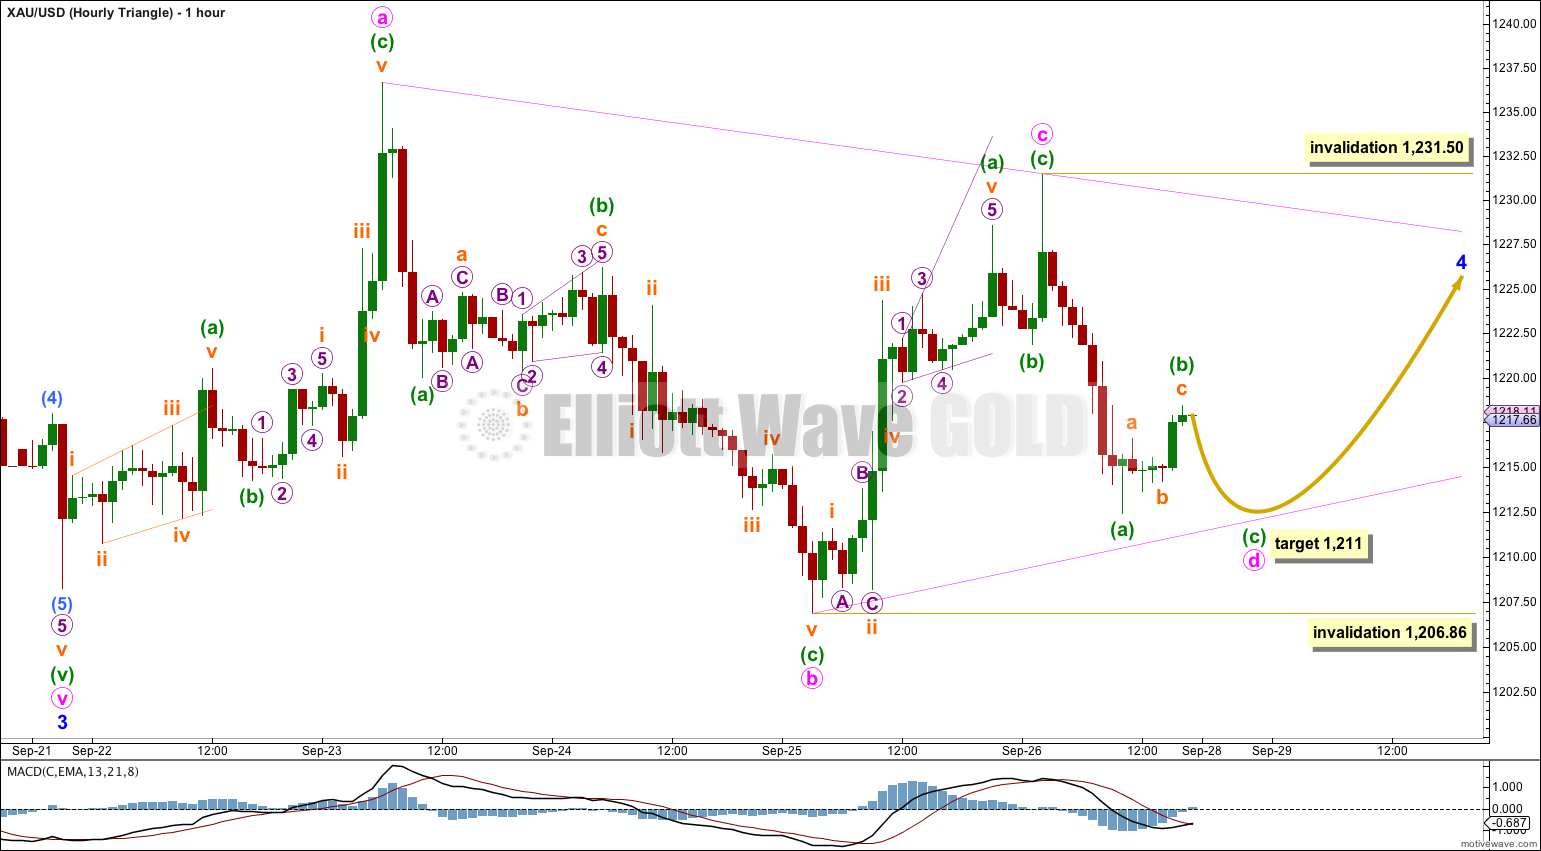
Minor wave 4 may still be unfolding as a triangle.
Within it minute wave b is a 105% correction of minute wave a and minute wave c is a 83% correction of minute wave b.
The target for minute wave d to end is at 1,211 where minuette wave (c) would reach 0.382 the length of minuette wave (a).
For a contracting triangle minute wave d may not move beyond the end of minute wave b at 1,206.86. For a barrier triangle minute wave d may end about the same level as minute wave b as long as the b-d trend line remains essentially flat. In practice this means minute wave d may end slightly below 1,206.86 and this invalidation point is not black and white.
Minute wave e must subdivide as a three or a triangle and it may not move beyond the end of minute wave c for a contracting or barrier triangle. The upper invalidation point at 1,231.50 is black and white. Minute wave e would likely end short of the a-c trend line and must subdivide as a corrective structure, either a single or double zigzag, or possibly a triangle so that minor wave 4 could be a nine wave triangle.
This triangle idea and the combination below see the upwards wave labelled here minute wave c as a zigzag. This does not have as good a fit was the flat correction seeing that movement as a five wave impulse.
Hourly Wave Count – Combination
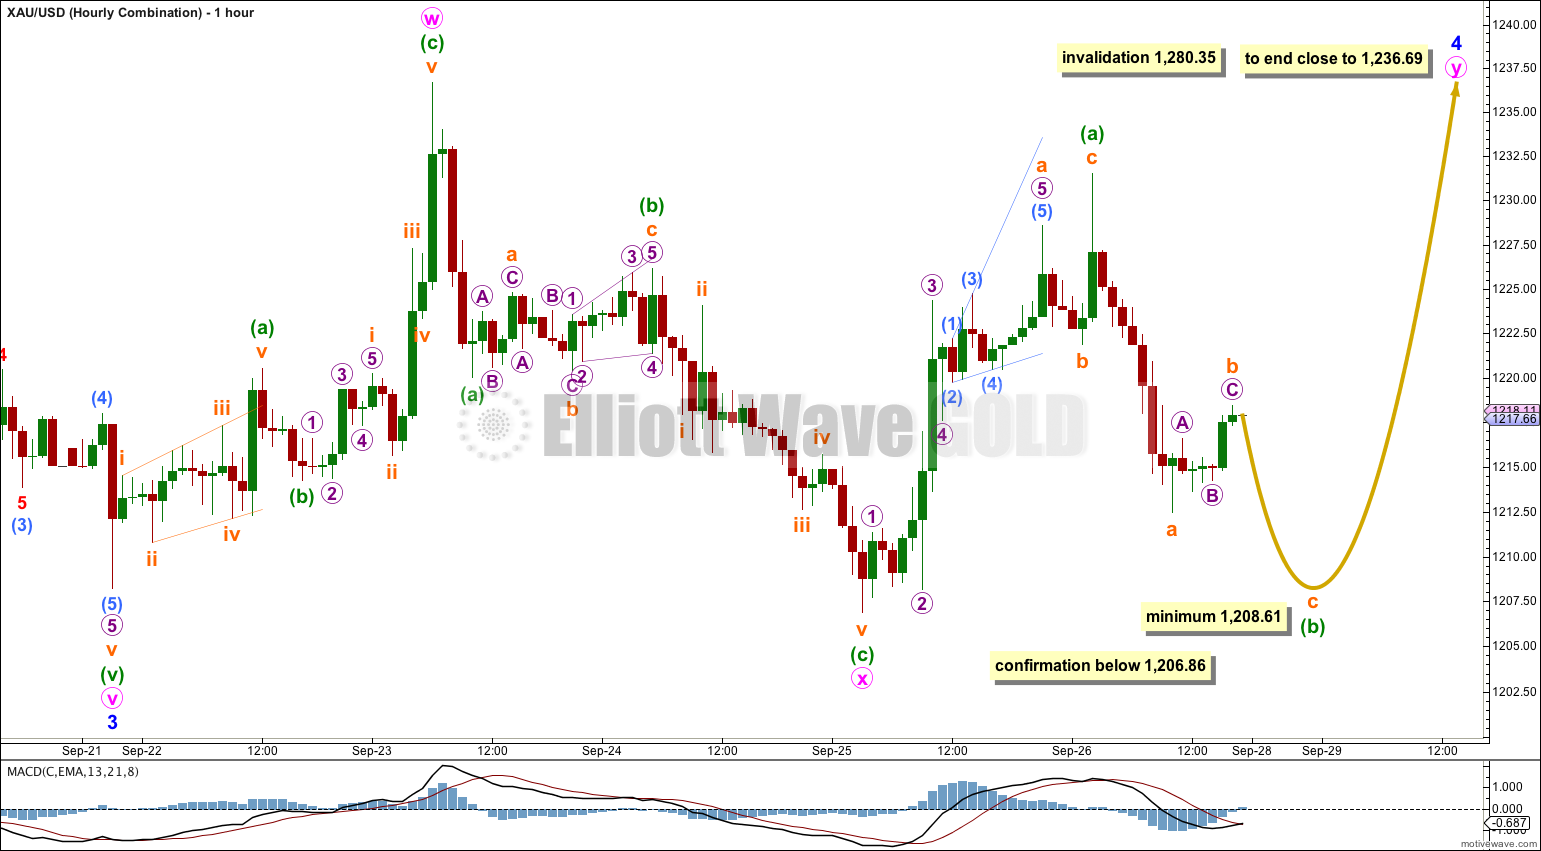
At this stage a combination is also entirely possible.
The first structure in the double combination was a zigzag labeled minute wave w. The double is joined by a three, a zigzag, in the opposite direction labeled minute wave x. The second structure in the double combination may only be either a flat or triangle labeled minute wave y.
Minute wave y looks like it would most likely be a flat correction.
Within the flat correction minuette wave (b) must reach a minimum 90% length of minuette wave (a) at 1,208.61. Minuette wave (b) may move beyond the start of minuette wave (a) below 1,206.86. Movement below 1,206.86 is not required for this wave count, but if it happens the first two wave counts would be invalidated and this third option of a combination would be the only wave count for this correction.
The purpose of double combinations is to move price sideways and take up time. The second structure in the double normally ends close to the end of the first structure. Minute wave y would be expected to end close to 1,236.69.
This analysis is published about 08:23 p.m. EST.