
Movement below 1,273.03 has invalidated the main Elliott wave count and confirmed the alternate. The situation is now clear. Elliott wave analysis will now focus on targets for this new trend.
Summary: The long term target is 956.97 which may be met in another 18 weeks. The short term target is 1,2180 which may be met in a couple of days or within a week.
Click on charts to enlarge.
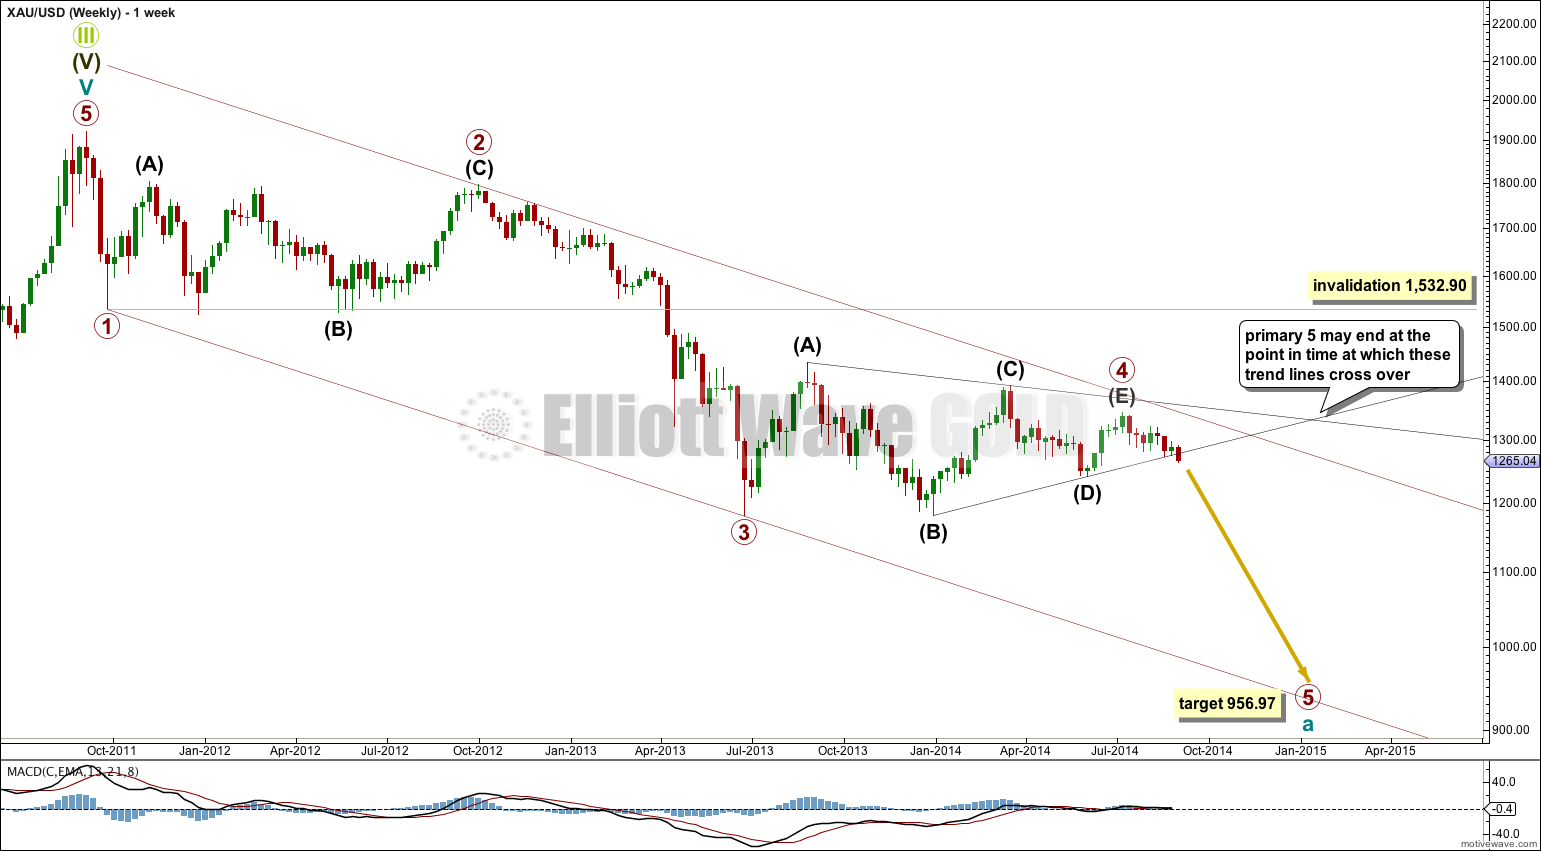
So far since the all time high at 1,921.15 in September 2011 Gold has moved lower in four waves. The final fifth wave down is underway.
Primary wave 3 is $12.54 short of 1.618 the length of primary wave 1. At 956.97 primary wave 5 would reach equality in length with primary wave 1. This is the most likely relationship between first and fifth waves, so this target has the highest probability.
Primary wave 2 was a deep 68% rare running flat correction. Primary wave 4 shows alternation in depth and structure with a shallow 27% regular contracting triangle.
Draw a trend channel about this downwards impulse on the weekly chart and copy it over to the daily chart: draw the first trend line from the lows of primary waves 1 to 3, then place a parallel copy on the high of primary wave 2. I would expect downwards movement for primary wave 5 to find support, and maybe end, at the lower trend line.
Extend the triangle trend lines of primary wave 4 outwards. The point in time at which they cross over may be the point in time at which primary wave 5 ends. This does not always work, but it works often enough to look out for. It is a rough guideline only and not definitive. A trend line placed from the end of primary wave 4 to the target of primary wave 5 at this point in time shows primary wave 5 would take a total 26 weeks to reach that point, and that is what I will expect. So far primary wave 5 has lasted 8 weeks.
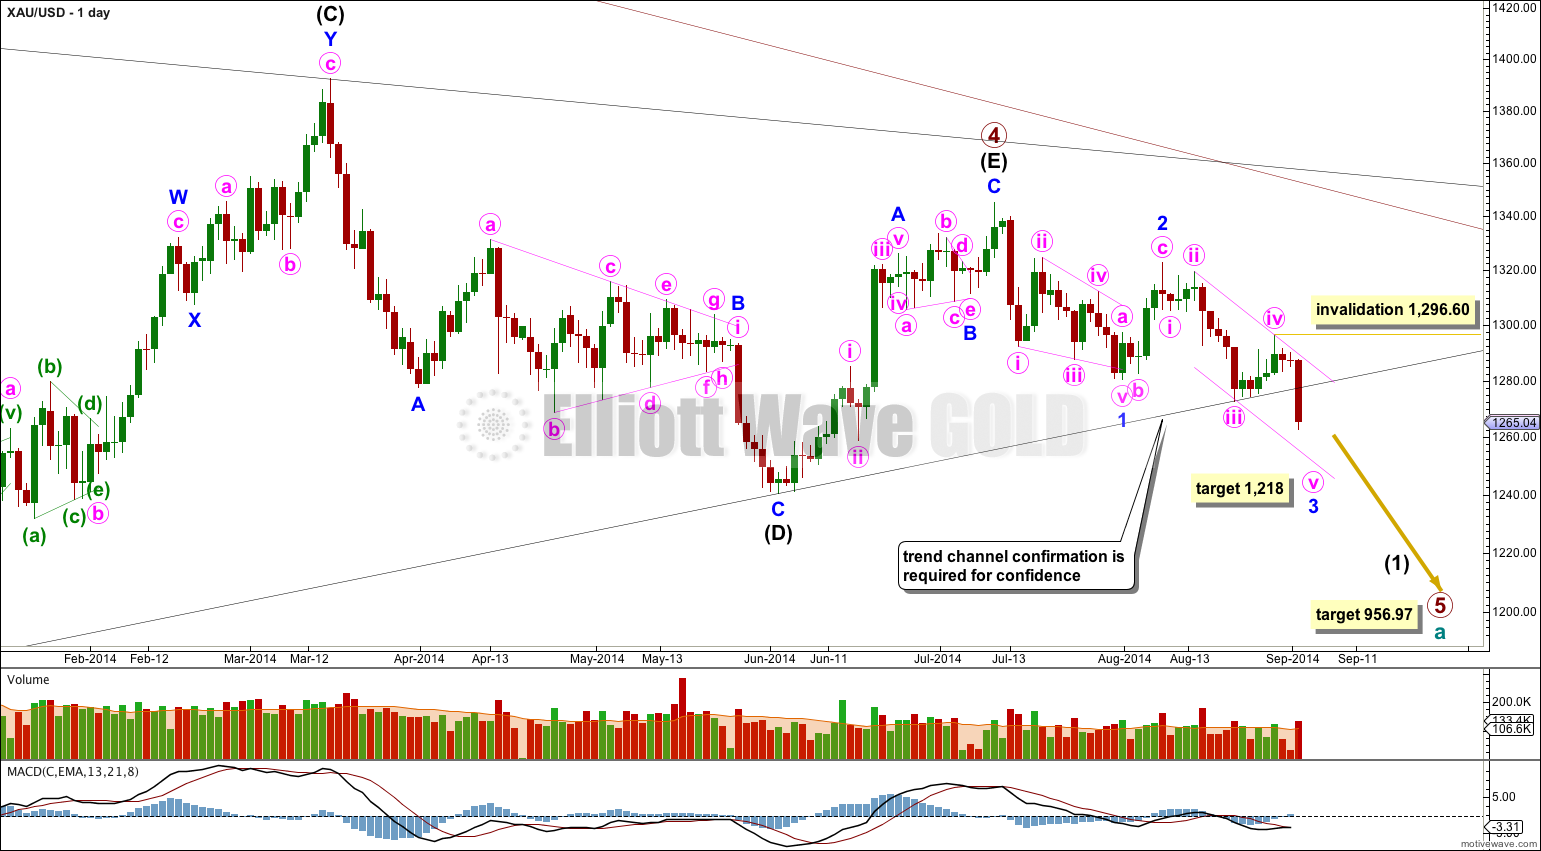
The black (B)-(D) trend line is overshot. If in one more trading day there is a full daily candlestick below the trend line and not touching it then I will have 100% confidence in this wave count.
Minor wave 1 is a leading contracting diagonal. This was followed by a somewhat deep correction, a zigzag for minor wave 2.
At 1,218 minor wave 3 would reach 1.618 the length of minor wave 1. I am recalculating this target for minor wave 3 to end because it is best calculated at minor degree than minute. Because there is already a close ratio of 2.618 between minute waves i and iii we may not see a Fibonacci ratio between minute wave v and either of i or iii.
This target expects an extended fifth wave for minute wave v to complete minor wave 3, which is common for Gold and commodities.
I will have to adjust my expectations of behaviour following triangles for Gold. Clearly the triangle of primary wave 4 is over, even though the (B)-(D) trend line provided very strong support right before it was breached. This does not always happen (on the other three examples of triangles on this daily chart it did not happen) but sometimes it does. Balancing and judging all the evidence is required to determine probability, and when low probability outcomes occur they are never what you expected as most likely to happen.
Within minute wave v no second wave correction may move beyond its start above 1,296.60.
In the next few days I may move the degree of labeling within minute wave v all down one degree. So far it looks like the middle of a third wave has passed; this may be the middle of minute wave v or it may only be the middle of minuettte wave (i) within minute wave v. Either way, the structure to the downside is incomplete and requires more downwards movement.
Minute wave iii is just 0.68 longer than 2.618 the length of minute wave i. With such a close Fibonacci ratio between those two waves I would not expect it to be highly likely that minute wave v would exhibit a Fibonacci ratio to either of minute waves i or iii. The target at 1,218 may be recalculated or widen to a small zone when I can add to the calculation at minuette wave degree. When minuette waves (iii) and (iv) within minute wave v are complete I can do this.
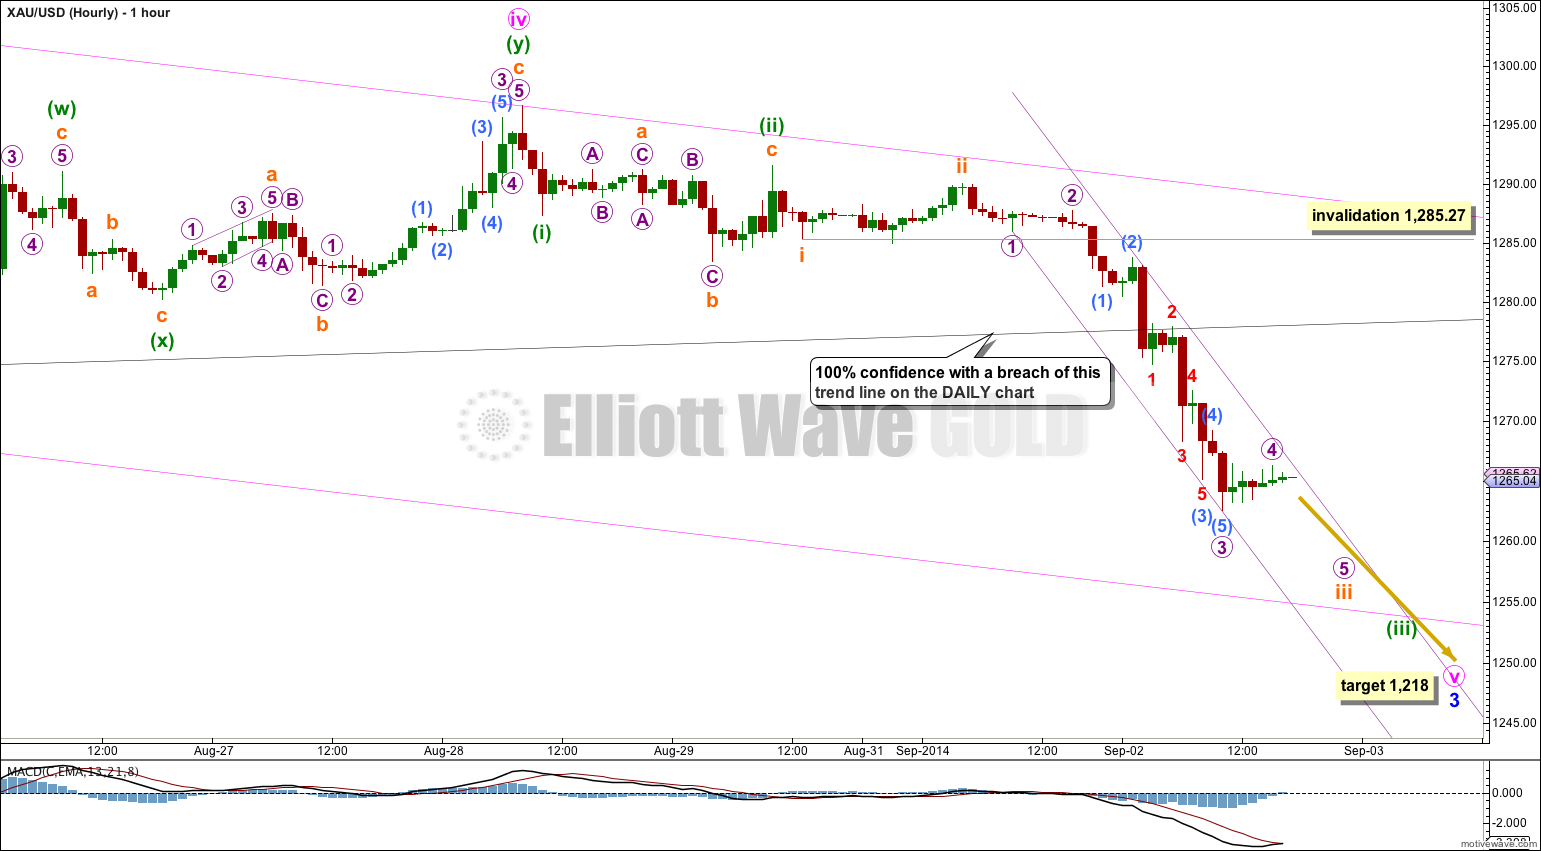
I would expect downwards movement to find support at the lower edge of the pink channel copied over here from the daily chart. I would expect upwards corrections along the way down, if they are very deep, to find strong resistance at the black (B)-(D) trend line. This trend line will still be useful so keep copying it over carefully to the hourly chart.
So far within downwards movement there is no Fibonacci ratio between micro waves 1 and 3.
Ratios within micro wave 3 are: there is no Fibonacci ratio between submicro wave (3) and (1), and submicro wave (5) is just 0.41 short of equality with submicro wave (1).
Ratios within submicro wave (3) are: minuscule wave 3 is 0.55 longer than equality with minuscule wave 1, and minuscule wave 5 has no Fibonacci ratio to either of minuscule waves 3 or 1.
Along the way down small fourth wave corrections should unfold. Each fourth wave correction is most likely to end within the price territory the the fourth wave correction immediately prior, one degree lower. The downwards wave should have a “stepping down” look to it.
I have drawn a best fit channel about this recent downwards movement. When the upper edge of that channel is breached I would expect it to be breached by subminuette wave iv. Subminuette wave iv may not move into subminuette wave i price territory above 1,285.27.
This analysis is published about 06:06 p.m. EST.