
Upwards movement continues as expected. Momentum has not yet shown an increase, and both hourly Elliott wave counts are still valid.
Summary: Upwards movement should continue in the short term to about 1,243 – 1,245. Thereafter, we may see a few days of downwards or sideways movement for a B wave. If upwards momentum increases in the next 24 hours then the following B wave may not be as deep.
Click on charts to enlarge.
Main Wave Count
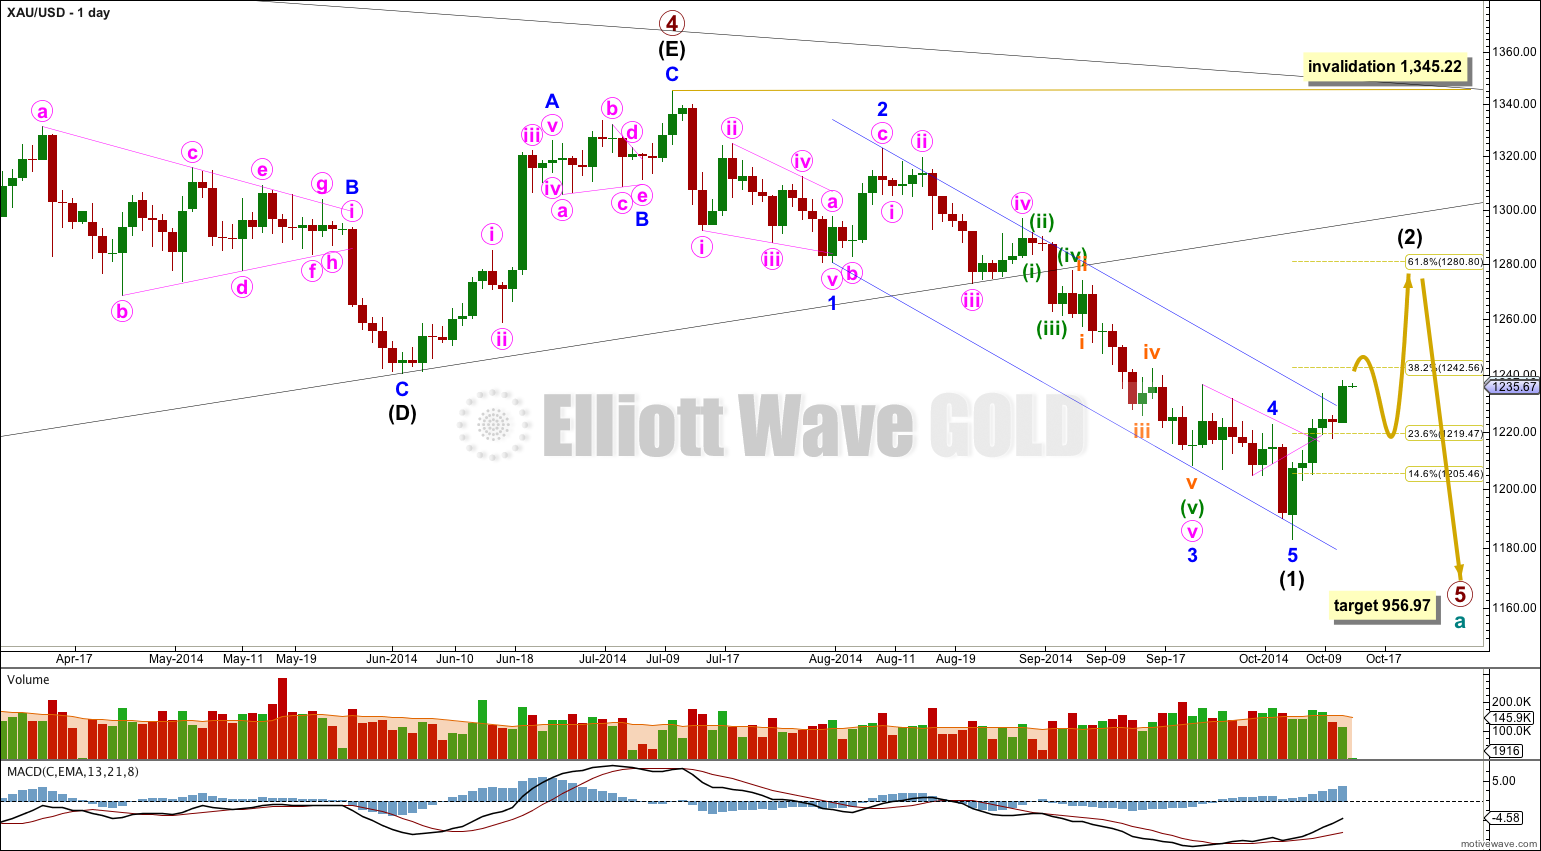
On the weekly chart extend the triangle trend lines of primary wave 4 outwards. The point in time at which they cross over may be the point in time at which primary wave 5 ends. This does not always work, but it works often enough to look out for. It is a rough guideline only and not definitive. A trend line placed from the end of primary wave 4 to the target of primary wave 5 at this point in time shows primary wave 5 would take a total 26 weeks to reach that point, and that is what I will expect. Primary wave 5 is starting its 14th week.
At 956.97 primary wave 5 would reach equality in length with primary wave 1. Primary wave 3 is $12.54 short of 1.618 the length of primary wave 1, and equality between primary waves 5 and 1 would give a perfect Elliott relationship for this downwards movement.
However, when triangles take their time and move close to the apex of the triangle, as primary wave 4 has, the movement following the triangle is often shorter and weaker than expected, and this is my main reason for presenting the alternate wave count to you. If the target at 956.97 is wrong it may be too low. In the first instance I expect it is extremely likely that primary wave 5 will move at least below the end of primary wave 3 at 1,180.40 to avoid a truncation. When intermediate waves (1) through to (4) within primary wave 5 are complete I will recalculate the target at intermediate degree because this would have a higher accuracy. I cannot do that yet; I can only calculate it at primary degree.
Movement comfortably below 1,180.84 would provide further confidence in this main wave count as at that stage an alternate idea which sees primary wave 4 as continuing as a barrier triangle would be invalidated.
Draw a channel about intermediate wave (1): draw the first trend line from the lows labeled minor waves 1 to 3, then place a copy on the high labeled minor wave 2. The slight overshoot of the lower edge of this channel indicates minor wave 5 may be over there. Intermediate wave (2) has just breached upper edge of this channel, and this trend line is now providing support.
Intermediate wave (2) may end close to a Fibonacci ratio of intermediate wave (1). Only because second waves are more commonly deep than shallow is the 0.618 ratio at 1,280.80 slightly favoured. But it does not have to be this deep. When I know where minor waves A and B within this correction have ended then a target should be calculated using the ratio between minor waves A and C.
Intermediate wave (2) is most likely to be a zigzag, but it may also be one of several other possible corrective structures. While the first 5-3-5 up unfolds no second wave correction nor B wave may move beyond its start below 1,183.06.
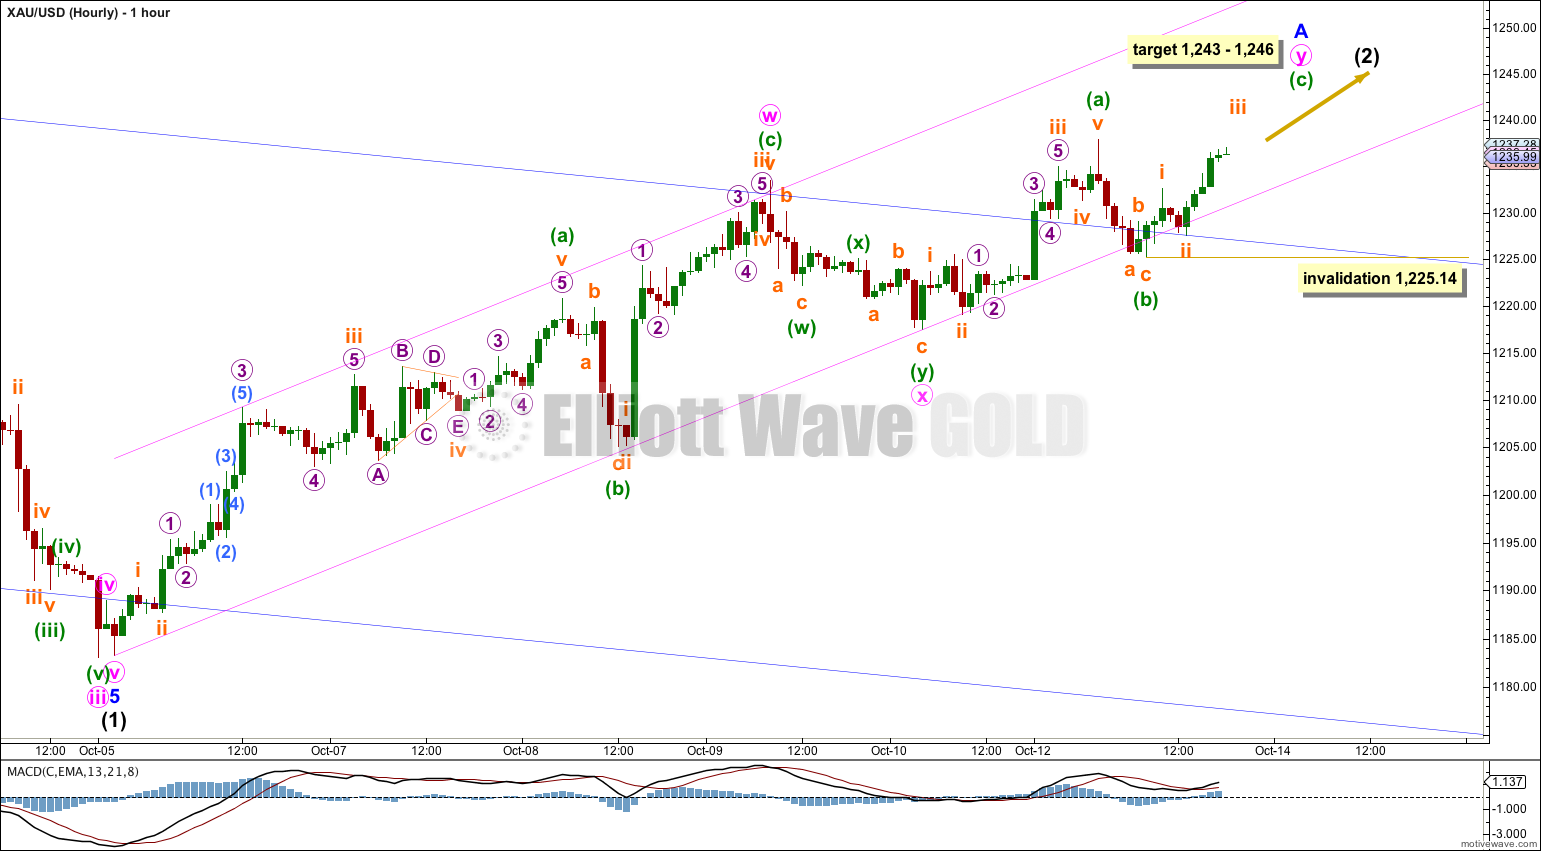
Because momentum has not shown an increase, and because downwards corrections are slightly breaching the lower edge of this pink channel, I am swapping the hourly wave counts over today. It looks like minor wave A is not unfolding as an impulse, but is unfolding as a “three”. This structure so far fits best as a double zigzag. Today I would judge this main hourly wave count to have about a 55% probability.
At 1,246 minuette wave (c) within the second zigzag would reach equality in length with minuette wave (a). At 1,243 minor wave A would end about the 0.382 Fibonacci ratio of intermediate wave (1) seen on the daily chart. This gives a $2 target zone for this current upwards wave to end.
If minor wave A subdivides as a three wave structure that indicates a flat correction may be unfolding for intermediate wave (2). A flat correction requires the following B wave down to be a minimum 90% length of minor wave A, and minor wave B may make a new low below the start of minor wave A at 1,183.22.
If my analysis of minor wave A is correct as a double zigzag then this would rule out a combination for intermediate wave (2) because the first structure within a combination which would be labeled minor wave W may only be a simple A-B-C correction, and may not itself subdivide as as a multiple W-X-Y. When this upwards movement ends and is confirmed as complete with a clear breach of the pink channel I will carefully look to see if it could be a simple A-B-C.
Within minuette wave (c) no second wave correction may move beyond its start below 1,225.14. When minuette wave (c) can be seen as a complete five wave structure then this invalidation point no longer applies and a new low would be possible.
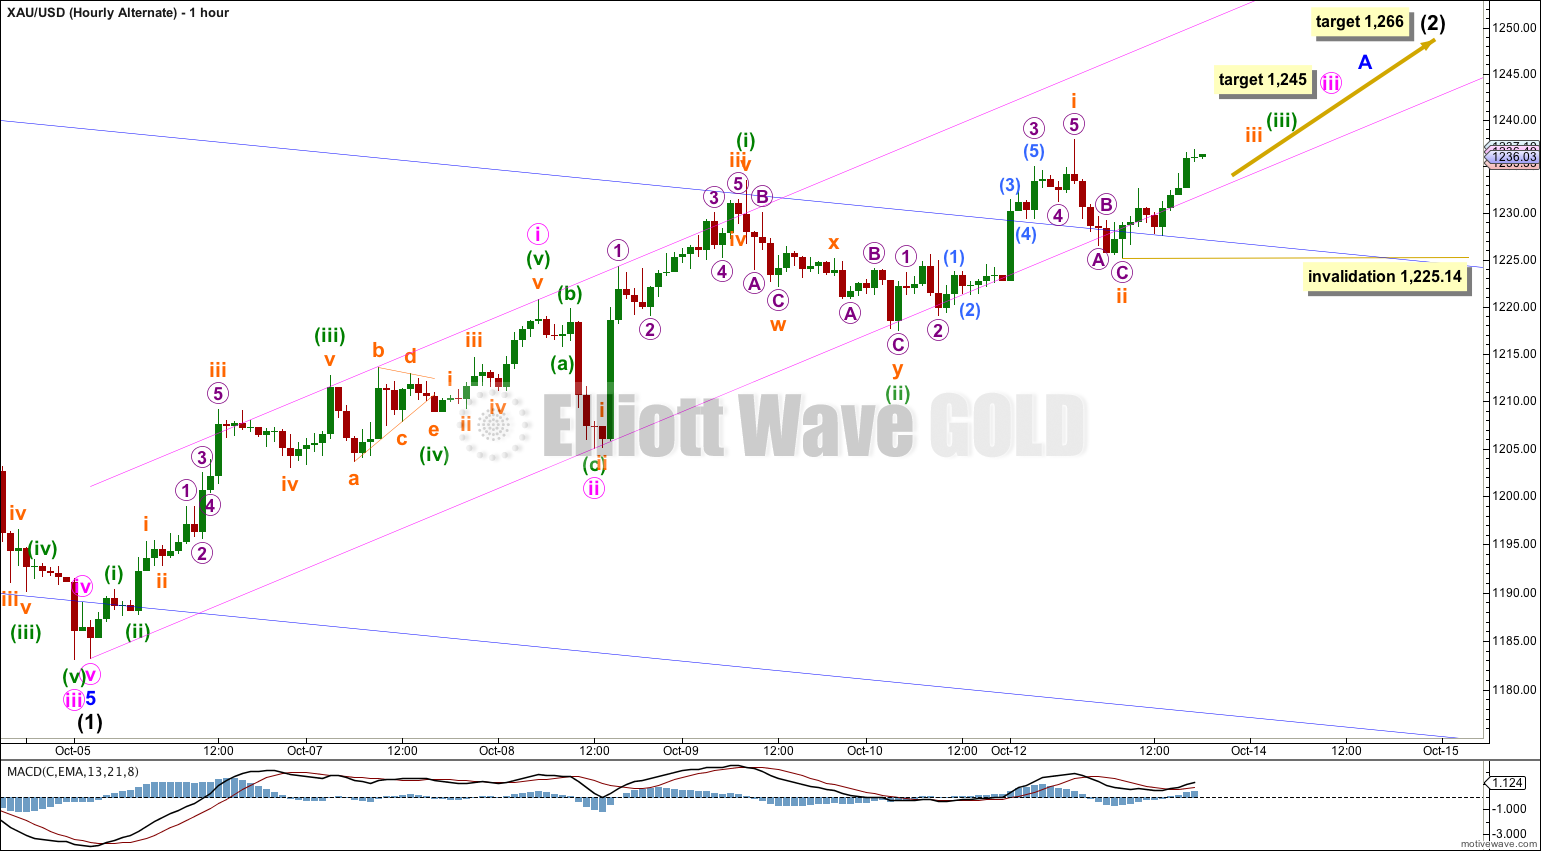
It is still possible that minor wave A is subdividing as a simple impulse, which would indicate intermediate wave (2) may be a zigzag.
Sometimes when third waves extend they begin with a series of overlapping first and second waves which do not show an increase in momentum, and that increase is not seen until the middle of the third wave arrives.
The pink channel drawn here is a base channel about minute waves i and ii. The channel is overshot (not yet breached, there is not yet a candlestick below the channel) and this indicates weakness in this upwards movement. For this reason I expect this wave count has slightly reduced in probability today. I would judge it to have about a 45% probability.
At 1,245 minute wave iii would reach 1.618 the length of minute wave i. If upwards movement shows an increase in momentum beyond that seen for minute wave i then this wave count should be preferred.
When minute wave iii is a complete five wave structure then the following downwards movement for minute wave iv may not move back into minute wave i price territory below 1,220.80. At that point in time this is the price point which will differentiate this alternate from the main hourly wave count; the main wave count would require movement below this point and this alternate would be invalidated by movement below this point.
At this stage while subminuette wave iii is unfolding no second wave correction may move below its start at 1,225.14.
Alternate Wave Count
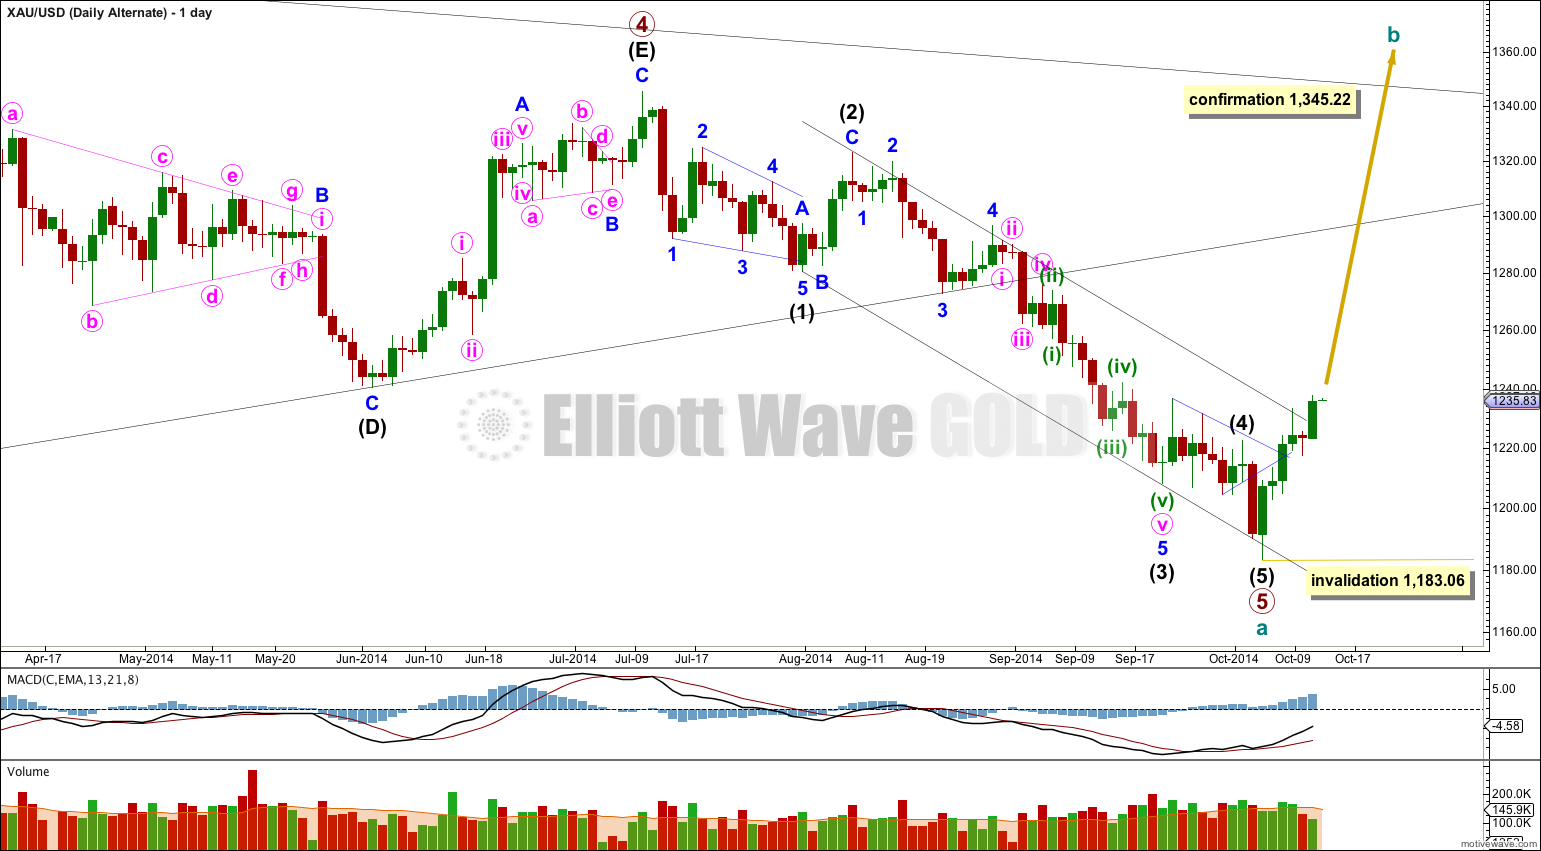
By simply moving the degree of labeling within primary wave 5 downwards all up one degree it is possible that primary wave 5 and so cycle wave a are over.
This wave count is reduced in probability by a small truncation. Primary wave 5 would be truncated by $2.66. The truncation is small though, so this wave count must be considered.
Movements out of triangles are often more brief and weak than expected, sometimes they are surprisingly brief.
If price breaks out of the upper edge of the parallel channel about cycle wave a (look to the weekly chart for this channel) this would be first indication that this wave count is correct. This trend channel confirmation would come before price confirmation above 1,345.22.
The first movement upwards for cycle wave b should be a five wave structure. Within it no second wave correction may move beyond the start of its first wave below 1,183.06.
Movement above 1,345.22 would invalidate the main wave count and so confirm this alternate.
This analysis is published about 07:07 p.m. EST.