
The target for a little downwards movement was 1,222. Price reached 1,221.95 and then turned, as expected from the preferred hourly Elliott wave count.
Summary: Upwards movement is incomplete. At this stage I expect it is quite likely to end about 1,281, in about one week.
Click on charts to enlarge.
Main Wave Count
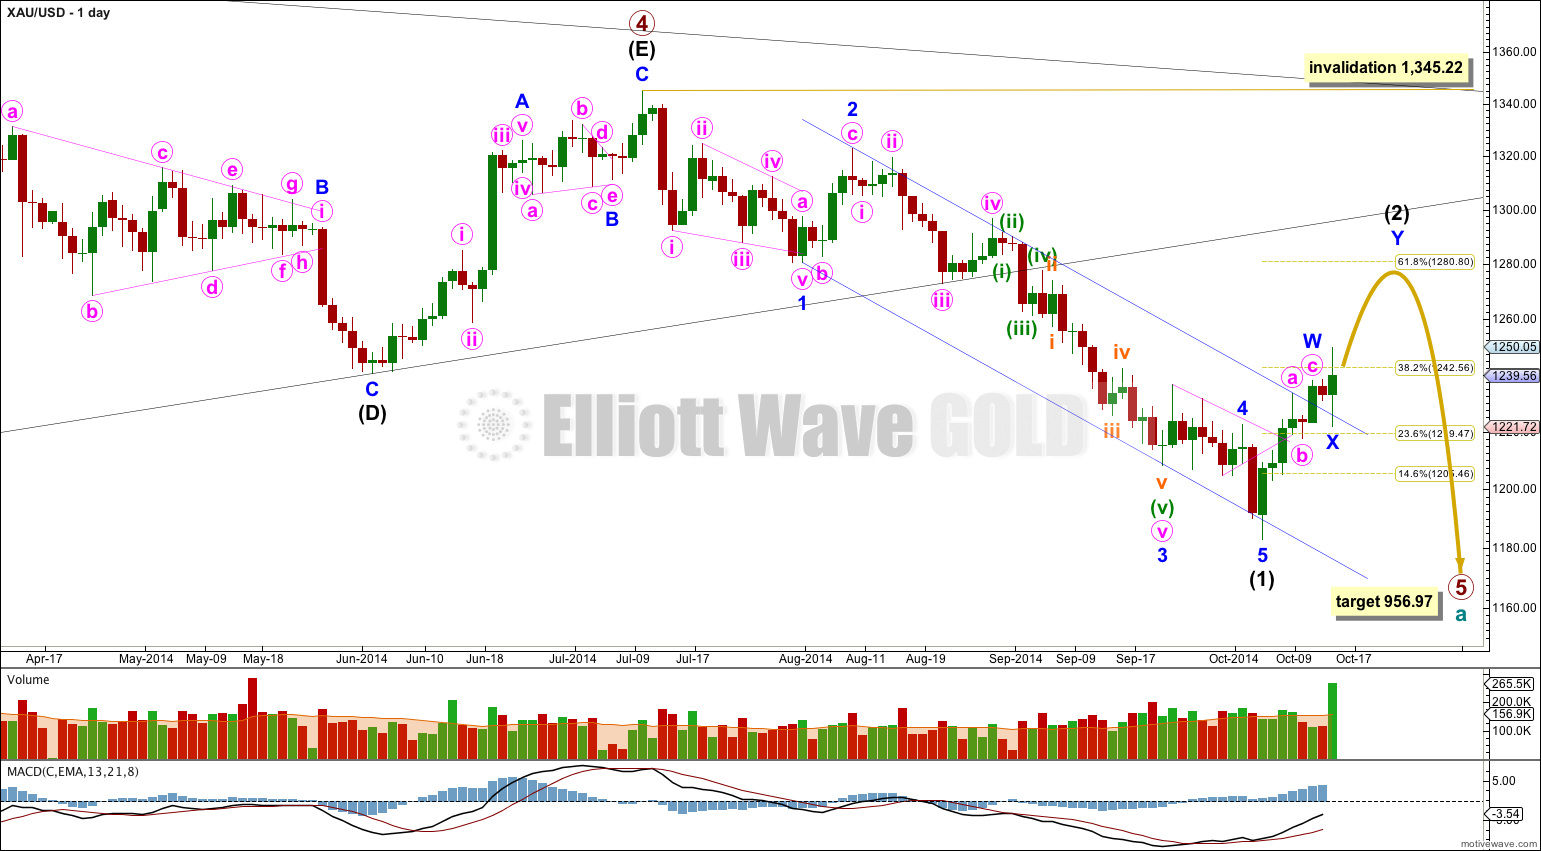
On the weekly chart extend the triangle trend lines of primary wave 4 outwards. The point in time at which they cross over may be the point in time at which primary wave 5 ends. This does not always work, but it works often enough to look out for. It is a rough guideline only and not definitive. A trend line placed from the end of primary wave 4 to the target of primary wave 5 at this point in time shows primary wave 5 would take a total 26 weeks to reach that point, and that is what I will expect. Primary wave 5 is in its 14th week.
At 956.97 primary wave 5 would reach equality in length with primary wave 1. Primary wave 3 is $12.54 short of 1.618 the length of primary wave 1, and equality between primary waves 5 and 1 would give a perfect Elliott relationship for this downwards movement.
However, when triangles take their time and move close to the apex of the triangle, as primary wave 4 has, the movement following the triangle is often shorter and weaker than expected, and this is my main reason for presenting the alternate wave count to you. If the target at 956.97 is wrong it may be too low. In the first instance I expect it is extremely likely that primary wave 5 will move at least below the end of primary wave 3 at 1,180.40 to avoid a truncation. When intermediate waves (1) through to (4) within primary wave 5 are complete I will recalculate the target at intermediate degree because this would have a higher accuracy. I cannot do that yet; I can only calculate it at primary degree.
Movement comfortably below 1,180.84 would provide further confidence in this main wave count as at that stage an alternate idea which sees primary wave 4 as continuing as a barrier triangle would be invalidated. I am not publishing this alternate idea as a chart because it has an extremely low probability.
Draw a channel about intermediate wave (1): draw the first trend line from the lows labeled minor waves 1 to 3, then place a copy on the high labeled minor wave 2. The slight overshoot of the lower edge of this channel indicates minor wave 5 may be over there. Intermediate wave (2) has just breached upper edge of this channel, and this trend line is now providing support.
Intermediate wave (2) may end close to a Fibonacci ratio of intermediate wave (1). Only because second waves are more commonly deep than shallow is the 0.618 ratio at 1,280.80 slightly favoured. But it does not have to be this deep.
At this stage I have three hourly wave counts for you which look at three different corrective structures for intermediate wave (2). I present them in order of probability: a double zigzag is most likely, followed by a single zigzag, and last a flat correction. Today the flat correction has substantially reduced in probability, and I may discard it tomorrow.
Double Zigzag or Double Combination
This is still the most likely structure for intermediate wave (2), but it is not the only possibility.
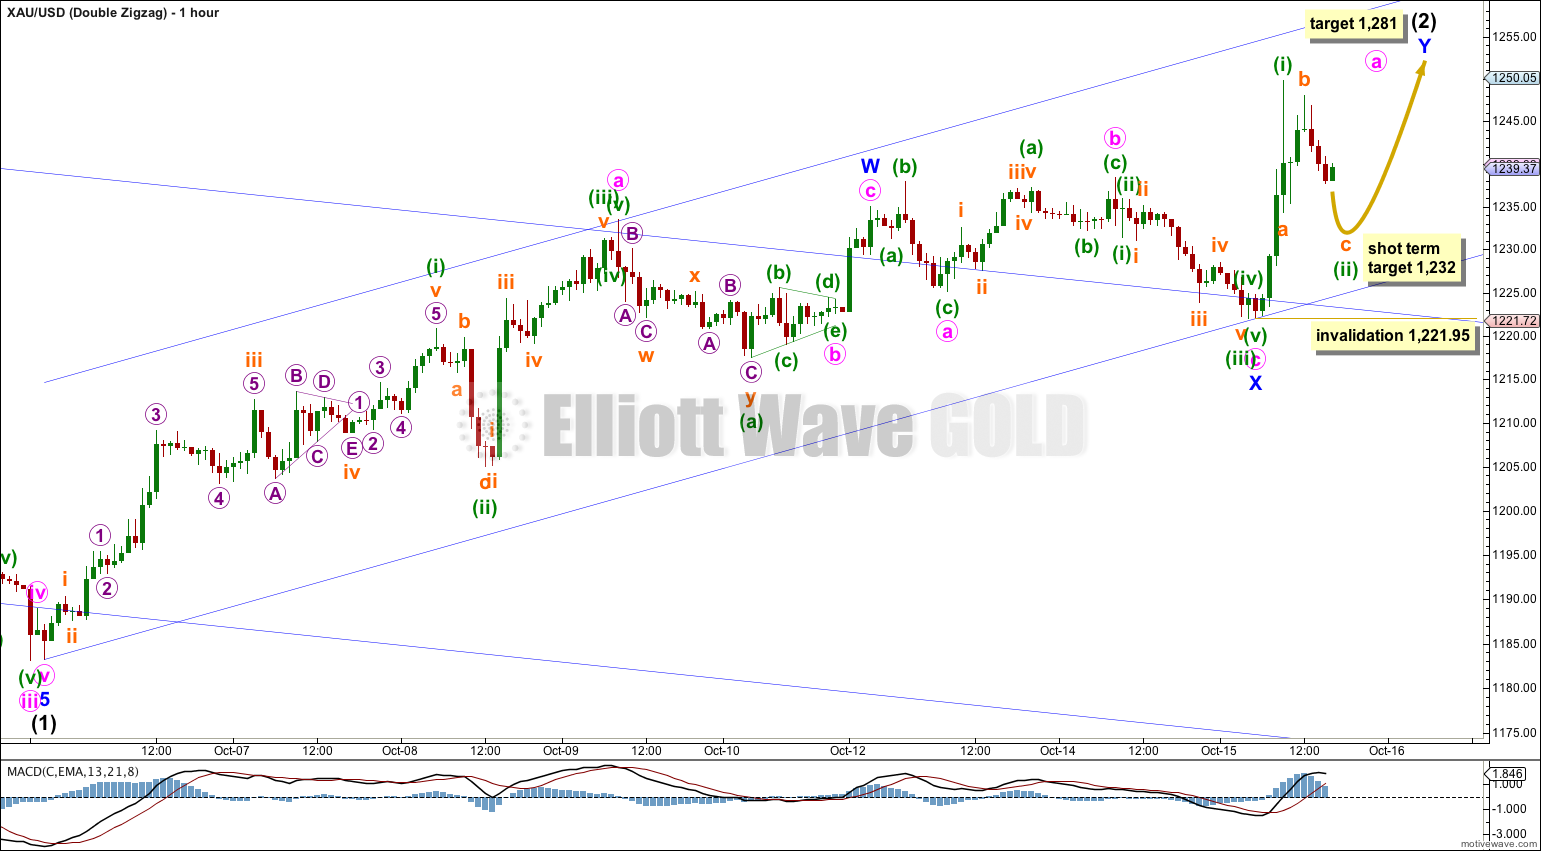
If intermediate wave (2) is unfolding as a multiple, labeled W-X-Y, then it would be a double zigzag and not a double combination. Double zigzags have the purpose of deepening a correction when the first zigzag does not move price deep enough, and so to achieve this purpose their X waves are usually very shallow. Double combinations have the purpose of taking up time and moving price sideways, and so their X waves are usually very deep (and often complicated and time consuming).
In this instance minor wave W fell slightly short of the 0.382 Fibonacci ratio of intermediate wave (1) at 1,242.56 so it could be expected that a second zigzag may be required to move intermediate wave (2) deeper, closer to the 0.618 Fibonacci ratio of intermediate wave (1) at 1,280.80. My target for intermediate wave (2) is the 0.618 Fibonacci ratio at 1,281.
Double zigzags do not normally exhibit Fibonacci ratios between the two zigzags. The best way to calculate a target for this movement to end is to use the ratio between minute waves a and c within the second zigzag of minor wave Y. I cannot do that yet. When minute waves a and b are complete I will calculate the target for intermediate wave (2) to end, and will probably not change much but may widen to a small zone.
Within minor wave Y its B wave nor any second wave correction may not move beyond its start below 1,221.95.
Within minute wave a minuette wave (ii) may now be complete. At 1,232 subminuette wave c within minuette wave (ii) would reach equality in length with subminuette wave a. Thereafter, we should see some increase in upwards momentum as a third wave unfolds.
Draw a best fit channel about intermediate wave (2). I would expect downwards corrections along the way up to find support at the lower edge of this channel.
Single Zigzag
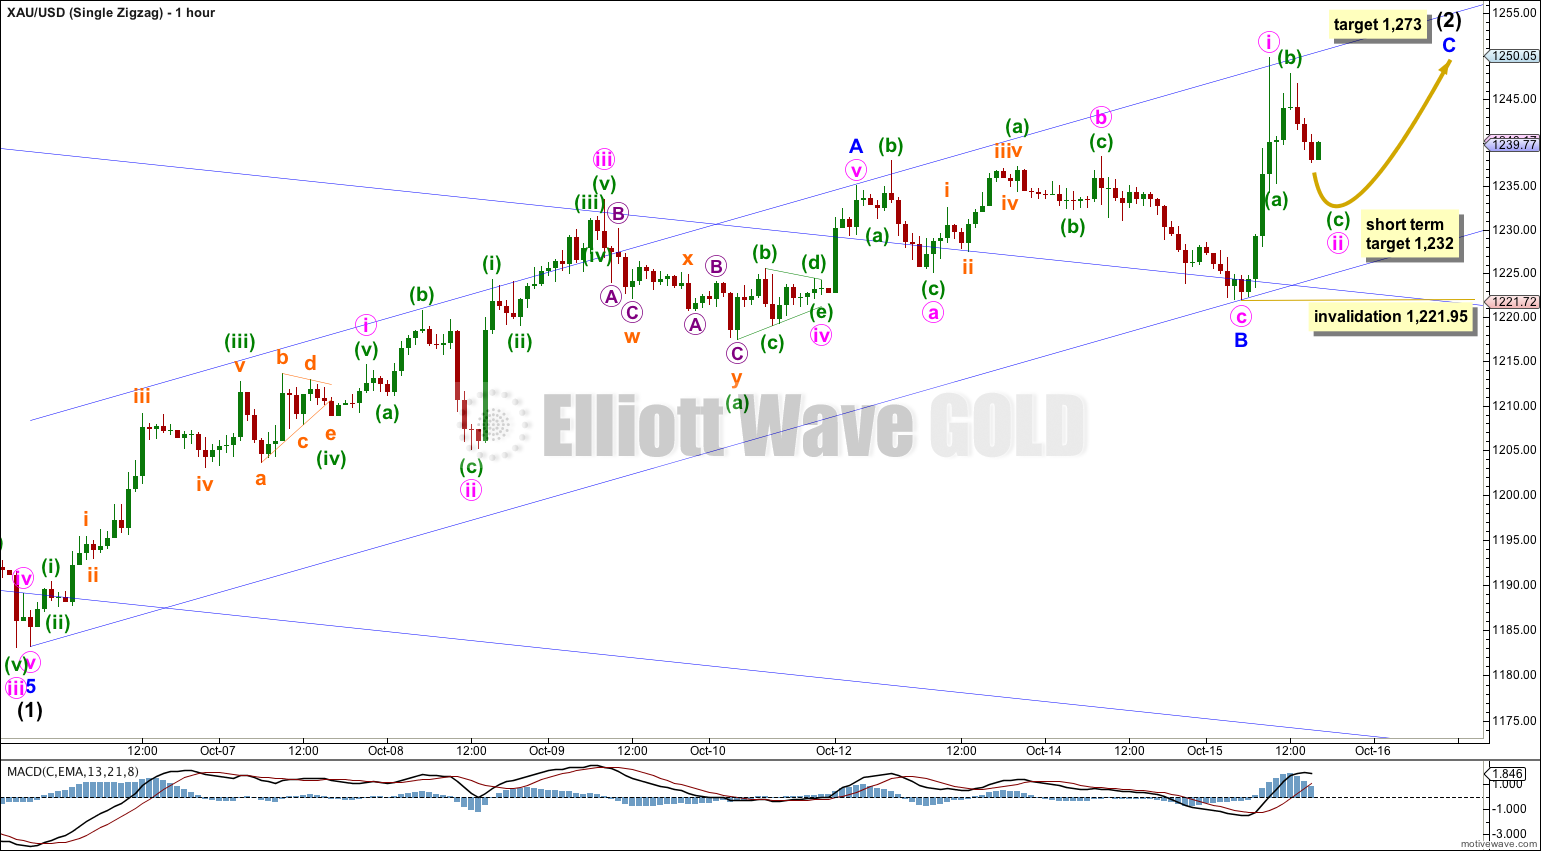
It is still possible that intermediate wave (2) is unfolding as a single zigzag, and that minor wave A was a five wave impulse.
This wave count has a slightly lower probability than the first count of a double zigzag because the subdivisions are not quite as good a fit.
This wave count also expects more upwards movement. At 1,273 minor wave C would reach equality in length with minor wave A, which would see intermediate wave (2) fall $7 short of the 0.618 Fibonacci ratio.
The main difference between this wave count and the first count of a double zigzag is the structure expected for the next wave up. The double zigzag expects to see a zigzag upwards and this single zigzag count expects to see an impulse upwards. This makes a difference in trying to predict when the upwards movement is over, and so I will continue to follow both ideas until one or the other is proven incorrect.
The channel about upwards movement is drawn in the same way for the lower trend line, and it is this trend line which will be important in showing when intermediate wave (2) is over. Only when this lower blue trend line (sloping upwards) is clearly breached by one full daily candlestick below it and not touching it will we have trend channel confirmation that intermediate wave (2) should be over and intermediate wave (3) should then be underway.
Flat
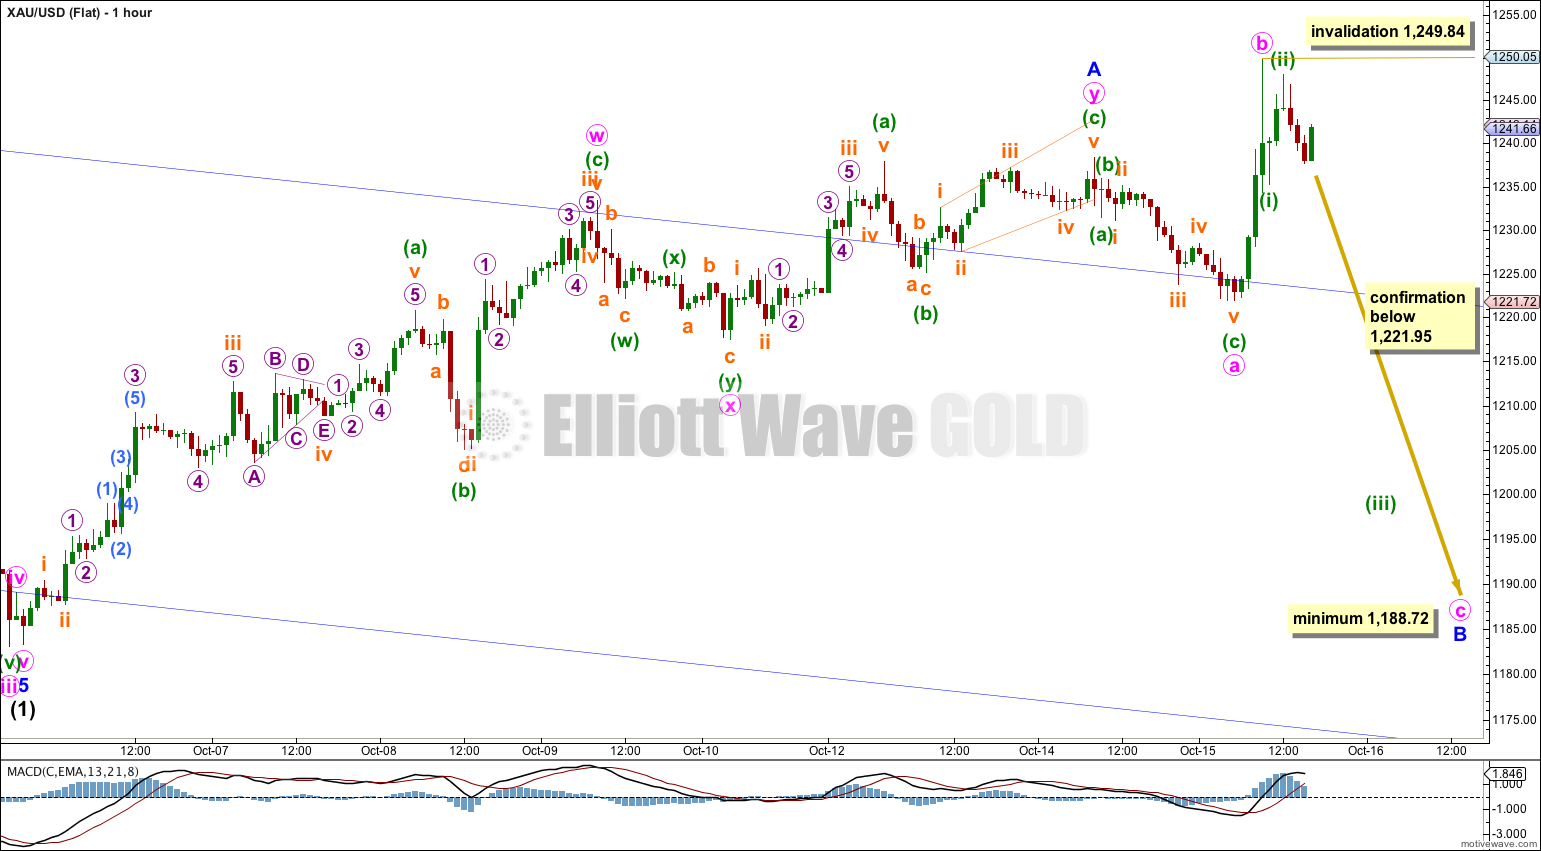
If price moves below 1,221.95 then this wave count may be an explanation. While price remains above 1,221.95 this wave count has a very low probability, because the subdivisions do not fit well at all.
At the end of minor wave A minuette wave (c) does not subdivide as an impulse, and it does not fit very well at all as an ending diagonal. The fifth wave of subminuette wave v is too short.
Downwards movement for minute wave a within minor wave B does not fit well as a zigzag. This movement looks more like an impulse.
Minor wave B could be an expanded flat correction. Within it minute wave b is a 170% correction of minute wave a. This is comfortably longer than the maximum common length of 138% and so this further reduces the probability of this wave count today.
If intermediate wave (2) is unfolding as a flat correction then within it minor wave B must reach back down to a minimum 90% length of minor wave A at 1,188.72 or below. Minor wave B may make a new low below the start of minor wave A at 1,183.22.
Within minute wave c no second wave correction may move beyond its start above 1,249.84. If this price point is passed in the next 24 hours I will discard this wave count.
Alternate Wave Count
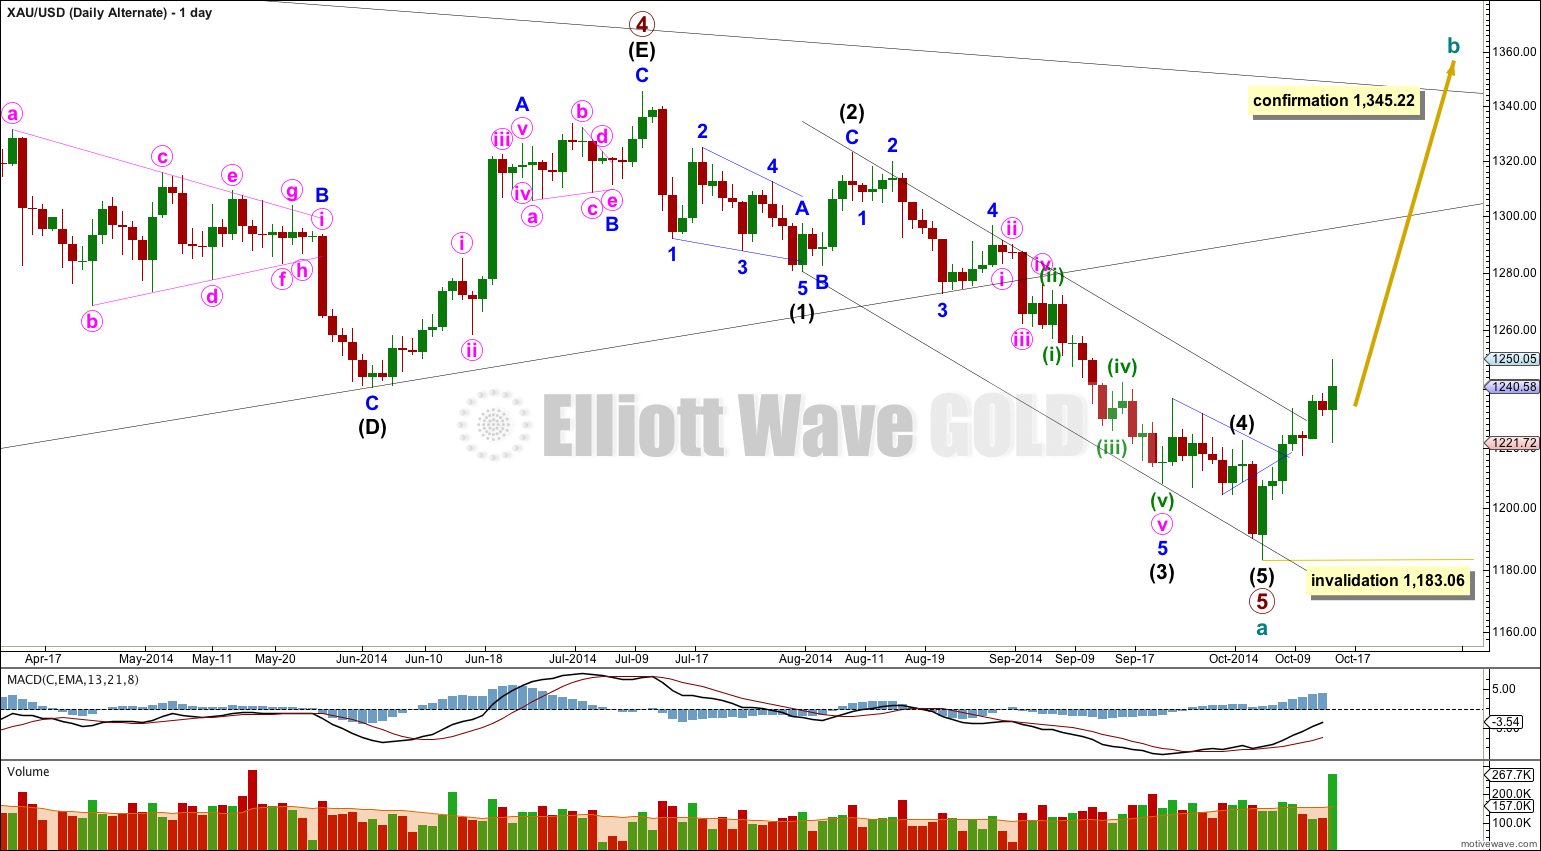
By simply moving the degree of labeling within primary wave 5 downwards all up one degree it is possible that primary wave 5 and so cycle wave a are over.
This wave count is reduced in probability by a small truncation. Primary wave 5 would be truncated by $2.66. The truncation is small though, so this wave count must be considered.
Movements out of triangles are often more brief and weak than expected, sometimes they are surprisingly brief.
If price breaks out of the upper edge of the parallel channel about cycle wave a (look to the weekly chart for this channel) this would be first indication that this wave count is correct. This trend channel confirmation would come before price confirmation above 1,345.22.
The first movement upwards for cycle wave b should be a five wave structure. Within it no second wave correction may move beyond the start of its first wave below 1,183.06.
Movement above 1,345.22 would invalidate the main wave count and confirm this alternate.
At this stage upwards movement is not looking like an unfolding impulse, and so this alternate wave count is reduced in probability today.
This analysis is published about 05:25 p.m. EST.