
Downwards movement continued, but fell short of the target at 1,217 by $5.58.
Summary: Intermediate wave (2) is unfolding as a big flat correction. Overall I expect more downwards movement to 1,190.04 in the mid term. In the short term I expect to see very choppy overlapping sideways and upwards movement for another one to three days.
Click on charts to enlarge.
Main Wave Count
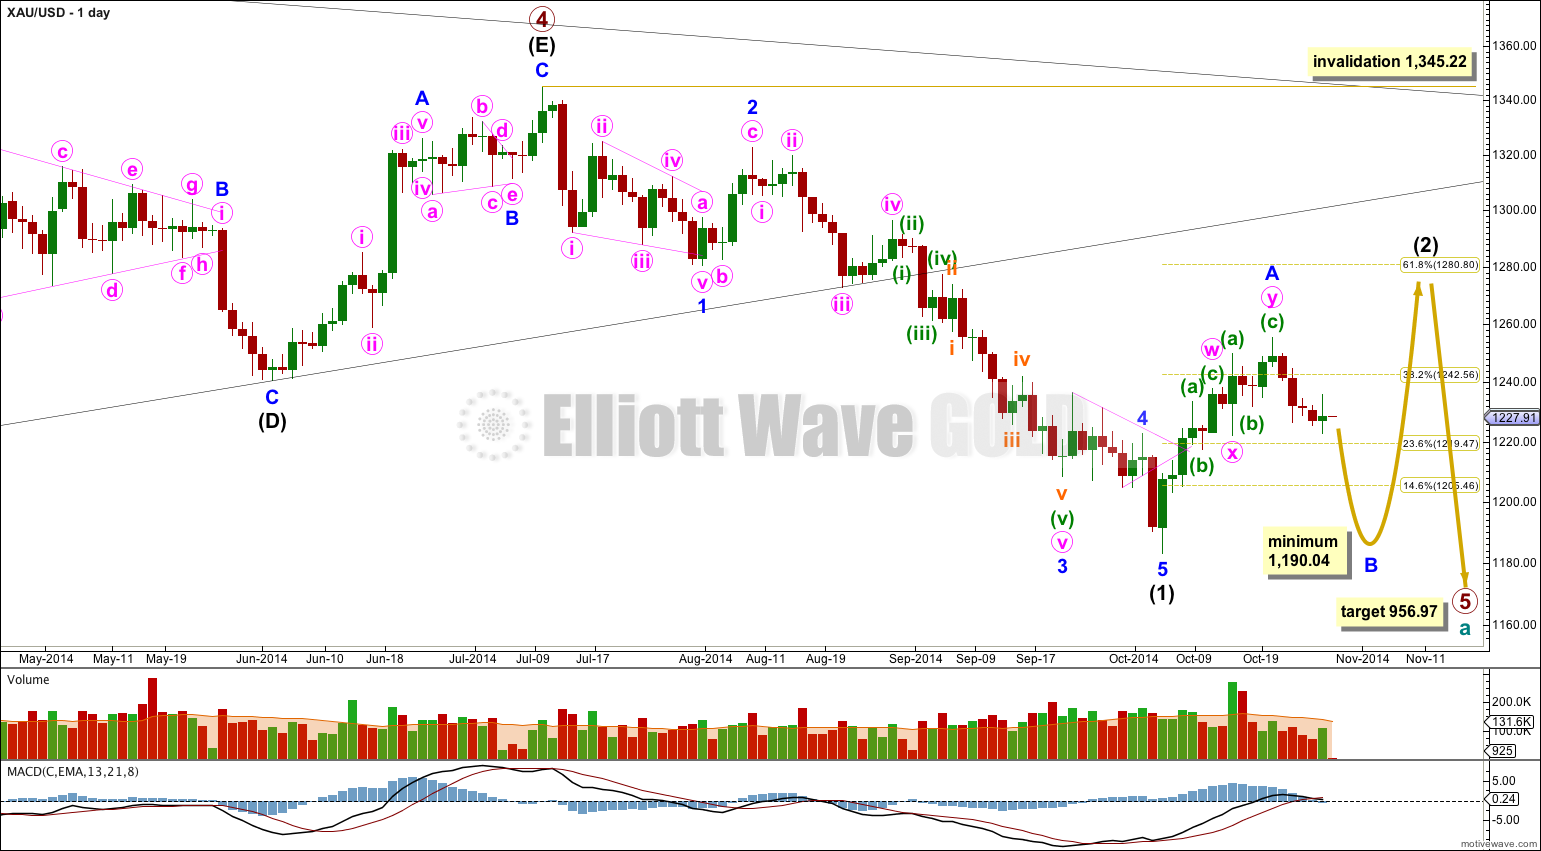
On the weekly chart extend the triangle trend lines of primary wave 4 outwards. The point in time at which they cross over may be the point in time at which primary wave 5 ends. This does not always work, but it works often enough to look out for. It is a rough guideline only and not definitive. A trend line placed from the end of primary wave 4 to the target of primary wave 5 at this point in time shows primary wave 5 would take a total 26 weeks to reach that point, and that is what I will expect. Primary wave 5 has just begun its 16th week.
At 956.97 primary wave 5 would reach equality in length with primary wave 1. Primary wave 3 is $12.54 short of 1.618 the length of primary wave 1, and equality between primary waves 5 and 1 would give a perfect Elliott relationship for this downwards movement.
However, when triangles take their time and move close to the apex of the triangle, as primary wave 4 has, the movement following the triangle is often shorter and weaker than expected, and this is my main reason for presenting the alternate wave count to you. If the target at 956.97 is wrong it may be too low. In the first instance I expect it is extremely likely that primary wave 5 will move at least below the end of primary wave 3 at 1,180.40 to avoid a truncation. When intermediate waves (1) through to (4) within primary wave 5 are complete I will recalculate the target at intermediate degree because this would have a higher accuracy, and the target may move higher. I cannot do that yet; I can only calculate it at primary degree.
Movement comfortably below 1,180.84 would provide further confidence in this main wave count as at that stage an alternate idea which sees primary wave 4 as continuing as a barrier triangle would be invalidated. I am not publishing this alternate idea as a chart because it has an extremely low probability.
Intermediate wave (2) may end close to a Fibonacci ratio of intermediate wave (1). Only because second waves are more commonly deep than shallow is the 0.618 ratio at 1,280.80 slightly favoured. But it does not have to be this deep. When we know where minor wave B has ended then I can calculate a target for intermediate wave (2) to end.
Intermediate wave (1) lasted 62 days. For the wave count to have the right look intermediate wave (2) should continue for longer than it has so far. Intermediate wave (2) is unfolding as a flat correction, subdividing 3-3-5. Within it minor wave B downwards must subdivide as a three, and may make a new low below the start of minor wave A at 1,183.06 as in an expanded flat. Minor wave A lasted 11 days, and I would expect minor wave B to be at least 11 days and maybe longer as B waves tend to be more time consuming structures.
Minor wave A upwards fits perfectly as a three, a double zigzag. This indicates intermediate wave (2) must be unfolding as a flat correction. Within a flat minor wave B must reach a minimum of 90% of minor wave A at 1,190.04 or below. Minor wave B may make a new low below the start of minor wave A as in an expanded flat.
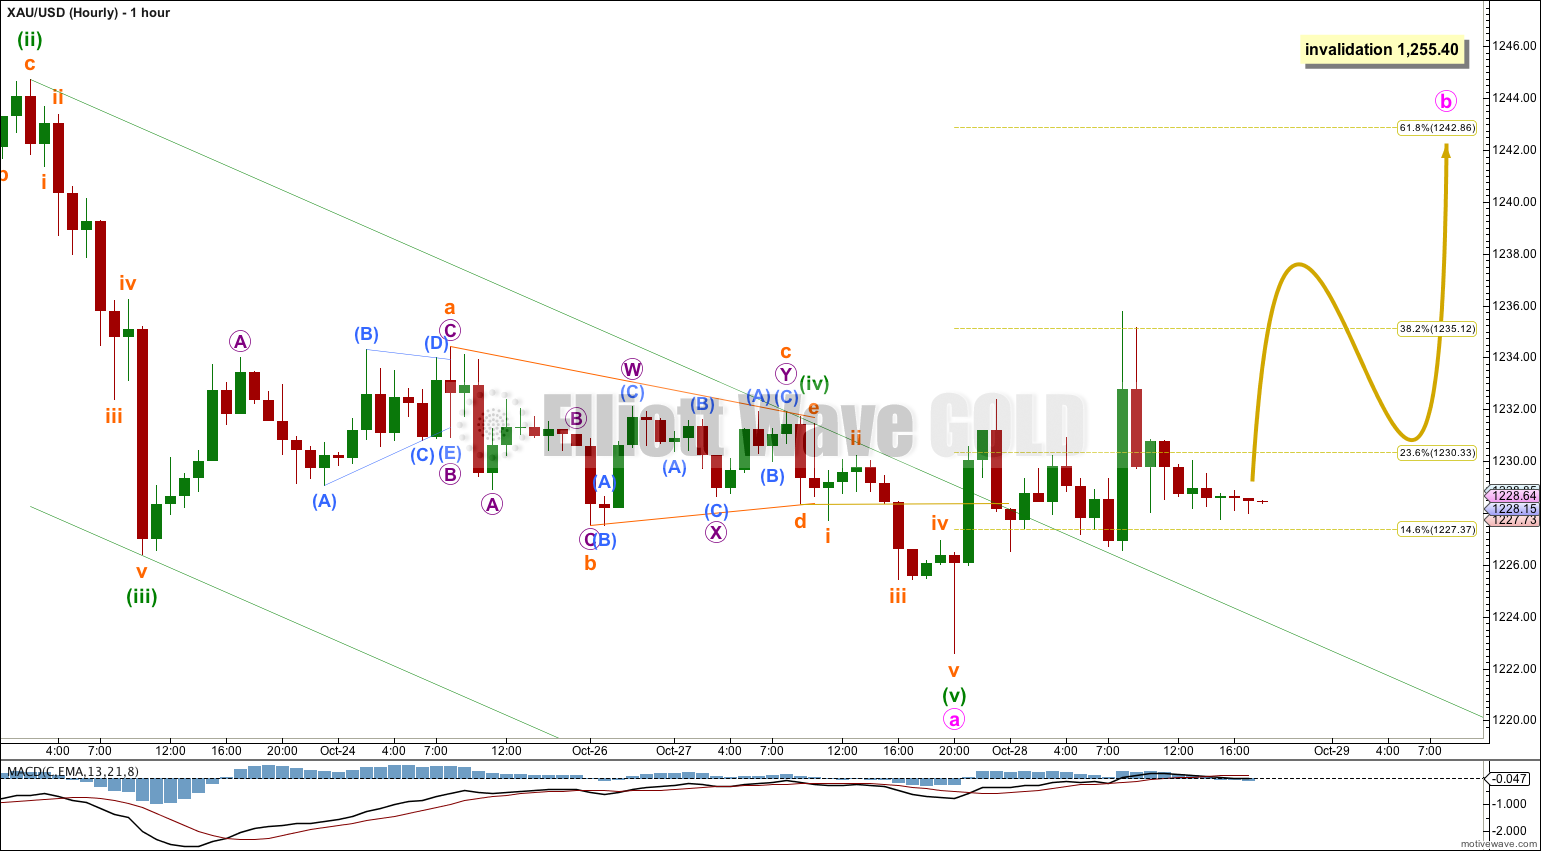
Minor wave B must unfold as a corrective structure. There are more than thirteen possibilities, although a triangle is very unlikely. So far within it minute wave a fits best as a five wave impulse. This indicates minor wave B is unfolding as a zigzag.
Ratios within minute wave a are: there is no Fibonacci ratio between minuette waves (iii) and (i), and minuette wave (v) is just 0.31 short of 0.618 the length of minuette wave (i).
Minute wave b may be any one of more than thirteen possible corrective structures. At this early stage it is impossible to say which structure may unfold. It may include a new low below its start at 1,222.58 as in an expanded flat, running triangle or combination.
I would expect minute wave b to be very choppy and overlapping. It should last at least one to three days. It may not move beyond the start of minute wave a above 1,255.40. It may end about the 0.618 Fibonacci ratio of minute wave a at 1,243.
This is a B wave within a B wave. All my caution about changing wave counts and uncertainty is amplified at this time. Over the next couple of days we must wait to see which structure minute wave b may be unfolding as, while price is likely to remain range bound.
Alternate Wave Count I
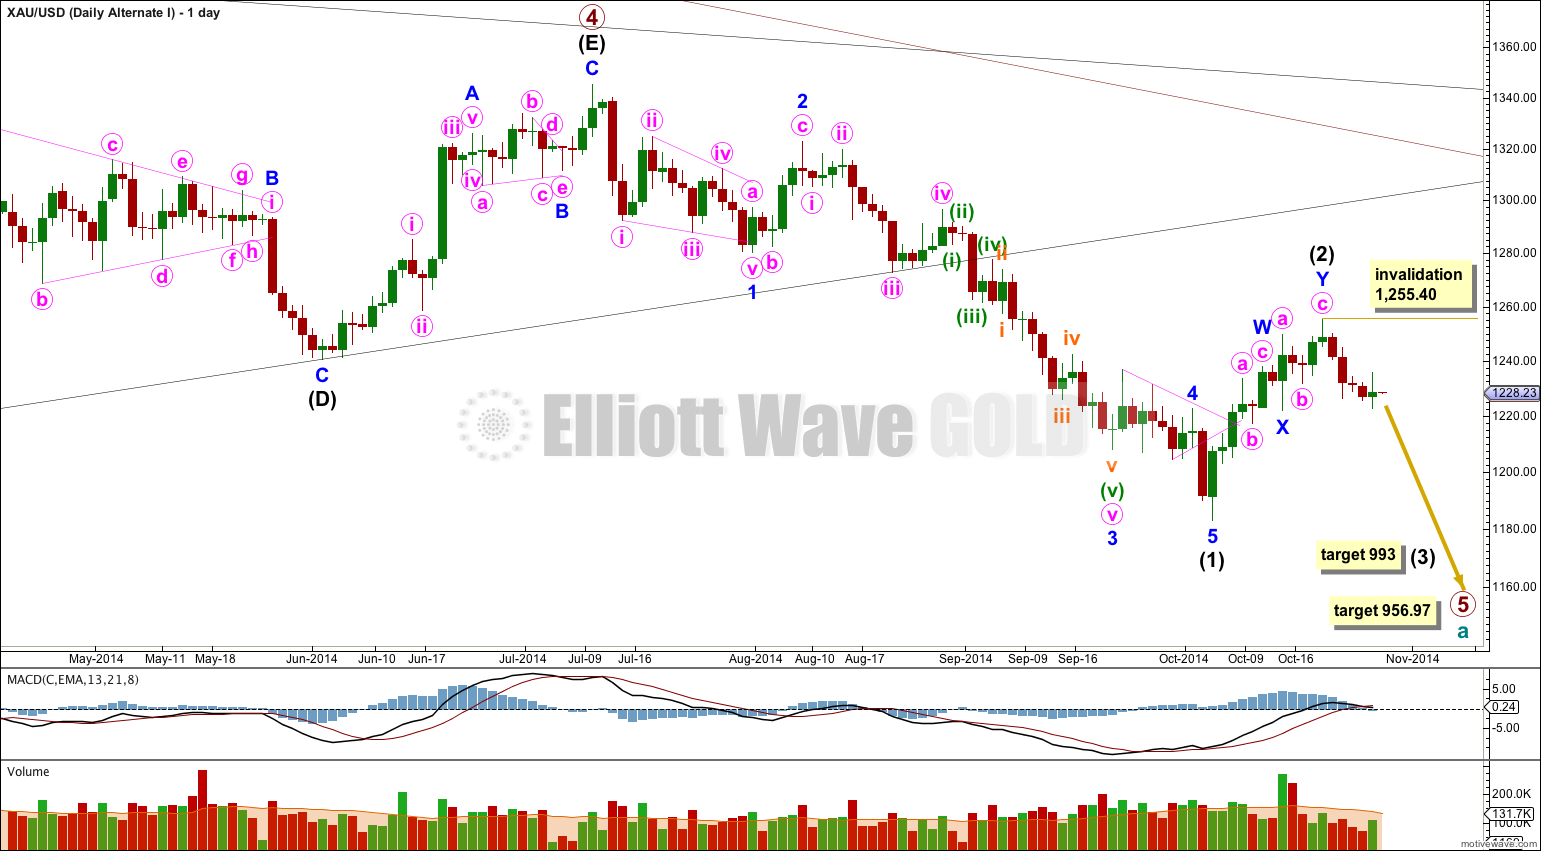
It is possible that the double zigzag is a completion of intermediate wave (2), but this idea has a very low probability.
This would see intermediate wave (2) only 45% of intermediate wave (1), but more importantly it would have lasted only 11 days in comparison to the 62 days for intermediate wave (1). This is too brief to give the wave count the “right look” on the daily chart.
This alternate also expects downwards movement. If price moves below 1,231.78 then only careful attention to structure (is it a three or a five?) of the next wave down would tell if this alternate is correct or if intermediate wave (2) is continuing as a flat correction. At this stage downwards movement is too slow and lacking in momentum to look like a third wave. It looks more like a B wave.
At 993 intermediate wave (3) would reach 1.618 the length of intermediate wave (1).
Alternate Wave Count II
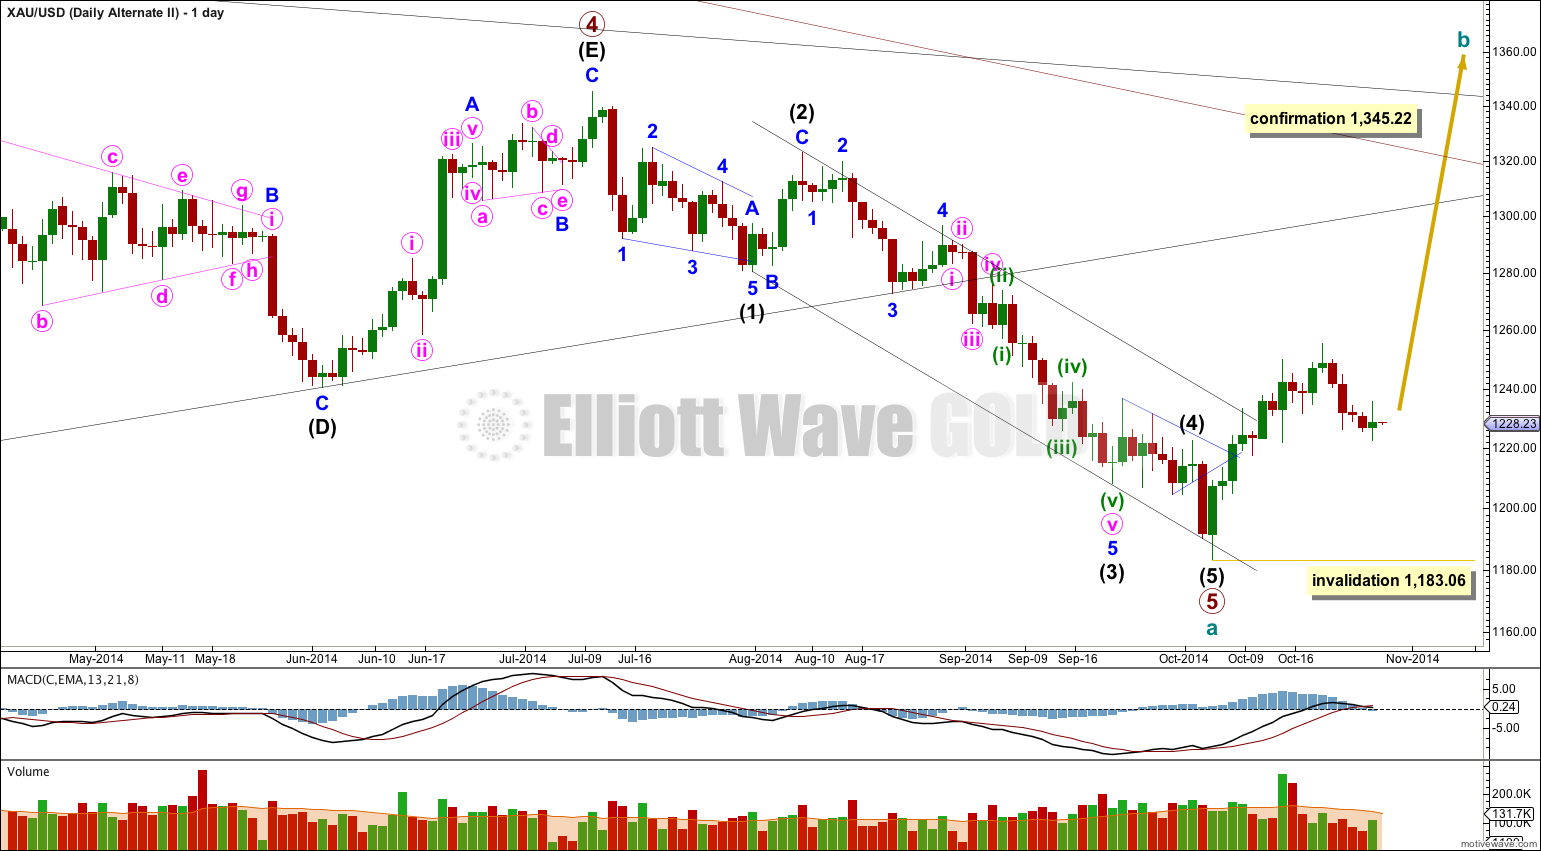
By simply moving the degree of labeling within primary wave 5 downwards all up one degree it is possible that primary wave 5 and so cycle wave a are over.
This wave count is reduced in probability by a small truncation. Primary wave 5 would be truncated by $2.66. The truncation is small though, so this wave count must be considered.
Movements out of triangles are often more brief and weak than expected, sometimes they are surprisingly brief. There is a nice example of what I mean by this here on the daily chart: after the triangle of intermediate wave (4) we saw a surprisingly quick short intermediate wave (5) down afterwards.
If price breaks out of the upper edge of the parallel channel about cycle wave a (look to the weekly chart for this channel) this would be first indication that this wave count is correct. This trend channel confirmation would come before price confirmation above 1,345.22.
The first movement upwards for cycle wave b should be a five wave structure. Within it no second wave correction may move beyond the start of its first wave below 1,183.06.
Movement above 1,345.22 would invalidate the main wave count and confirm this alternate.
At this stage upwards movement is not looking like an unfolding impulse because it is too choppy and overlapping, and so this alternate wave count is greatly reduced in probability.
This analysis is published about 07:40 p.m. EST.