
Upwards movement was expected for Monday’s session. A red candlestick was not expected, but price has mostly moved sideways and remains above the invalidation point on the main Elliott wave hourly chart.
Summary: It is still most likely that downwards movement is complete for now. The target for the next wave up is at 1,278 – 1,281. It may be met in a Fibonacci 8 or 13 days. A clear breach of the green channels on the main and alternate hourly charts would provide confidence in this trend change.
Click on charts to enlarge.
Main Wave Count
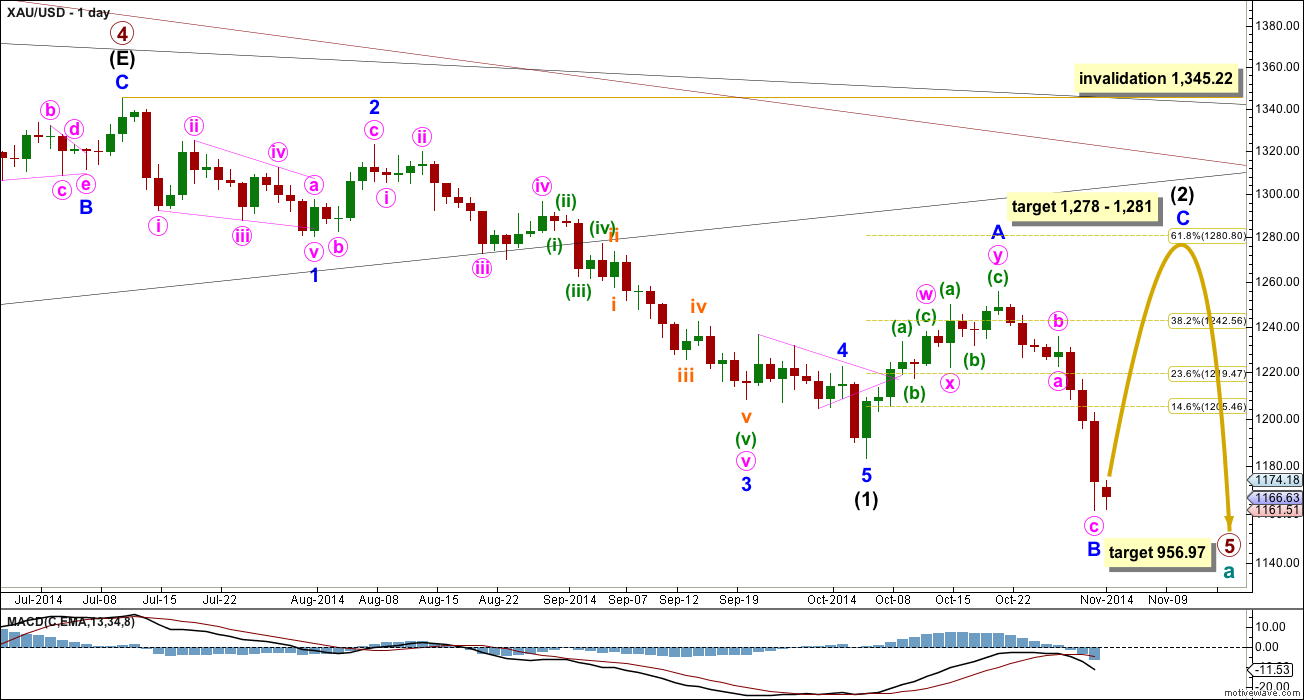
On the weekly chart extend the triangle trend lines of primary wave 4 outwards. The point in time at which they cross over may be the point in time at which primary wave 5 ends. This does not always work, but it works often enough to look out for. It is a rough guideline only and not definitive. A trend line placed from the end of primary wave 4 to the target of primary wave 5 at this point in time shows primary wave 5 would take a total 26 weeks to reach that point, and that is what I will expect. Primary wave 5 started its 17th week.
At 956.97 primary wave 5 would reach equality in length with primary wave 1. Primary wave 3 is $12.54 short of 1.618 the length of primary wave 1, and equality between primary waves 5 and 1 would give a perfect Elliott relationship for this downwards movement.
However, when triangles take their time and move close to the apex of the triangle, as primary wave 4 has, the movement following the triangle is often shorter and weaker than expected, and this is my main reason for presenting the alternate wave count to you. If the target at 956.97 is wrong it may be too low. In the first instance I expect it is extremely likely that primary wave 5 will move at least below the end of primary wave 3 at 1,180.40 to avoid a truncation. When intermediate waves (1) through to (4) within primary wave 5 are complete I will recalculate the target at intermediate degree because this would have a higher accuracy, and the target may move higher. I cannot do that yet; I can only calculate it at primary degree.
Intermediate wave (2) is an incomplete expanded flat correction. Expanded flats are the most common type of flat. Minor wave B is a 130% correction of minor wave A, nicely within the normal range of 100% to 138%. At 1,278 minor wave C would reach 1.618 the length of minor wave A. At 1,281 intermediate wave (2) would reach the 0.618 Fibonacci ratio of intermediate wave (1). This gives a small $2 target zone with a high probability.
I would expect minor wave C to last about a Fibonacci 8 or 13 days, with 13 more likely. It may only subdivide as an impulse or ending diagonal, and an impulse is much more likely.
Main Hourly Wave Count
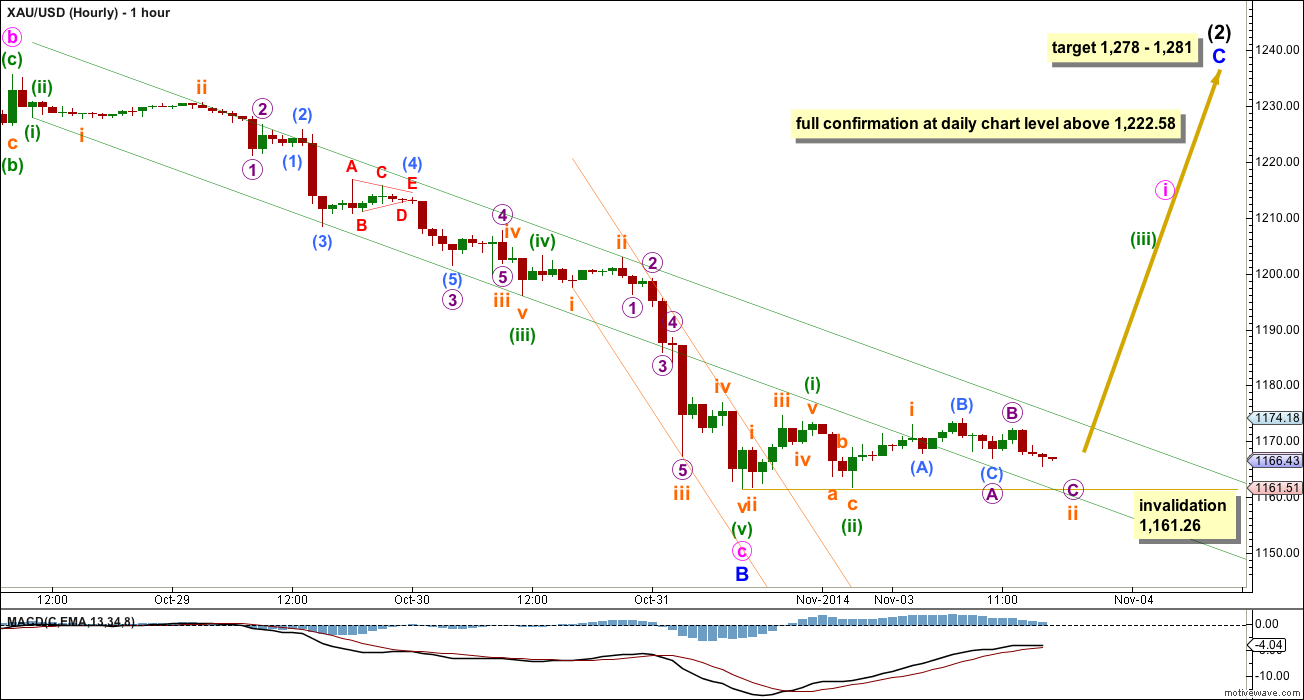
The structure within minute wave c is now complete. There is no Fibonacci ratio between minute waves a and c.
Unfortunately, at this stage there is no close by price point which differentiates this main hourly wave count with the alternate below. The trend channel will have to be used. A clear breach of the channel on the alternate hourly chart would happen first, followed quickly by a breach of the green channel on this main hourly chart. Once both channels are clearly breached by upwards movement I shall have more confidence in this main wave count.
If minor wave B is over and minor wave C has begun then it may be beginning slowly, with a series of overlapping first and second waves. This is quite typical. Within minor wave C no second wave correction may move beyond the start of its first wave below 1,161.26.
Movement above 1,222.58 would invalidate both alternate daily wave counts and so provide full and final confirmation of this main wave count at the daily chart level and at intermediate wave degree.
Alternate Hourly Wave Count
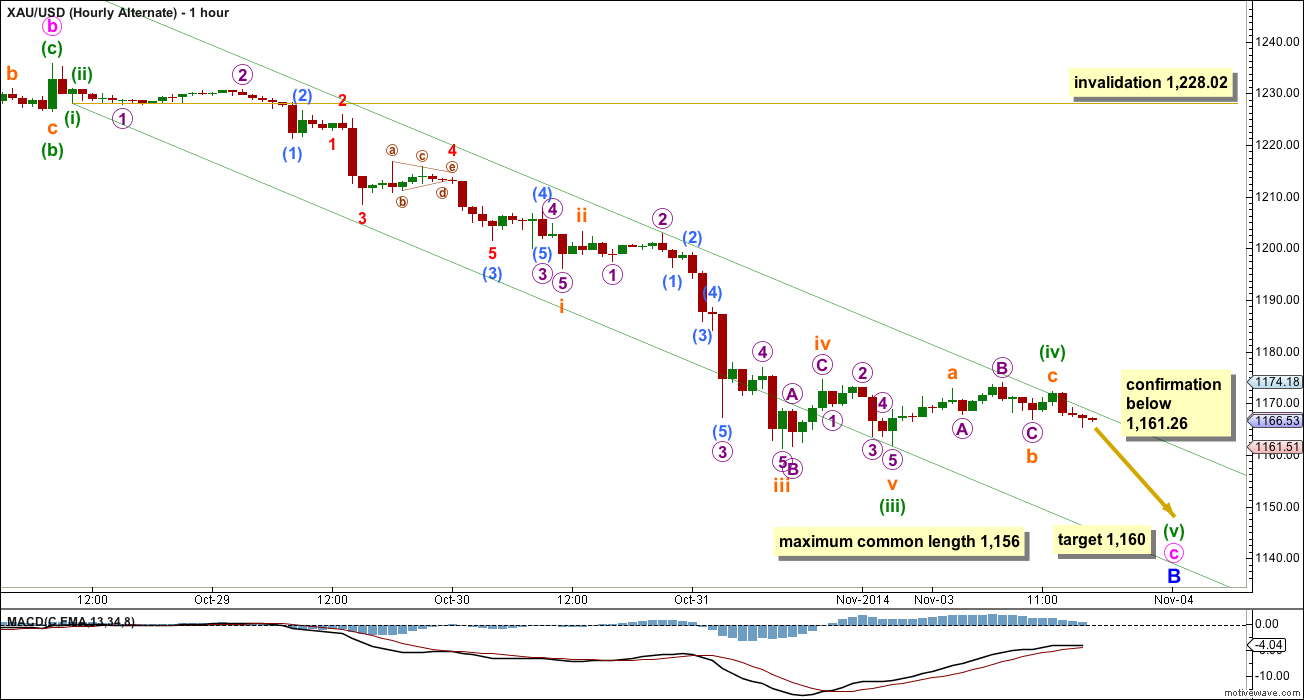
Here I have simply moved the degree of labeling within most of minute wave c all down one degree. It is possible (but unlikely) that minute wave c is not over.
At 1,160 minuette wave (v) would reach 1.618 the length of minuette wave (i). The maximum common length for minor wave B within this expanded flat correction is up to 138% the length of minor wave A at 1,156.
Minuette wave (iv) may not move into minuette wave (i) price territory above 1,228.02. A clear breach of the green channel with upwards movement should see this wave count discarded, long before 1,228.02 is passed.
Alternate Daily Wave Count I
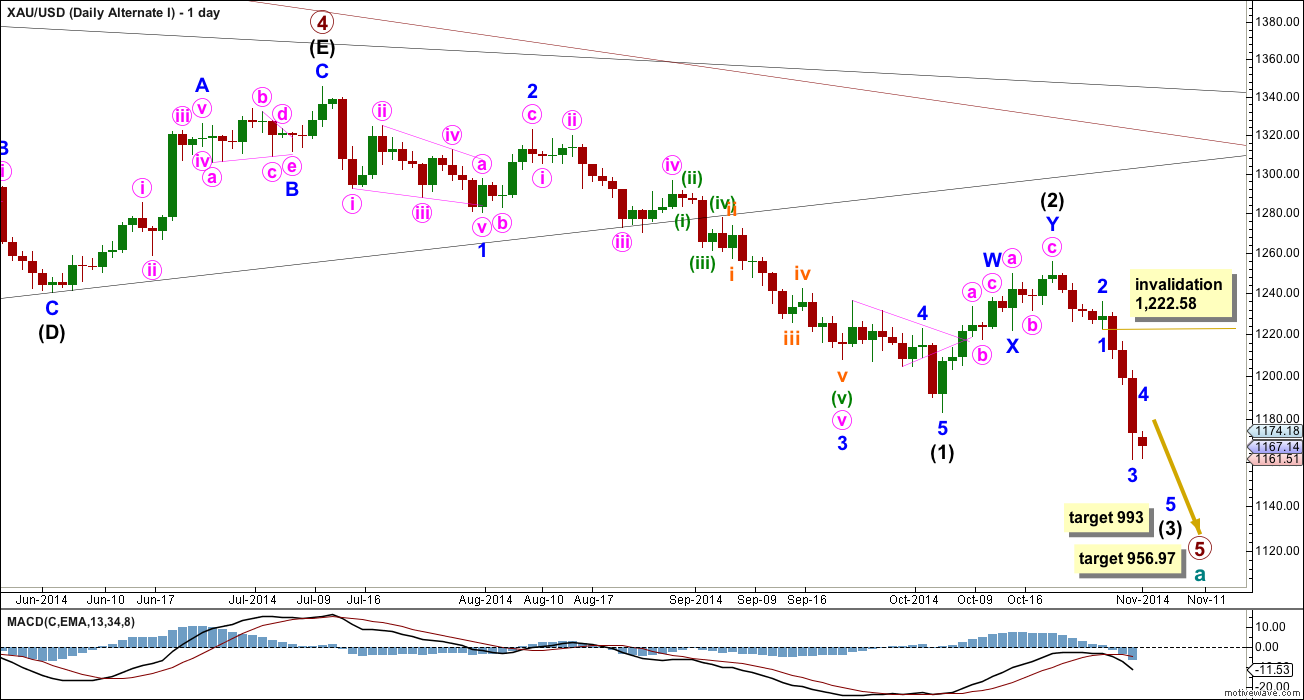
It is possible that the double zigzag is a completion of intermediate wave (2), but this idea has a very low probability.
This would see intermediate wave (2) only 45% of intermediate wave (1), but more importantly it would have lasted only 11 days in comparison to the 62 days for intermediate wave (1). This is too brief to give the wave count the “right look” on the daily chart.
So far intermediate wave (3) is incomplete (and the degree of labeling within it may yet be moved down one degree). So far only a 1-2-3 down is complete. A following fourth wave may not move into first wave price territory above 1,222.58.
At 993 intermediate wave (3) would reach 1.618 the length of intermediate wave (1).
Alternate Daily Wave Count II
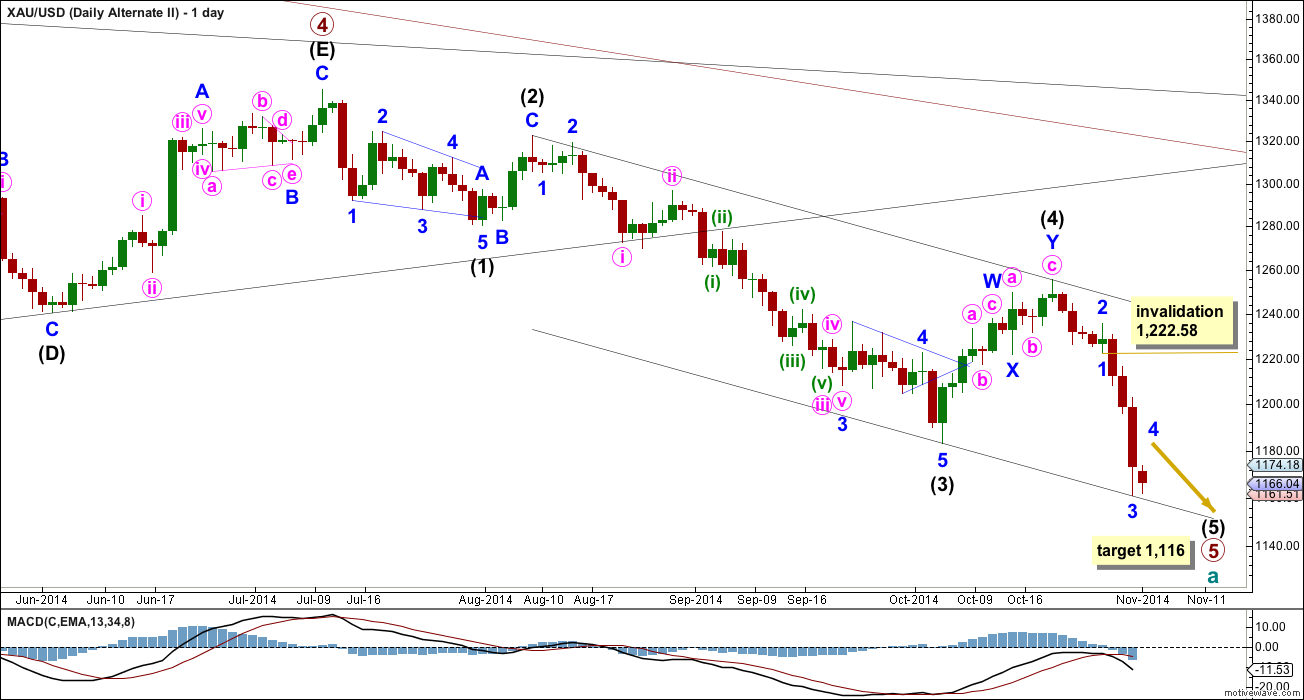
It is possible that primary wave 5 is nearing its end, but this idea has a rather low probability.
This wave count moves the degree of labeling within primary wave 5 all up one degree. There is no divergence in expected direction. The divergence will only come after this current downward wave is done.
The biggest problem with this wave count is the lack of alternation between intermediate waves (2) and (4): intermediate wave (2) is a deep 65% single zigzag lasting a Fibonacci 5 days and intermediate wave (4) is a somewhat deep 52% double zigzag lasting 11 days. Single and double zigzags are different structures, but they are very similar and belong to the same family. It is not common to see one in a second wave position and the other in a corresponding fourth wave position, especially when both are close to similar depth.
There is no Fibonacci ratio between intermediate waves (3) and (1) so this wave count would expect to see a Fibonacci ratio between intermediate wave (5) and either of (1) or (3). If intermediate wave (5) were to reach equality in length with intermediate wave (1) it would be truncated. At 1,116 intermediate wave (5) would reach equality in length with intermediate wave (3).
Within intermediate wave (5) minor wave 4 may not move into minor wave 1 price territory above 1,222.58.
This analysis is published about 04:57 p.m. EST.