Summary: I am expecting a sideways consolidation for two to four days before a resumption of the downwards trend.
Click on charts to enlarge.
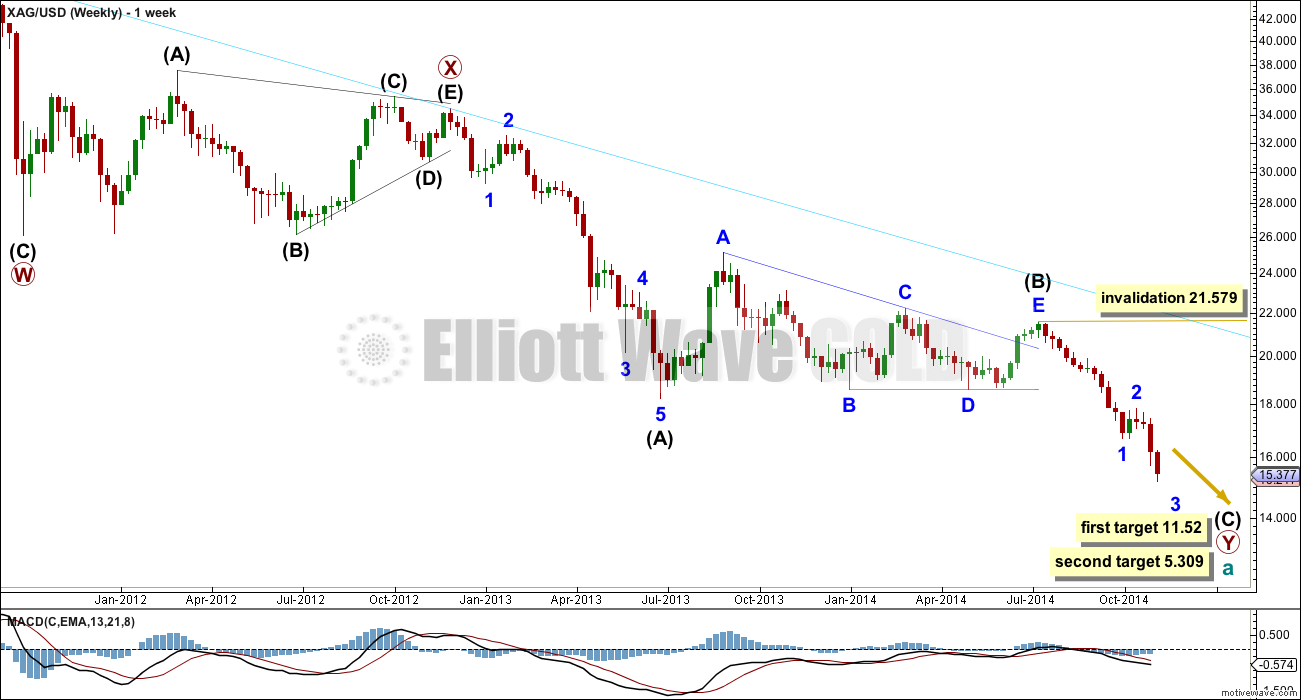
Downwards movement subdivides so far as an incomplete double zigzag. This cannot be an impulse if the movement which I have labeled primary wave X is correct as a triangle because a triangle may not be the sole structure in a second wave position.
The first zigzag in the double is labeled primary wave W. The double is joined by a “three”, a triangle, in the opposite direction labeled primary wave X.
The second zigzag for primary wave Y is moving price lower to deepen the correction, and so this structure has a typical double zigzag look in that it has a clear slope against the main trend.
Within primary wave Y the triangle for intermediate wave (B) is now a complete barrier triangle. Movements following triangles, and particularly barrier triangles, have a tendency to be relatively short and brief (more common), or sometimes they are a very long extension. At this stage though the lower target is beginning to look more likely.
Within primary wave Y at 11.52 intermediate wave (C) would reach 0.618 the length of intermediate wave (A). At 5.309 intermediate wave (C) would reach equality in length with intermediate wave (A).
Within primary wave Y intermediate wave (A) lasted 30 weeks and intermediate wave (B) lasted exactly a Fibonacci 54 weeks. I would expect intermediate wave (C) to end in a total 21 or 34 weeks. So far it has lasted 17 weeks and may yet continue towards the target for a further 4 or 17 weeks, if it exhibits a Fibonacci duration. However, please note, Silver does not reliably exhibit Fibonacci durations nor do its waves reliably exhibit Fibonacci ratios to each other in terms of duration.
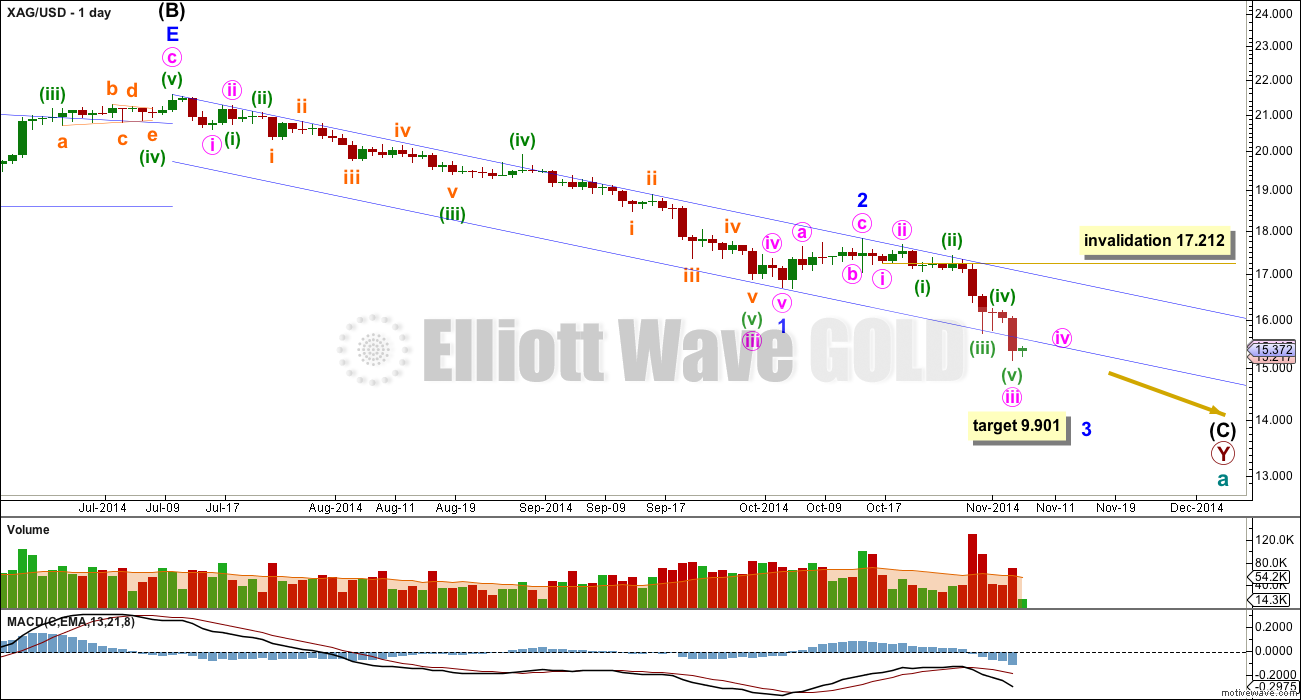
Downwards movement invalidated the wave count from two days ago. This downwards movement is too deep to be a B wave within an expanded flat for minor wave 2, so although minor wave 2 was very shallow and brief it is most likely over already.
My only concern with this wave count at this stage is the degree of labelling within minor wave 3, and unless it exhibits a long strong fifth wave (typical of commodities) then I may need to move the degree of labelling within it all down one degree.
At this stage it looks like a 5-3-5 down within minor wave 3 is complete. This may be minute waves i, ii and iii as labeled, or it may only be minuette waves (i), (ii) and (iii) within minute wave i. Either way, at this stage I would expect to see a small fourth wave correction before the continuation of more downwards movement.
Minute wave ii lasted two days and shows clearly on the daily chart. I would expect minute wave iv to last at least two days, and quite likely longer as fourth wave corrections are often more long lasting than second waves when the second wave is a zigzag and the fourth wave is a combination or triangle.
Minute wave iv may not move into minute wave i price territory above 17.212.
The blue channel about minor waves 1 and 2 is a base channel. It is overshot at the lower edge which should be expected from a third wave.
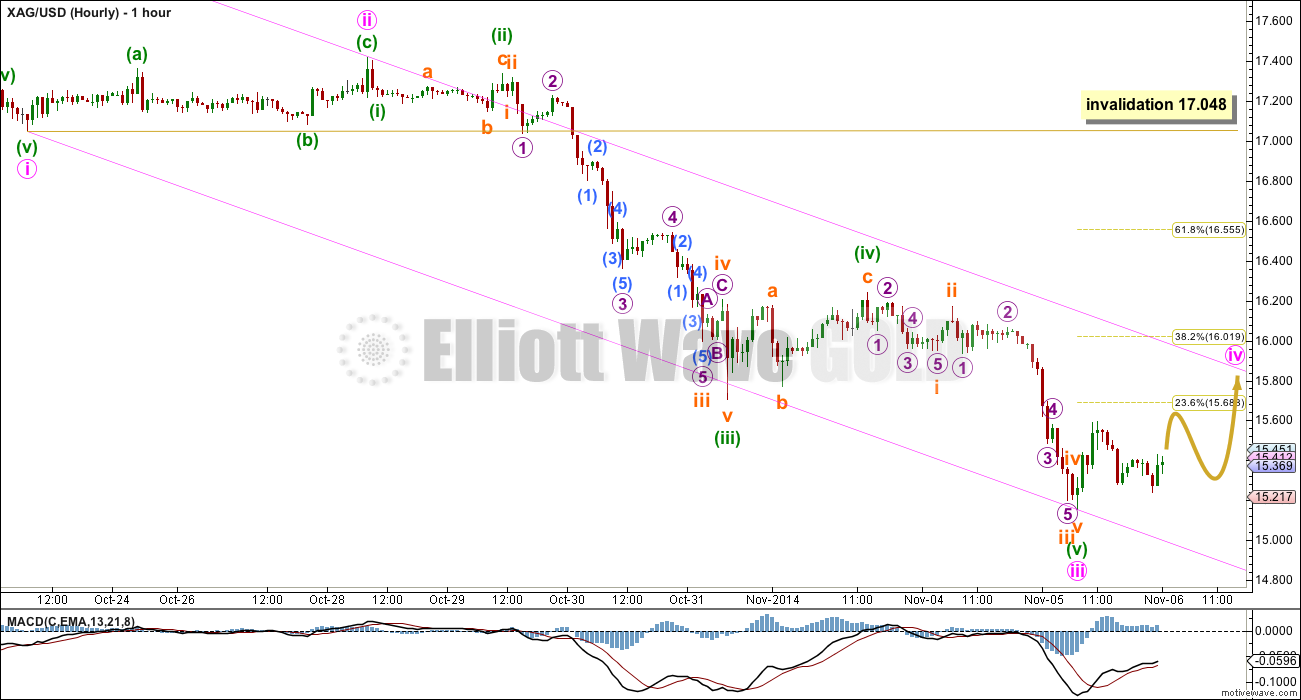
This hourly chart shows almost all the structure within minor wave 3 so far. There is no adequate Fibonacci ratio between minute waves iii and i. When minute wave iv is complete I will expect to see a Fiboancci ratio between minute wave v and either of iii or i.
Within minute wave iii there is no Fibonacci ratio between minuette waves (iii) and (i), and minuette wave (v) is .081 longer than .618 the length of minuette wave (iii).
Minute wave ii was a relatively shallow .44 zigzag correction (or possibly a double zigzag). I would expect minute wave iv to be more shallow, because it should find resistance at the upper edge of the channel and it is likely to end within the price territory of the fourth wave of one lesser degree between 15.706 and 16.242.
Minute wave iv is most likely to be a flat, combination or triangle. All of these structures may include a new price extreme beyond its start so there can be no lower invalidation point for this wave count at this time.
Draw a channel about minor wave 3 using Elliott’s technique: draw the first trend line from the ends of minute waves i to iii, then place a parallel line on the end of minute wave ii. Minute wave iv may find resistance at the upper edge of this channel. The following fifth wave down may find support at the lower edge, but is quite likely to break through that support and end below the channel.


