Sideways movement was allowed for, and expected as about 50% likely. This slightly clarifies the situation for the short term.
Summary: The trend at minor degree is up. At this stage I expect sideways choppy movement for another 24 hours before the next strong upwards movement. It is possible that a small correction may move price lower. The invalidation point remains at 1,142.88. The target for minute wave iii remains at 1,262.
Click on charts to enlarge
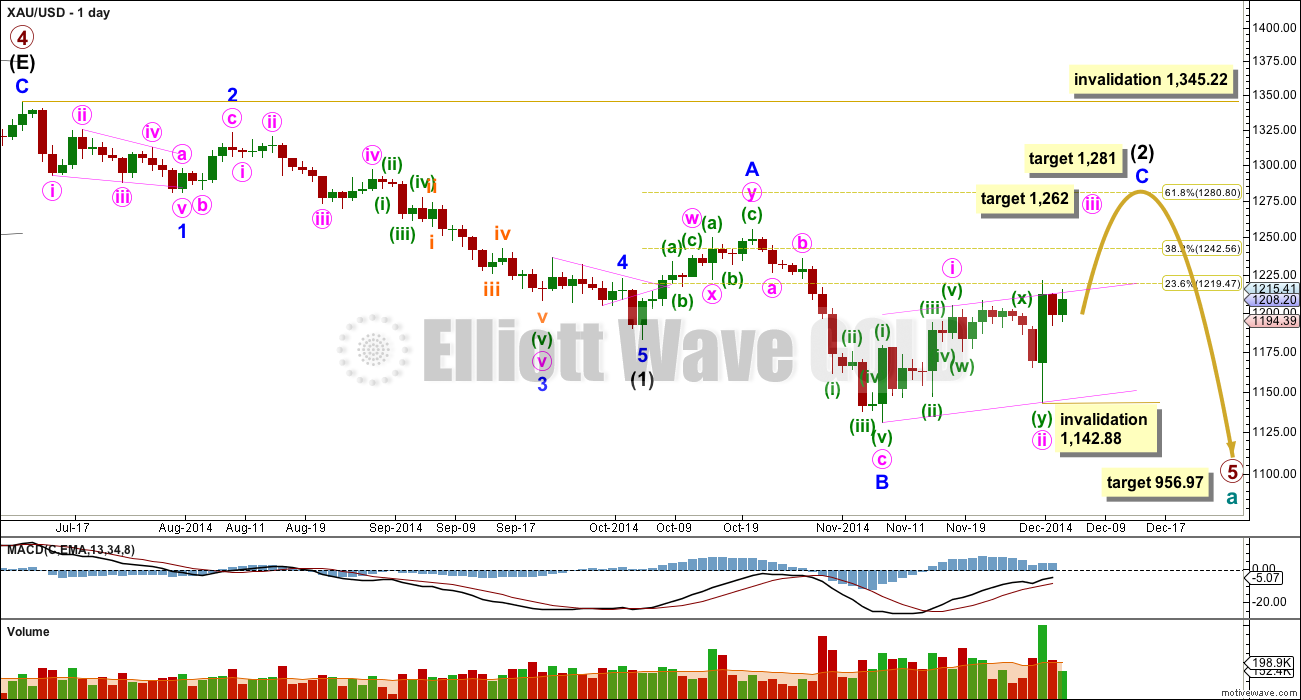
Primary wave 4 is complete and primary wave 5 is unfolding. Primary wave 5 may only subdivide as an impulse or an ending diagonal. So far it looks most likely to be an impulse.
Within primary wave 5 intermediate wave (1) fits perfectly as an impulse. There is perfect alternation within intermediate wave (1): minor wave 2 is a deep zigzag lasting a Fibonacci five days and minor wave 4 is a shallow triangle lasting a Fibonacci eight days, 1.618 the duration of minor wave 2. Minor wave 3 is 9.65 longer than 1.618 the length of minor wave 1, and minor wave 5 is just 0.51 short of 0.618 the length of minor wave 1. I am confident this movement is one complete impulse.
Intermediate wave (2) is an incomplete expanded flat correction. Within it minor wave A is a double zigzag. The downwards wave labelled minor wave B has a corrective count of seven and subdivides perfectly as a zigzag. Minor wave B is a 172% correction of minor wave A. This is longer than the maximum common length for a B wave within a flat correction at 138%, but within the allowable range of less than twice the length of minor wave A. Minor wave C may not exhibit a Fibonacci ratio to minor wave A, and I think the target for it to end would best be calculated at minute degree. At this stage I would expect intermediate wave (2) to end close to the 0.618 Fibonacci ratio of intermediate wave (1) just below 1,281.
Intermediate wave (1) lasted a Fibonacci 13 weeks. If intermediate wave (2) exhibits a Fibonacci duration it may be 13 weeks to be even with intermediate wave (1). Intermediate wave (2) has just begun its eighth week.
The target for primary wave 5 at this stage remains the same. At 956.97 it would reach equality in length with primary wave 1. However, if this target is wrong it may be too low. When intermediate waves (1) through to (4) within it are complete I will calculate the target at intermediate degree and if it changes it may move upwards. This is because waves following triangles tend to be more brief and weak than otherwise expected. A perfect example is on this chart: minor wave 5 to end intermediate wave (1) was particularly short and brief after the triangle of minor wave 4.
Intermediate wave (2) may not move beyond the start of intermediate wave (1) above 1,345.22. I have confidence this price point will not be passed because the structure of primary wave 5 is incomplete because downwards movement from the end of the triangle of primary wave 4 does not fit as either a complete impulse nor an ending diagonal.
To see a prior example of an expanded flat correction for Gold on the daily chart, and an explanation of this structure, go here.
*Note: I am aware (thank you to members) that other Elliott wave analysts are calling now for the end of primary wave 5 at the low at 1,131. I am struggling to see how this downwards movement fits as a five wave impulse: I would label the second wave within it (labelled minor wave 2) intermediate wave (1), and the fourth wave intermediate wave (4) (labelled as a double zigzag for minor wave A). Thus a complete impulse down would have a second wave as a single zigzag and a fourth wave as a double zigzag, which would have inadequate alternation. Finally, the final fifth wave down would be where I have minor wave B within intermediate wave (2). This downwards wave has a cursory count of seven, and I do not think it subdivides as well as an impulse as it does as a zigzag. If any members come across a wave count showing possible subdivisions of a complete primary wave 5 I would be very curious to see it.
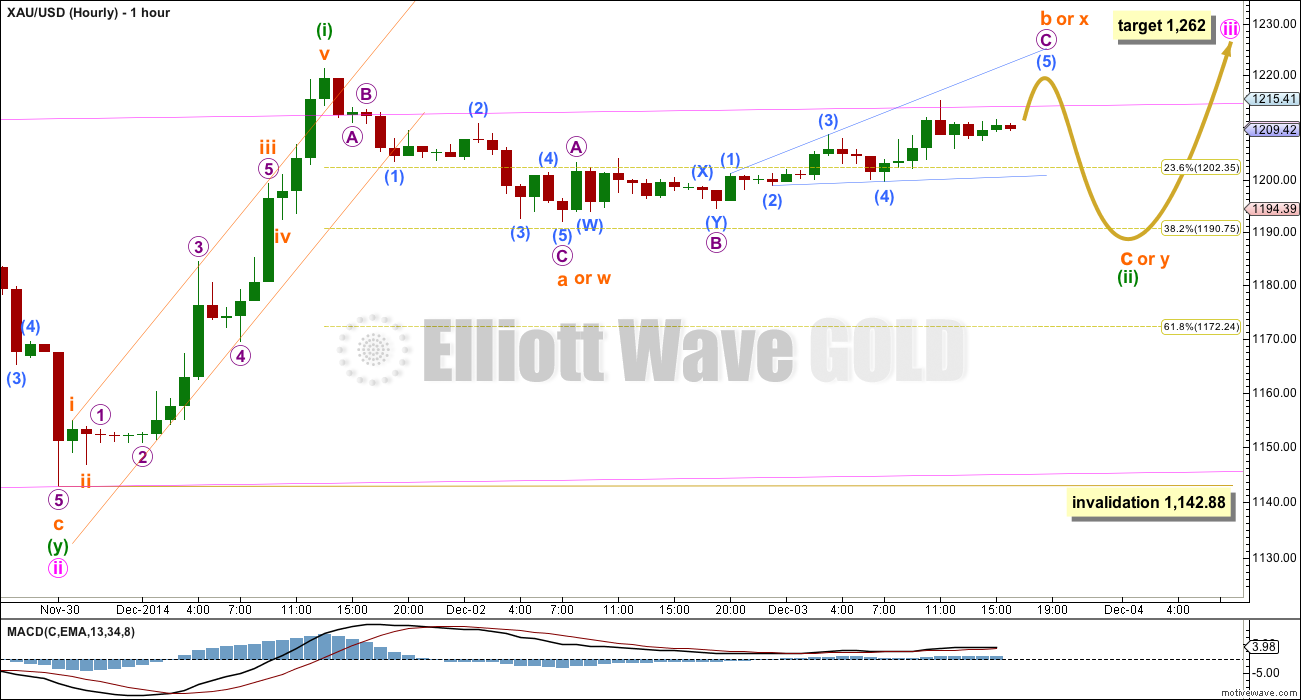
Yesterday, I was unsure if minuette wave (ii) was over or not. Today, I am more confident that it is not over because this slow sideways and upwards movement does not look like the start of the middle of a third wave.
Minuette wave (ii) may continue for another day, and may be unfolding as either a flat correction, double combination or double zigzag.
If it is a flat correction then subminuette wave b within it must reach a minimum 90% length of subminuette wave a at 1,218.41. Subminuette wave b may make a new high above the start of subminuette wave a at 1,221.34 as in an expanded flat. Subminuette wave b must subdivide as a corrective structure. Regular flats move sideways and expanded flats deepen a correction.
If it is a double combination then subminuette wave x within it has no minimum upwards requirement, but it too may make a new high above 1,218.41. Subminuette wave x must subdivide as a corrective structure. Double combinations move sideways.
If it is a double zigzag then subminuette wave x again has no minimum upwards requirement, but is most likely to be relatively shallow and brief. Because this upwards corrective structure looks neither shallow nor brief I expect a double zigzag is the least likely structure for minuette wave (ii). Double zigzags deepen a correction.
Overall I expect more choppy overlapping movement for another 24 hours which is most likely to move just sideways. When it is done I expect a strong upwards breakout for the middle of a third wave.
It is possible that minuette wave (ii) may be an expanded flat or a double zigzag in which case it may move price lower towards the 0.618 Fibonacci ratio at 1,172.24.
Because minuette wave (ii) is not over I do not know where minuette wave (iii) begins, so I cannot calculate a target for it. It may be about equal in length to minuette wave (i) at 78.46.
If my wave count is wrong it may be that minuette wave (ii) is over already. If upwards movement begins to show an increase in momentum then the middle of the third wave may have arrived earlier than expected. Expect any surprises to be to the upside.
This analysis is published about 05:50 p.m. EST.


Every day new EW rules learning: Regular flats move sideways and expanded flats deepen a correction.
Looking at the hour chart noticed a bottom (inverse) head and shoulder pattern which broke out in late afternoon. Head is at wave circle 5, c,a or w.
Neckline across the waves (2) and (3). Shoulders at waves (1) and (4). Long green candle is breakout.
No surprise if gold breaks above pink line to the target of b or x.
??? Lara how deep is the c or y wave green (ii)? Will it accomplish all this in one 24 hour day (one daily candle)? AND gold be ready for ADP Friday for wave (iii) impulse move up?
Thanks Great work!!!