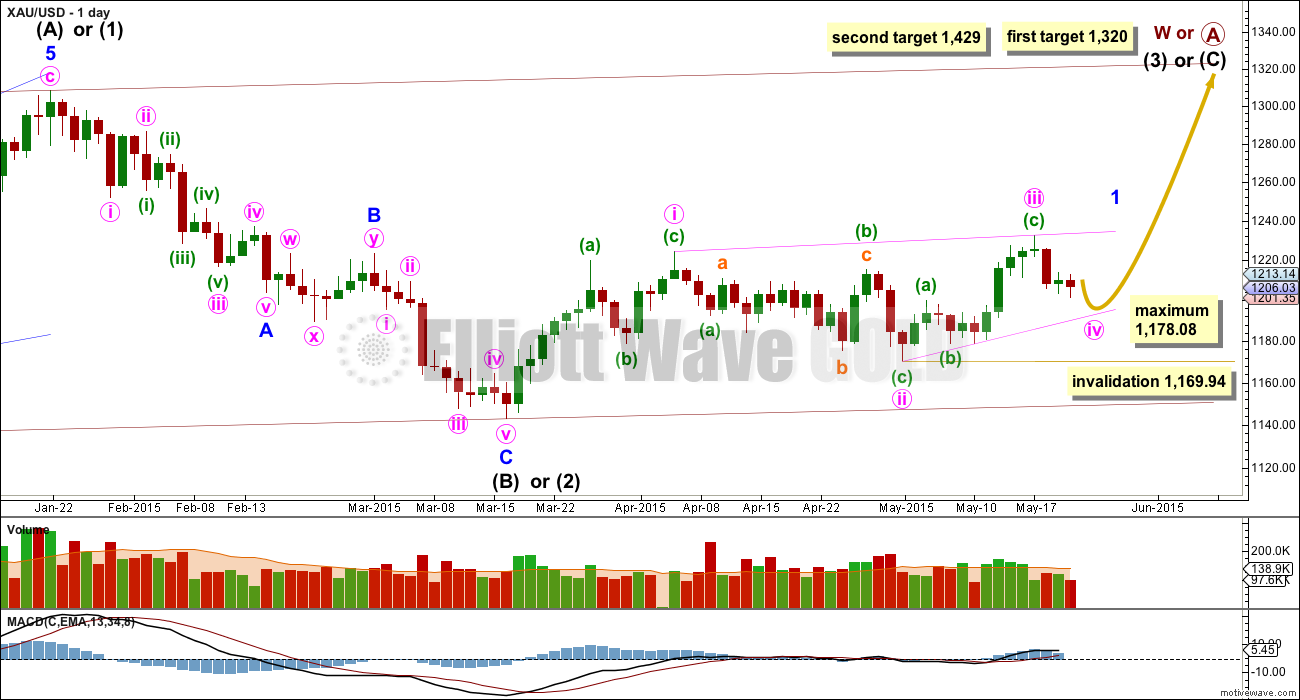
The main bull Elliott wave count expected sideways movement. A small red candlestick fits this Elliott wave count.
Summary: The very short term expects at least a little upwards movement from here to 1,212.96 or above. At any stage, a new low now below 1,200.03 would favour a short term drop to about 1,190, but not below 1,178. While price remains above 1,200.03 all four wave counts will remain valid.
Click charts to enlarge.
To see weekly charts for bull and bear wave counts go here.
Bull Wave Count
The bull wave count sees primary wave 5 and so cycle wave a a complete five wave impulse on the weekly chart.
Pros:
1. The size of the upwards move labelled here intermediate wave (A) looks right for a new bull trend at the weekly chart level.
2. The downwards wave labelled intermediate wave (B) looks best as a three.
3. The small breach of the channel about cycle wave a on the weekly chart would be the first indication that cycle wave a is over and cycle wave b has begun.
Cons:
1. Within intermediate wave (3) of primary wave 5 (now off to the left of this chart), to see this as a five wave impulse requires either gross disproportion and lack of alternation between minor waves 2 and 4 or a very rare running flat which does not subdivide well.
2. Intermediate wave (5) of primary wave 5 (now off to the left of the chart) has a count of seven which means either minor wave 3 or 5 looks like a three on the daily chart.
3. Expanding leading diagonals (of which intermediate wave (A) or (1) is) are are not very common (the contracting variety is more common).
4. The possible leading diagonal for minor wave 1 and particularly minute wave ii within it look too large.
Last week volume shows an increase. This supports the bull count a little, but the increase is not higher than prior down days within the sideways chop. For volume to clearly support the bull wave count it needs to show an increase beyond 187.34 (30th April) and preferably beyond 230.3 (9th April). Only then would volume more clearly indicate a bullish breakout is more likely than a bearish breakout.
Within cycle wave b, primary wave A may be either a three or a five wave structure. So far within cycle wave b there is a 5-3 and an incomplete 5 up. This may be intermediate waves (A)-(B)-(C) for a zigzag for primary wave A, or may also be intermediate waves (1)-(2)-(3) for an impulse for primary wave A. At 1,320 intermediate wave (C) would reach equality in length with intermediate wave (A) and primary wave A would most likely be a zigzag. At 1,429 intermediate wave (3) would reach 1.618 the length of intermediate wave (1) and primary wave A would most likely be an incomplete impulse.
Intermediate wave (A) subdivides only as a five. I cannot see a solution where this movement subdivides as a three and meets all Elliott wave rules (with the sole exception of a very rare triple zigzag which does not look right). This means that intermediate wave (B) may not move beyond the start of intermediate wave (A) below 1,131.09. That is why 1,131.09 is final confirmation for the bear wave count at the daily and weekly chart level.
Intermediate wave (B) is a complete zigzag. Because intermediate wave (A) was a leading diagonal it is likely that intermediate wave (C) will subdivide as an impulse to exhibit structural alternation. If this intermediate wave up is intermediate wave (3) it may only subdivide as an impulse.
It is possible that the intermediate degree movement up for the bull wave count is beginning with a leading diagonal in a first wave position for minor wave 1.
A leading diagonal must have second and fourth waves which subdivide as zigzags. The first, third and fifth waves are most commonly zigzags but sometimes they may be impulses.
Within diagonals, the most common depth of the second and fourth waves is between 0.66 and 0.81. Minute wave ii is 0.67 of minute wave i.
Minute wave iii is now most likely to be a complete zigzag. Minute wave iv down must subdivide as a zigzag, must overlap back into minute wave i price territory, and may not be longer than equality with minute wave ii because this diagonal is contracting. The maximum depth for minute wave iv is at 1,178.08. Minute wave iv may be over in three more days if it lasts a total Fibonacci five days.
Draw the diagonal ii-iv trend line as shown. Minute wave iv is likely to end when price touches this lower trend line, which may be a better guide for it than any price target.
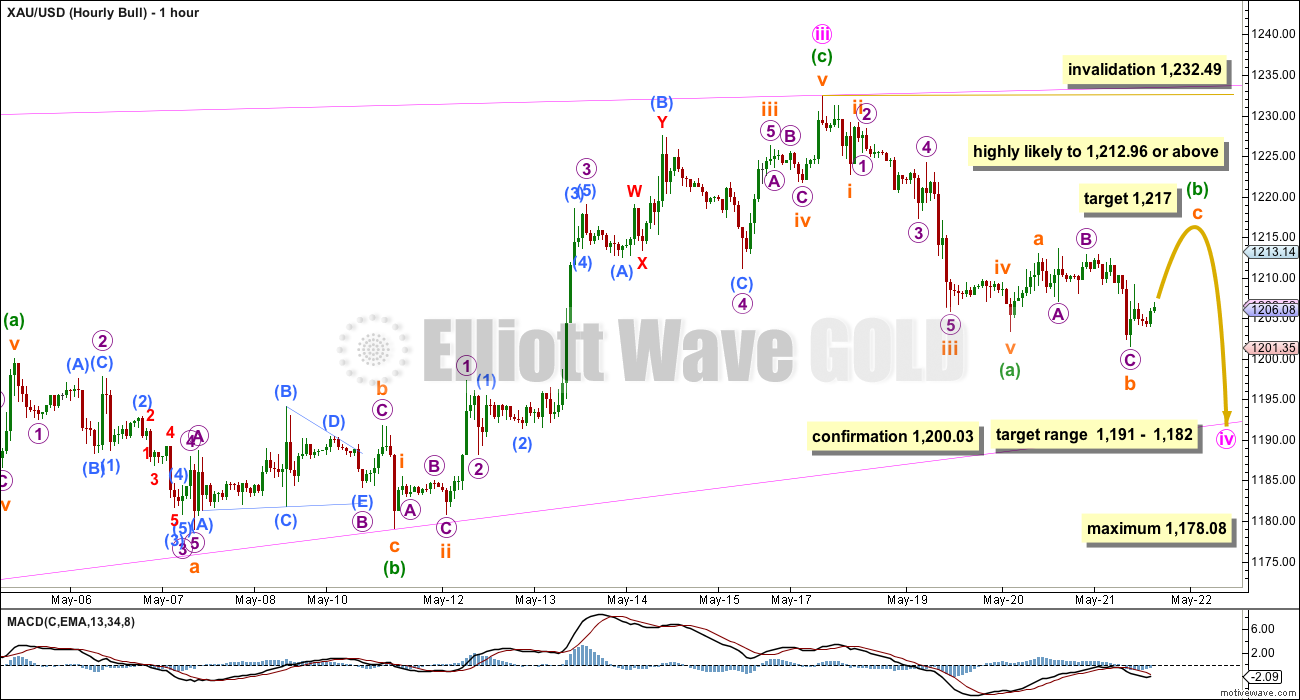
Minute wave iv would be within the common length of 0.66 to 0.81 of minute wave iii between 1,191 to 1,182. When minuette wave (b) within minute wave iv is complete, then I will calculate a narrower target for minute wave iv to end using the ratio between its A and C waves. I may be able to do that tomorrow.
Minuette wave (b) is unfolding as a common expanded flat correction. Within it, subminuette wave b is a 120% correction of subminuette wave a, within the normal range of up to 138%. At 1,217 subminuette wave c would reach 1.618 the length of subminuette wave a. Subminuette wave c is highly likely to move at least slightly beyond the end of subminuette wave a at 1,212.96 to avoid a truncation and a very rare running flat.
Minuette wave (b) may not move beyond the start of minuette wave (a) above 1,232.49.
Price should turn down for a five wave structure to complete for minuette wave (c), when minuette wave (b) is complete. At that stage, a new low below 1,200.03 would confirm this main bull wave count and the alternate bear hourly wave count.
This main bull wave count sees the recent wave up labelled subminuette wave a as a three. It fits only as a double zigzag (which is a three) on the five minute chart.
Alternate Bull Wave Count
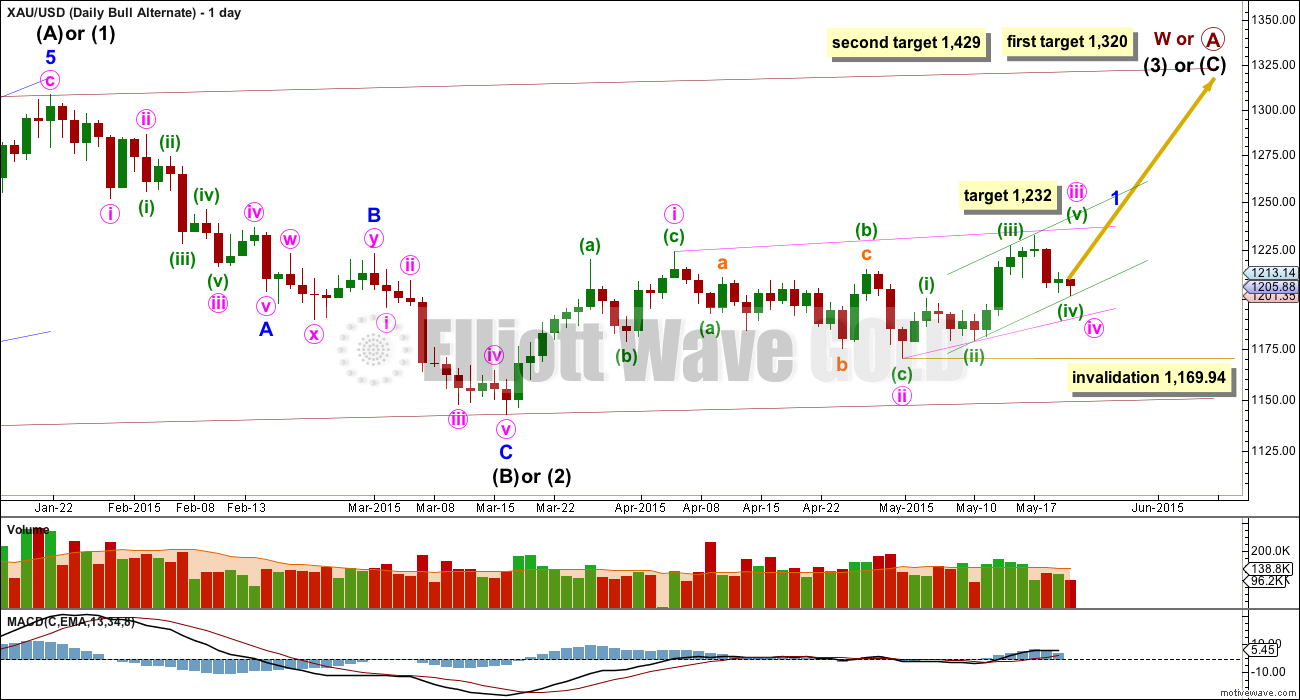
Within a leading diagonal, the second and fourth waves must be zigzags. The first, third and fifth waves are most commonly zigzags (main bull wave count), but they may also be impulses. Both structures must be considered for the bull wave count. The alternate looks at the possibility that minute wave iii is an impulse.
Within minute wave iii, if it is an impulse then minuette wave (iv) subdivides perfectly as an expanded flat correction and must be over here. There is almost no room left for it to move lower, and may not move into minuette wave (i) price territory below 1,200.03.
There is more than one way to see minuette waves (iii) and (iv). This alternate bull hourly wave count sees minuette wave (iii) as just 0.18 short of 1.618 the length of minuette wave (i), and minuette wave (iv) as an expanded flat correction which should be complete. If it moves any lower, it may not move into minuette wave (i) price territory below 1,200.03.
Here minuette wave (ii) is a relatively deep 0.70 zigzag. Minuette wave (iv) exhibits some alternation as a slightly more shallow 0.53 expanded flat.
At 1,232 minuette wave (v) would reach equality in length with minuette wave (i).
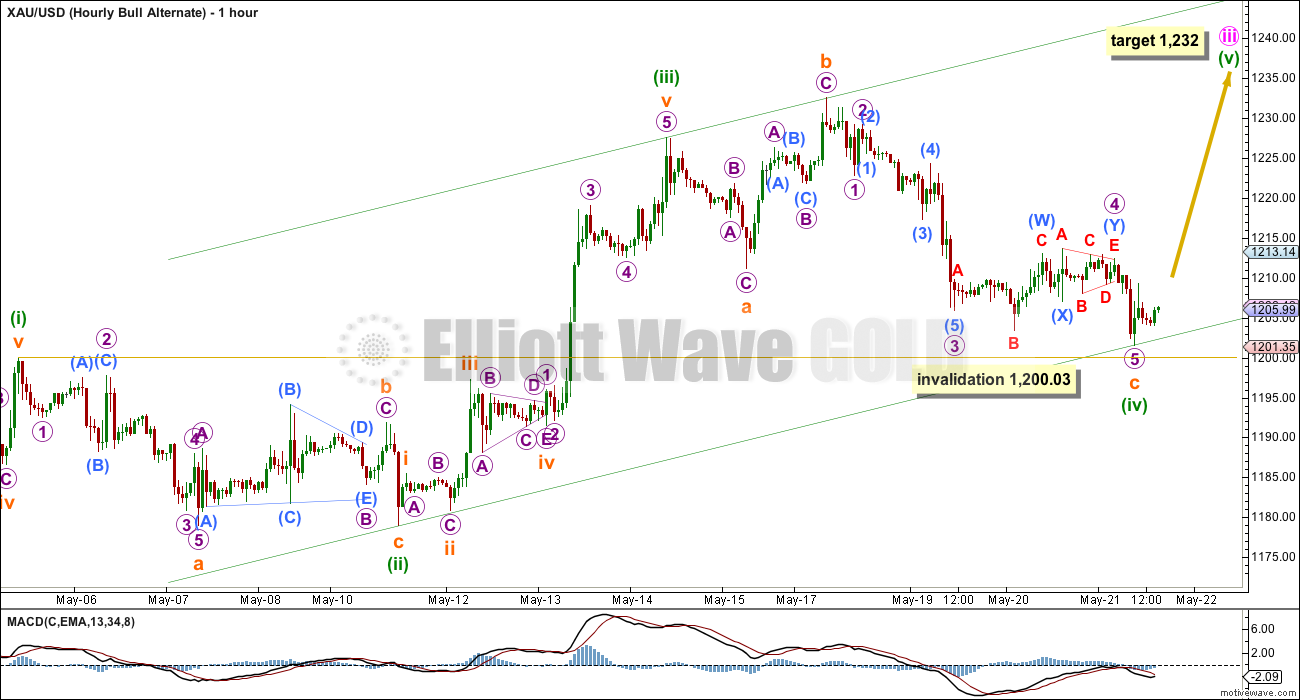
Subminuette wave c looks like a three on the hourly and daily charts now. It should be a five. Because of this problem the main bear hourly chart looks at another way to label this upwards impulse.
This alternate bull hourly wave count must see the upwards wave labelled here minuscule wave C within submicro wave (W) of micro wave 4 as a five. It will not fit as a five on the five minute chart.
Bear Wave Count
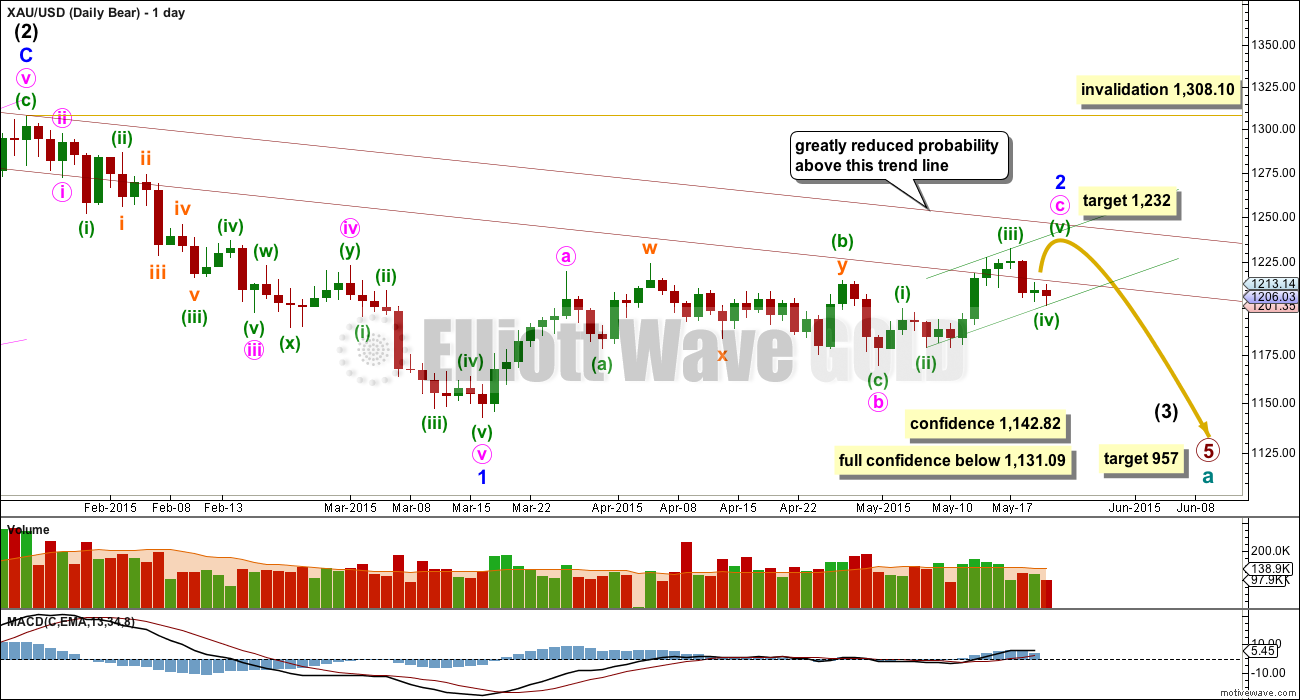
This wave count follows the bear weekly count which sees primary wave 5 within cycle wave a as incomplete. At 957 primary wave 5 would reach equality in length with primary wave 1.
Pros:
1. Intermediate wave (1) (to the left of this chart) subdivides perfectly as a five wave impulse with good Fibonacci ratios in price and time. There is perfect alternation and proportion between minor waves 2 and 4.
2. Intermediate wave (2) is a very common expanded flat correction. This sees minor wave C an ending expanding diagonal which is more common than a leading expanding diagonal.
3. Minor wave B within the expanded flat subdivides perfectly as a zigzag.
Cons:
1. Intermediate wave (2) looks too big on the weekly chart.
2. Intermediate wave (2) has breached the channel from the weekly chart which contains cycle wave a.
3. Minor wave 2 is much longer in duration than a minor degree correction within an intermediate impulse normally is for Gold. Normally a minor degree second wave within a third wave should last only about 20 days maximum. This one is in its 47th day and it is incomplete.
4. Within minor wave 1 down there is gross disproportion between minute waves iv and ii: minute wave iv is more than 13 times the duration of minute wave i, giving this downwards wave a three wave look.
This bear wave count now needs minute wave c upwards to complete as a five wave impulse. The short term outlook for both bull and bear counts is identical.
At 1,236 minuette wave (v) would reach equality in length with minuette wave (i).
Minor wave 2 may not move beyond the start of minor wave 1 above 1,308.10. However, this wave count would be substantially reduced in probability well before that price point is passed. A breach of the upper maroon trend line, a parallel copy of the upper edge of the channel copied over from the weekly chart, would see the probability of this wave count reduced so much it may no longer be published before price finally invalidates it.
There are only two structural possibilities for minute wave c. It must be a five wave structure so it may be only an impulse or ending diagonal. The two wave counts for this bear count will look at both of those structural possibilities.
Main Bear Hourly Count
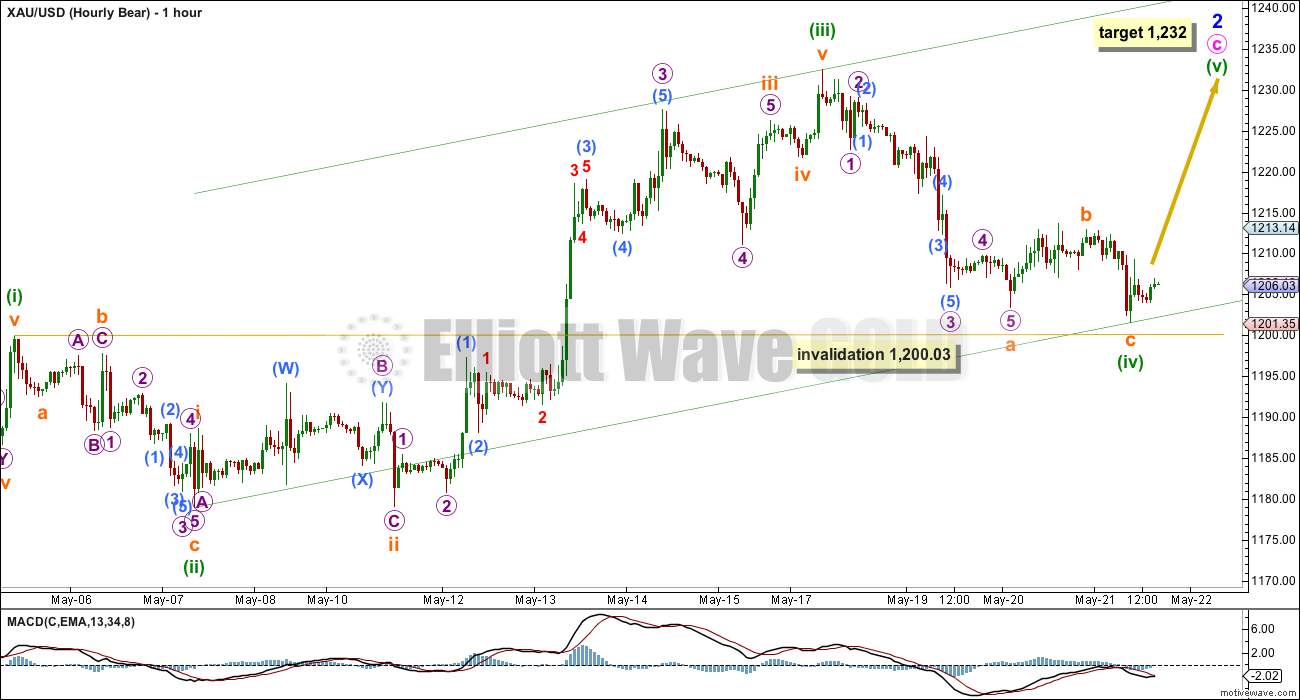
As noted for the alternate bull hourly count, if an impulse is developing upward then there is more than one way to see minuette waves (iii) and (iv). This wave count sees minuette wave (iii) over at the high of 1,232, and minuette wave (iv) as a completed zigzag.
Minuette wave (ii) for this idea is a deep 0.70 zigzag and minuette wave (iv) is a slightly more shallow 0.58 zigzag. There is a little alternation within each structure: the zigzag of minuette wave (ii) has a short a wave and a long c wave and the zigzag of minuette wave (iv) has a long a wave and a short c wave. However, the alternation is less than normal for Gold.
Minuette wave (iii) is 4.8 longer than 1.618 the length of minuette wave (i). The Fibonacci ratio is not as good as the other idea presented for the hourly bull alternate.
This idea does resolve the problem of this downwards wave labelled minuette wave (iv) looking like a three on the daily and hourly charts. Here it is a zigzag.
This wave count must see the recent upwards movement within subminuette wave b as a five (the first wave up within subminuette wave b). It will not fit as a five on the five minute chart.
Alternate Bear Hourly Count
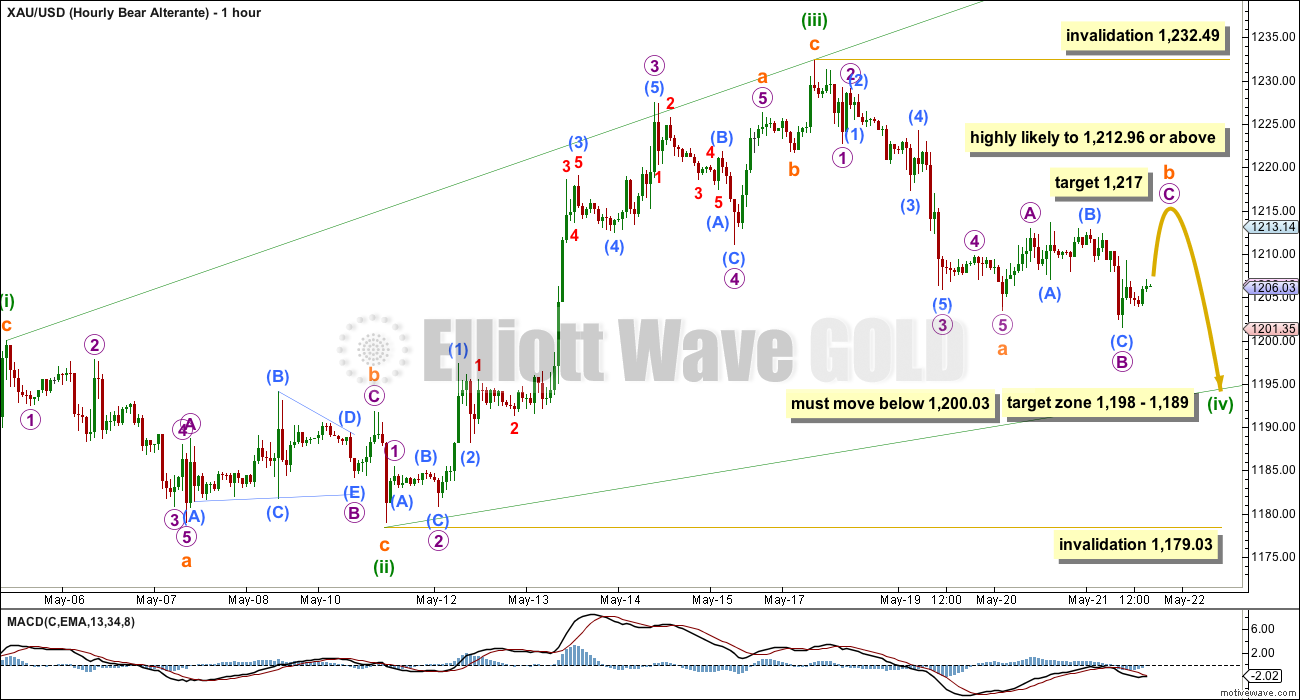
This alternate hourly bear wave count looks at the other structural possibility of minute wave c as an ending diagonal. The diagonal would be expanding: the third wave of minuette wave (iii) is longer than minuette wave (i), and now the fourth wave of minuette wave (iv) is also longer than minuette wave (ii). The trend lines are diverging.
This wave count is an alternate, only because expanding diagonals are less common than simple impulses. The subdivisions for recent movement actually have a better fit.
The wave up labelled here micro wave A within subminuette wave b is seen as a three, and it will only fit as a three on the five minute chart. It is a double zigzag. The main bear wave count (and the alternate bull hourly wave count) must see this as a five which does not fit well at all.
The short term structure is a sideways expanded flat for submineutte wave b which is incomplete. The short term outlook for this wave count is identical to the main bull hourly wave count. At 1,217 micro wave C would reach 1.618 the length of micro wave A.
When subminuette wave b is a completed expanded flat, then subminuette wave c down should unfold as a five wave structure.
Minuette wave (iv) would be within the common range for a fourth wave of a diagonal of 0.66 to 0.81 between 1,198 to 1,189. It must overlap back into minuette wave (i) price territory below 1,200.03 and may not move beyond the end of minuette wave (ii) below 1,179.03.
Technical Analysis
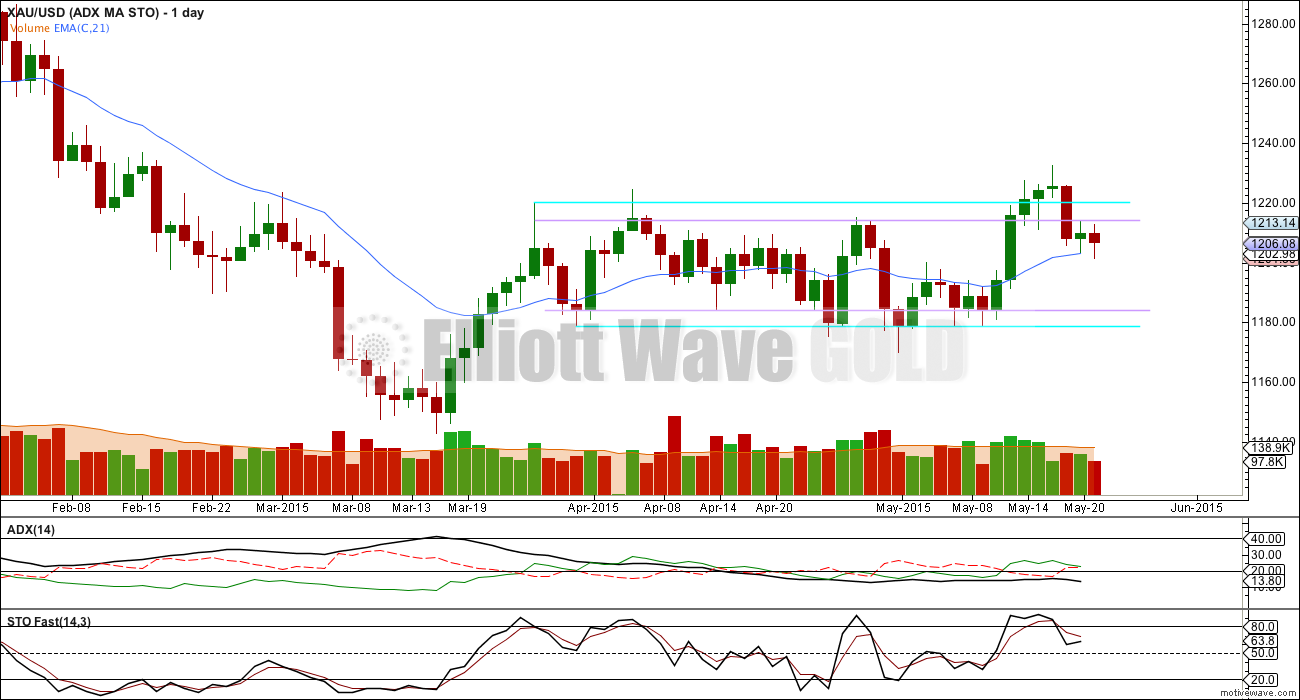
For yesterday’s data ADX had a further slight decline and is comfortably below 15 at 13.80. This indicates no clear trend, low volatility and short swings between support and resistance. An oscillator should be used.
Stochastics has turned lower from overbought territory, indicating a downwards swing should have begun.
The lower horizontal trend lines may provide support and may show where this downwards swing may end.
With slightly lower volume for Thursday’s session, this downwards swing may be close to completion or it may continue yet for another one or two days with further declining volume.
Price has returned to the range which it began back on 27th March. This is a particularly long consolidation period, and so it is important to realise that it will end. The longer it takes the closer to the end it will be. When the breakout eventually comes, volume is still indicating it may be slightly more likely to be down than up, but this is not clear nor definitive.
This analysis is published about 05:17 p.m. EST.

Lara’s May 22nd analysis is out now.
Monday NYSE is closed so no trading GDX or GDXJ or their 3X etfs
That is one bearish engulfing candle on the HUI weekly after getting rejected hard at multi-year downtrend resistance. This is likely my last post here…good luck to all !
Link
http://schrts.co/01XUuA
Farewell Mark and prosperous trading to you.
Mark, your posts have been very helpful. I hope you are not leaving EWG site and that you will continue posting.
Mark
I’m new to this site but I have enjoyed looking at your charts. They are very good. I hope you stick around.
The expanded flat for minuette wave (b) is complete. My target for a downwards wave for the bull count and bear alternate hourly (which I may now swap over to be the main count for the bear) is the same: 1,186.
This target may be met in another two days.
At any time a new low below 1,200.03 would provide confidence in the target.
Lara do you think that 1200.03 will hold today?
So far it looks like Hourly bull or hourly bear alternate hitting 1214.95 in the forecast range. Next would be confirmation below 1200.03.
For today I think it may well hold. I think a very small fourth wave correction is completing right now, and a final fifth wave down may begin before the market closes. It may not begin early enough and / or it may not be long enough to take price below 1,200.03.
I do expect it’s pretty likely that 1,200.03 will be breached on Monday.
Janet Yellen speaks and gold drops again today.
– May 22, 2015 1:00 p.m. ET
http://www.marketwatch.com/story/yellen-sticks-to-forecast-of-rate-hike-this-year-followed-by-gradual-moves-2015-05-22
http://www.marketwatch.com/story/yellen-unmoved-by-soft-data-says-she-expects-rate-hike-this-year-2015-05-22
Gold dropped $12 in half an hour when stronger than expected US CPI report was issued at 8:30 am EST today.
http://www.marketwatch.com/story/consumer-prices-edge-up-01-in-april-while-core-prices-spike-03-2015-05-22
GDX got a hard rejection at the top rail as expected. If 19.75 area doesn’t hold, I can see a trip back down to the 19.20s very quickly.
Tremendous call, Lara. Excellent work!
Yes, I’m really happy with that. It was pretty close to as good as I can get.
It looks to me like Hourly bull and hourly bear alternate which were preferred have sped up and already hit the 1213 – 1217 zone and may have also began their descent to somewhere 1191 – 1182 or 1198 – 1189. Glad I already sold my GDX.
Remember whatever you have at today’s close you’ll be holding over a Long weekend with Monday a NYSE holiday.
Gold price appears to be showing reluctance to break below 1201 with 20dma residing at 1200-01…. Will Gold price break below 1200; it failed to do that on Thursday and todays low so far at 1201.xx is higher than Thursday low….
Tham
Gold hit Lara’s target at 1215. Time to sell GDX,NUGT?????
I am selling at the opening.
YOP (Your pinion pleaase)??
Your post was not updated in real time. Only saw it now. Yes, price is already dropping. I also offloaded all my NUGT. Prepared to short with DUST for next week.
I am waiting for the fifth wave of subminuette c of minuette b for the bull / alternate bear count to end before shorting with DUST. I expect the rise to around 1209. The drop will reach 1188-1186. The target should be reached on Tuesday.
The fifth wave has just started only a while back. It may most likely not reach 1209 by the time the market closes. I will however still buy DUST at whatever high the price reaches. 1209 will probably be reached on Monday Asian market time but I couldn’t buy it then. There is some risk with this trade so I am putting in only a small position.
Good idea I think. I sold before the close Thursday as didn’t feel bullish on gold and long weekend approaching.
Rambus sees $USD consolidation pattern, then big move up
http://rambus1.com/?p=37716
USD is certainly on fire today.
Comments now inverted
We discovered a security hole in Disquis today. So we’ve replaced it with regular WordPress comments. We’ve added a plugin so you can upload charts.
Most unfortunately this means any charts uploaded to the old Disquis comments have gone. But you’ll be able to upload charts still.
The old comments synched over from Disquis, but the uploaded charts didn’t.
Security hole fixed though.
Thanks for the update. Looks like we still need to scroll to the bottom to submit a new post (unless we are replying to another post). I hope the security issues with disquis can be resolved and you choose to switch back.
Also appears that you can no longer edit a post after it has been submitted. That was a valuable feature of disquis.
IKR! You’re all going to see my typos and hideous grammatical errors now.
I did like Disquis. It worked well. But when posts were private all your comments could be accessed via the EWG Disquis profile. Not obvious to get to, but it was there. And I’m pretty sure members want these daily discussions to be private, for members only.
We only found this security hole two days ago and have been scrambling to find a fix. So far WP with the plugin for chart uploads is the best solution we can find.
I noticed something funny with the way the comments looked when I posted about the video at May 22, 2015 at 2:35 am.
Lara, what happened to disquis? Old posts are missing charts, post sort is inverted, and we no longer have the option of choosing our moniker.
..???
This usually isn’t bullish. Gold and Silver margins cut.
http://www.cmegroup.com/tools-information/lookups/advisories/clearing/files/Chadv15-139.pdf
I’ll take your word on it. I didn’t want to read all 69 pages of it.
Basically, anyone buying futures contracts on margin will not be a little closer to a margin call…so either deposit funds or sell positions. Likely means more volatility.
Awesome! Thanks for the info. This is great news for me as a futures trader.
Actually exchanges lower margins when volatility decreases. Doesn’t mean anything beyond that.
Seems like lower initial capital and maintenance would be bullish, not bearish. Investors can buy more with less money. Why do you say this is bearish?
Hourly Bear Alternative preferred over Hourly Bull due to the depth of the expected drop…. Either or both waves counts are good to go for me! Upside toppy (1212 with 1218-19 {200dma} on the outside, may get curtailed by 5dma 1214-15); pullback / short term down move is expecting (requires a break below 1204)….. Not expecting the drop to get below 1195 with downside risk 1187….
The exhaustive, island-filled gap reversal pattern I pointed out on 5/15 is playing out according to script so far on GG. Neckline not far below…..it’s the biggest component of the GDX.
Meanwhile the HUI looks like it has completely unraveled after hitting long term resistance in an island-top manner. With this said, backfilling of the overhead gap wouldn’t surprise me at some point but make no mistake, this has bearish written all over it.
Lara_ Request for daily read of the fabulous report may I suggest- for old material any change the font to Italica or some thing different to differentiate from latest material
Just a suggestion!!!!!
To speed up the process lately I just look at the charts and watch the video. Lots easier that reading the fine print, which is very well written and a tribute to Lara’s skills and abilities. Probably the most detailed analysis on gold in the world. In the meantime can still wish that gold starts trending in May and before summer crosses either 1,308.10 or 1,131.09.
Good idea, will see how I can make it work.