A little downwards movement was allowed for. Price remains within the channel and above the invalidation points which are very close by.
Summary: Both bull and bear wave counts now expect upwards movement for a few days. The bull wave count has a minimum requirement at 1,232.49 and a maximum at 1,246.37. Upwards movement for the bull count may last about five days. The bear count requires upwards movement to a minimum at 1,237.28 and its maximum is the upper maroon trend line on the daily chart. It may last a little longer, maybe eight days. I favour the bull wave count.
To see weekly charts for bull and bear wave counts go here. Changes to last analysis are italicised.
Bull Wave Count
The bull wave count sees primary wave 5 and so cycle wave a a complete five wave impulse on the weekly chart.
Pros:
1. The size of the upwards move labelled here intermediate wave (A) looks right for a new bull trend at the weekly chart level.
2. The downwards wave labelled intermediate wave (B) looks best as a three.
3. The small breach of the channel about cycle wave a on the weekly chart would be the first indication that cycle wave a is over and cycle wave b has begun.
Cons:
1. Within intermediate wave (3) of primary wave 5 (now off to the left of this chart), to see this as a five wave impulse requires either gross disproportion and lack of alternation between minor waves 2 and 4 or a very rare running flat which does not subdivide well.
2. Intermediate wave (5) of primary wave 5 (now off to the left of the chart) has a count of seven which means either minor wave 3 or 5 looks like a three on the daily chart.
3. Expanding leading diagonals (of which intermediate wave (A) or (1) is) are are not very common (the contracting variety is more common).
4. The possible leading diagonal for minor wave 1 and particularly minute wave ii within it look too large.
For volume to clearly support the bull wave count it needs to show an increase beyond 187.34 (30th April) and preferably beyond 230.3 (9th April). Only then would volume more clearly indicate a bullish breakout is more likely than a bearish breakout.
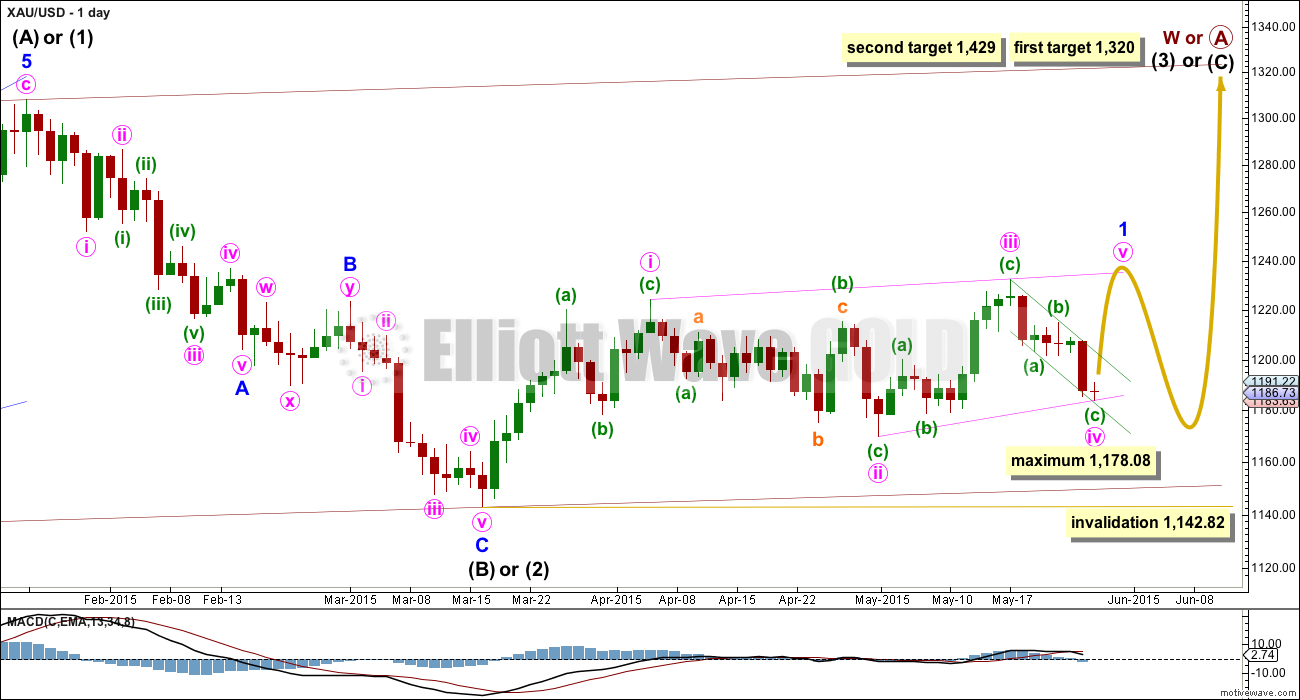
Within cycle wave b, primary wave A may be either a three or a five wave structure. So far within cycle wave b there is a 5-3 and an incomplete 5 up. This may be intermediate waves (A)-(B)-(C) for a zigzag for primary wave A, or may also be intermediate waves (1)-(2)-(3) for an impulse for primary wave A. At 1,320 intermediate wave (C) would reach equality in length with intermediate wave (A) and primary wave A would most likely be a zigzag. At 1,429 intermediate wave (3) would reach 1.618 the length of intermediate wave (1) and primary wave A would most likely be an incomplete impulse.
Intermediate wave (A) subdivides only as a five. I cannot see a solution where this movement subdivides as a three and meets all Elliott wave rules (with the sole exception of a very rare triple zigzag which does not look right). This means that intermediate wave (B) may not move beyond the start of intermediate wave (A) below 1,131.09. That is why 1,131.09 is final confirmation for the bear wave count at the daily and weekly chart level.
Intermediate wave (B) is a complete zigzag. Because intermediate wave (A) was a leading diagonal it is likely that intermediate wave (C) will subdivide as an impulse to exhibit structural alternation. If this intermediate wave up is intermediate wave (3) it may only subdivide as an impulse.
It is possible that the intermediate degree movement up for the bull wave count is beginning with a leading diagonal in a first wave position for minor wave 1.
A leading diagonal must have second and fourth waves which subdivide as zigzags. The first, third and fifth waves are most commonly zigzags but sometimes they may be impulses. The fourth wave must overlap first wave price territory.
Within diagonals, the most common depth of the second and fourth waves is between 0.66 and 0.81. Minute wave ii is 0.67 of minute wave i. So far minute wave iv is 0.88 of minute wave iii, a little deeper than normal range.
The maximum depth for minute wave iv is at 1,178.08 where it would reach equality in length with minute wave ii. Because the diagonal is contracting the fourth wave may not be longer than equality with the second wave, should be shorter, and the trend lines should converge. Minute wave iv is now most likely to be over.
Second wave corrections following leading diagonals in first wave positions are commonly very deep. When this leading diagonal structure for minor wave 1 is complete, then minor wave 2 should unfold lower, may be expected to reach at least the 0.618 Fibonacci ratio of minor wave 1 or may be quite a bit deeper than that, and may not move beyond the start of minor wave 1 below 1,142.82.
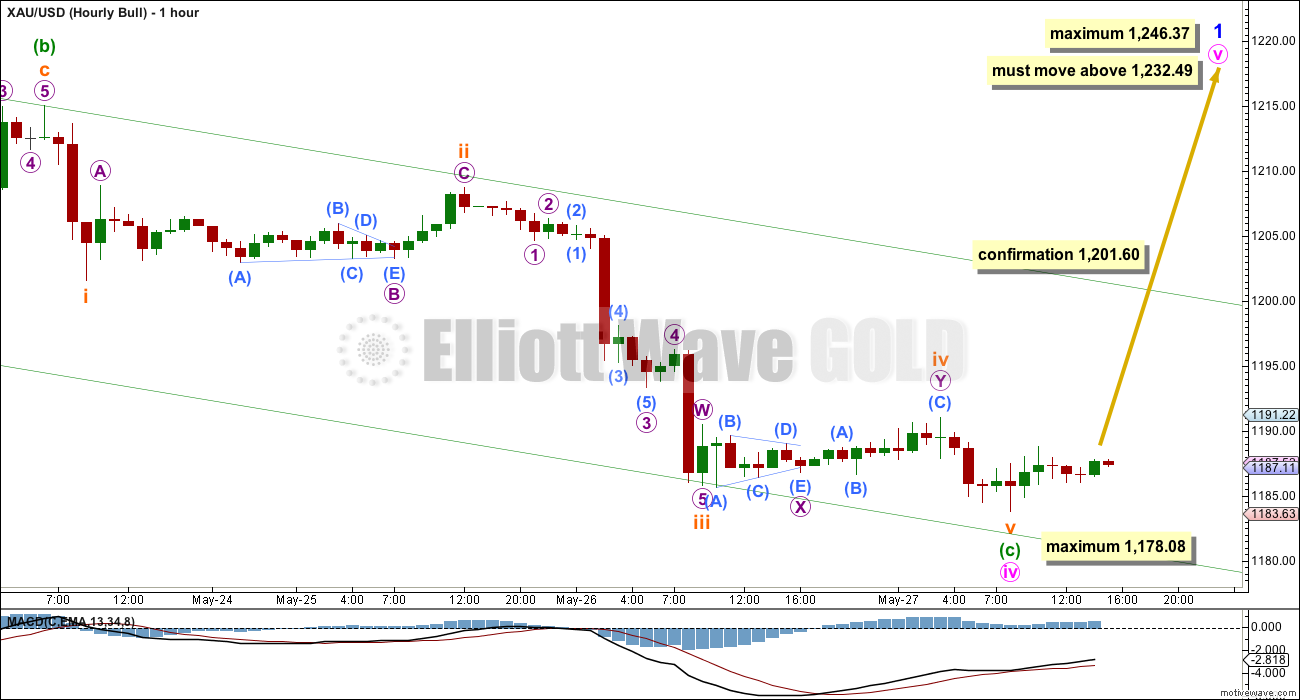
Minute wave iv is now a completed zigzag. Minuette wave (c) is 2.15 longer than equality in length with minuette wave (a).
Ratios within minuette wave (c) are: subminuette wave iii is 1.2 longer than 1.618 the length of subminuette wave i, and subminuette wave v has no adequate Fibonacci ratio to either of subminuette waves i or iii.
Within minuette wave (c), there is good alternation between subminuette waves ii and iv: subminuette wave ii is a relatively deep 0.53 zigzag and subminuette wave iv completed as a more shallow 0.23 double combination.
Minuette wave (c) now looks like a five wave structure.
If minute wave iv continues any further it may not move below 1,178.08.
Minute wave v must make a new high above the end of minute wave iii at 1.232.49 because the fifth wave of a leading diagonal may not be truncated. Minute wave v is most likely to end with a small overshoot of the i-iii trend line (seen on the daily chart).
The diagonal is contracting and so the final fifth wave may not be longer than equality in length with the third wave which would be achieved at 1,246.37. The third wave is shorter than the first wave, and a third wave may not be the shortest.
Minute wave v is most likely to subdivide as a zigzag. It may last a Fibonacci five days.
Depending on your risk appetite and approach to this analysis, there are two things you may look for to provide confidence that the next upwards swing has begun / is underway. A clear breach of the green channel drawn about the downwards wave of minute wave iv would provide trend channel confirmation of a trend change. A new high above 1,201.60 would provide price confirmation of a trend change; at that stage upwards movement may not be a fourth wave correction within minuette wave (c) and so minuette wave (c) would have to be over.
While there is no confirmation of a trend change, I will leave the invalidation point at 1,178.08. However, today I have a reasonable amount of confidence that the next upwards swing has begun.
Bear Wave Count
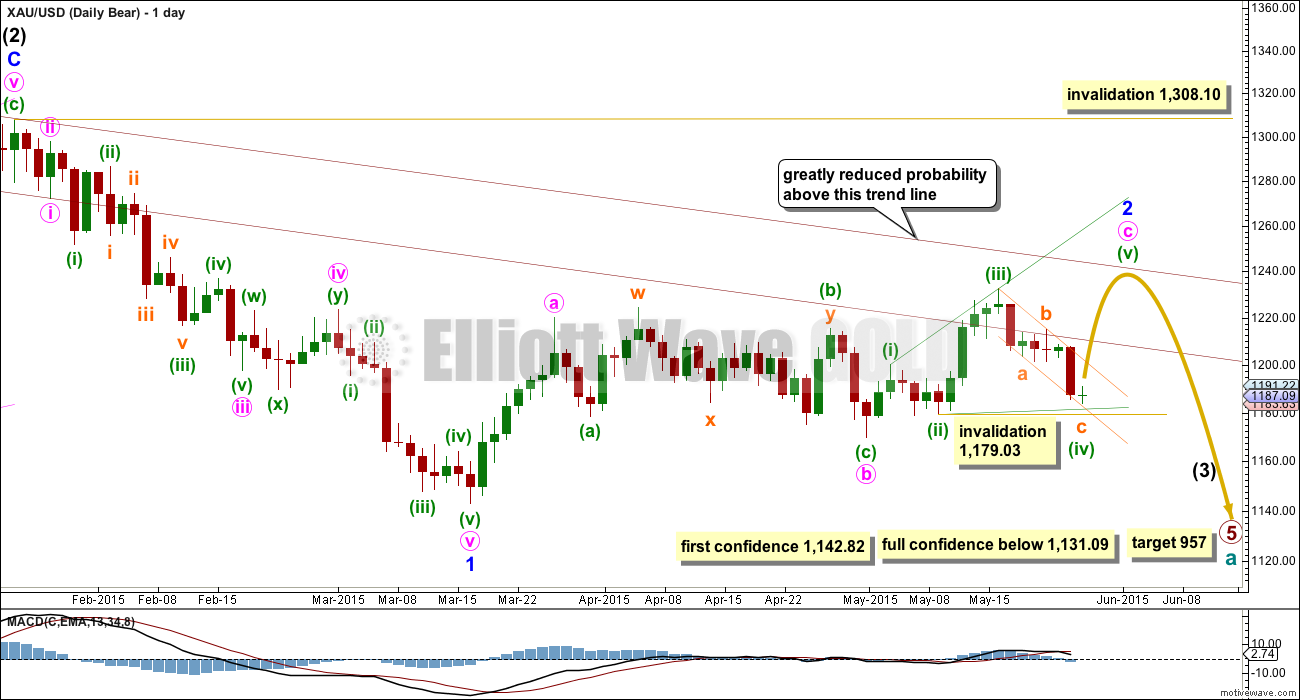
This wave count follows the bear weekly count which sees primary wave 5 within cycle wave a as incomplete. At 957 primary wave 5 would reach equality in length with primary wave 1.
Pros:
1. Intermediate wave (1) (to the left of this chart) subdivides perfectly as a five wave impulse with good Fibonacci ratios in price and time. There is perfect alternation and proportion between minor waves 2 and 4.
2. Intermediate wave (2) is a very common expanded flat correction. This sees minor wave C an ending expanding diagonal which is more common than a leading expanding diagonal.
3. Minor wave B within the expanded flat subdivides perfectly as a zigzag.
Cons:
1. Intermediate wave (2) looks too big on the weekly chart.
2. Intermediate wave (2) has breached the channel from the weekly chart which contains cycle wave a.
3. Minor wave 2 is much longer in duration than a minor degree correction within an intermediate impulse normally is for Gold. Normally a minor degree second wave within a third wave should last only about 20 days maximum. This one is in its 51st day and it is incomplete. It is now starting to look ridiculous; this is becoming a serious problem for the bear wave count.
4. Within minor wave 1 down, there is gross disproportion between minute waves iv and ii: minute wave iv is more than 13 times the duration of minute wave i, giving this downwards wave a three wave look.
This bear wave count now needs minute wave c upwards to complete as a five wave structure which looks most likely at this stage to be an ending expanding diagonal.
Minor wave 2 may not move beyond the start of minor wave 1 above 1,308.10. However, this wave count would be substantially reduced in probability well before that price point is passed. A breach of the upper maroon trend line, a parallel copy of the upper edge of the channel copied over from the weekly chart, would see the probability of this wave count reduced so much it may no longer be published before price finally invalidates it.
When the ending diagonal structure is complete, then this bear wave count expects a strong third wave down for minor wave 3 within intermediate wave (3). At that stage, a new low below 1,142.82 would provide strong indication that the bear wave count would be more likely than the bull wave count. Only a new low below 1,131.09 would provide full confidence.
The expectation for the bear wave count in the short to mid term is also for upwards movement.
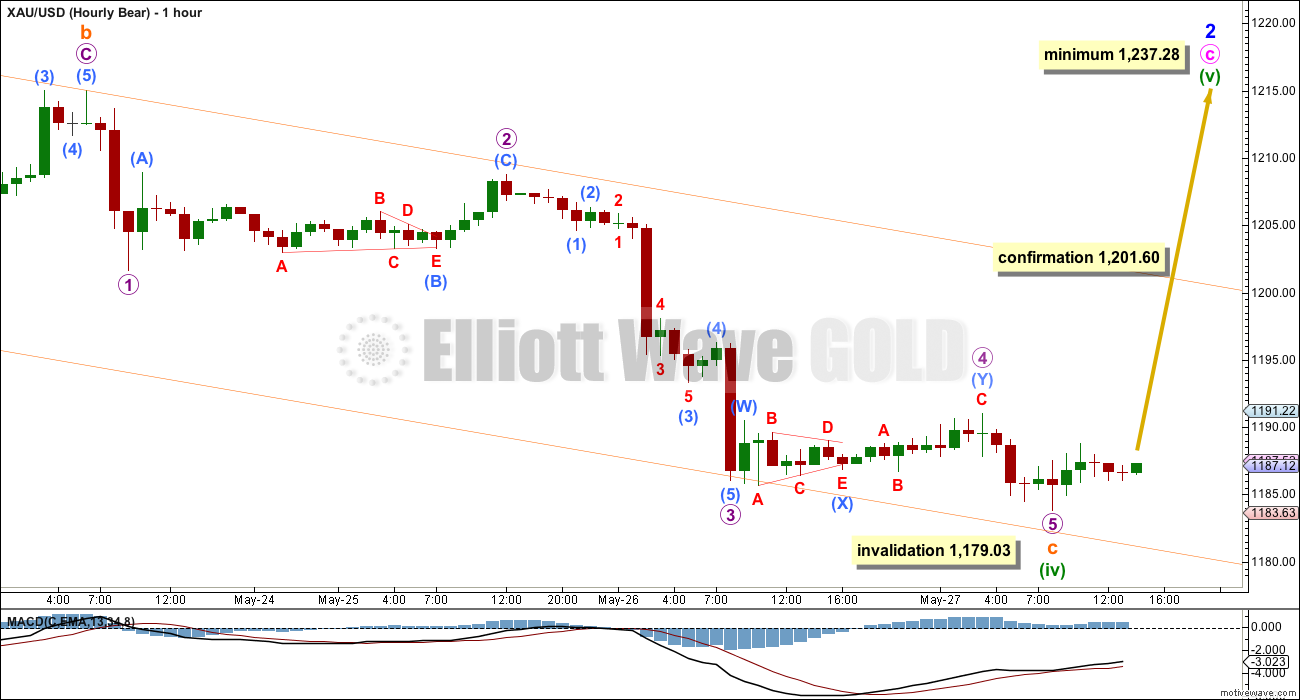
For this bear wave count the diagonal is an ending expanding diagonal. This requires the final fifth wave of minuette wave (v) to be longer than minuette wave (iii) so upwards movement must move to at least 1,237.28 and most likely above.
The downside risk today is 1,179.03 for the bear wave count. If minuette wave (iv) continues any further it may not move beyond the end of minuette wave (ii).
For an ending diagonal all sub waves must be zigzags. Minuette wave (v) must subdivide as a zigzag.
Because this diagonal is expanding the final fifth wave is likely to be longer in duration as well as length. Minuette wave (i) lasted a Fibonacci two days and minuette wave (iii) lasted a Fibonacci five days. Minuette wave (v) may last a Fibonacci eight days.
Technical Analysis
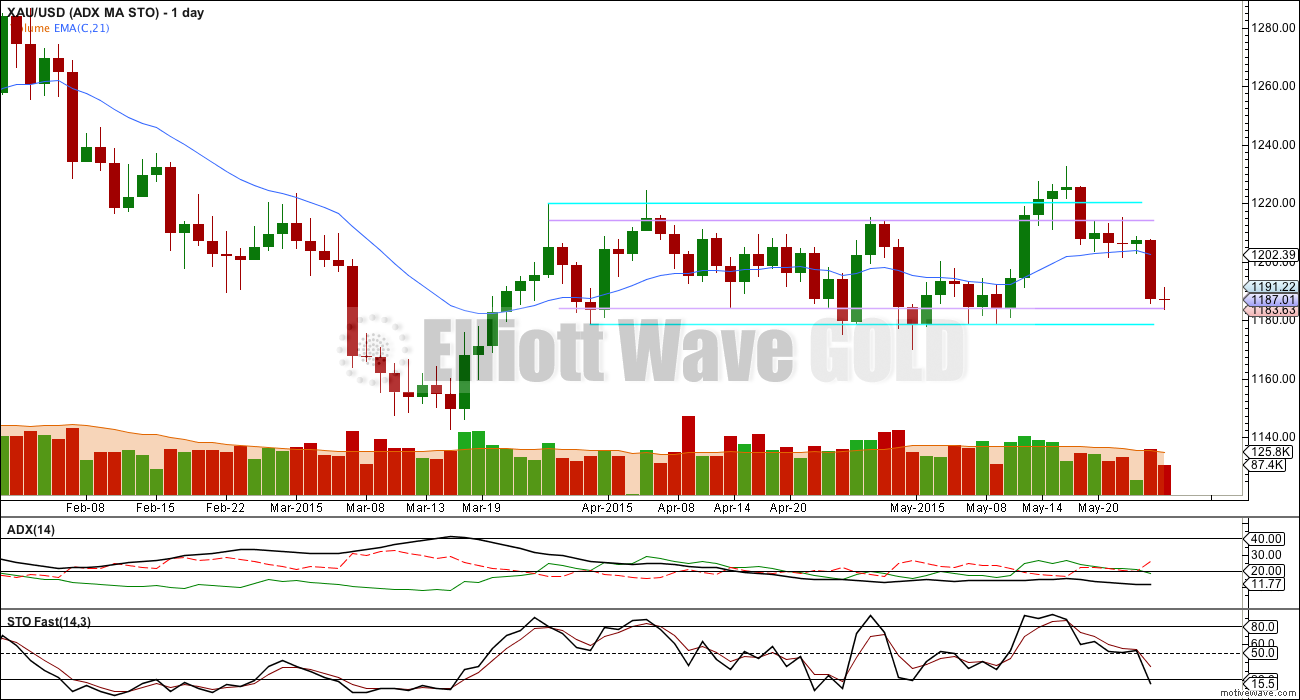
ADX is still flat and below 15 indicating no clear trend. Sideways movement with short swings and low volatility should still be expected.
For yesterday’s downwards day Stochastics came down to just below 20. This may be an indication that the downwards swing is either over or very close to it, and the next upwards swing may now be expected.
Price has come to touch the lower lilac trend line which provided support back on 14th April. Downwards movement may end there, but it could yet continue a little lower to touch the lower aqua trend line.
The regular technical analysis picture still supports the Elliott wave count for both bull and bear. An upwards swing from this point would nicely fit all.
This analysis is published about 04:17 p.m. EST.

Sold some nugt, looks like we are gonna get a retrace tommorow, gonna load up for a third wave blast tommorow!
I did sell some GDX also. Was looking for a retrace today, but tomorrow is fine. Please let me know when the third wave up is about to begin.
Selling some today, also reduces any risk with Friday 8:30 am big news, “U.S. GDP data due Friday will give the market clues on the strength of the U.S. economy — and should drive gold until next Wednesday, said Chintan Karnani, chief market analyst at Insignia Consultants.”
Lara is there any significant retrace expected soon before the weekend.
After today’s drop to 1180.55 gold jumped to 1190.16 and the retrace at 12:00 was only .425 although I was expecting .618. Silver’s retrace at 12:00 was .618.
This mornings drop really spooked gold investors but thankfully you warned that minuette wave (iv) was over or almost over so I bought GDX close to the low.
There is big US GDP news Friday 8:30 am that we need to be bullish gold for this rally to continue. If it is then we may get confirmation above 1201.60 Friday.
A second wave correction could most certainly bring price back down to close to 1,180.36 (not below).
I would expect the first wave up to start from here with a green candlestick, so the second wave correction may not begin until the end of Friday’s session or maybe more likely Monday (possibly even Tuesday)
Because if we see the next wave up start from here it should be clear on the daily chart, which means at least one or two green candlesticks.
Within the first wave up there will be a lower degree second wave which shouldn’t show on the daily chart. That most certainly could take price a lot lower, maybe even close to 1,180.
We need to see a new high above 1,192.29 before I’ll have any confidence that the next wave is up and that it’s started.
The sharp thrust down looks like the final fifth wave, which happened after the fourth wave moved further sideways as an expanded flat correction.
I’ve checked the last wave down on the five minute chart. Although it looks like a three on the hourly chart (which concerned me) it subdivides nicely as a five on the five minute chart; there is a time consuming triangle for the fourth wave. So it’s a good five, so that certainly could be the last wave down.
There’s almost no room left for it to move into now. It has to go up from here for both wave counts.
I’ll be looking for alternates today which can see it keep going down from here, but so far I can’t find any.
So now both wave counts need upwards movement. Earliest confirmation now would come above 1,192.29. That would confirm the last fifth wave should now be over.
Thereafter next confirmation is a breach of the channel on the hourly chart.
Final price confirmation still above 1,201.60.
Depending on your risk appetite and trading style, you may like to wait (or not) for confirmation. As each condition is met the confidence in the next wave up will increase.
Bull minimum is 1,232.49, maximum is now 1,242.91.
Bear minimum is now 1,233.82.
And as yesterday, it should take 5 or 8 days to get there.
All my trading momentum indicators are bullish for GDX,GDXJ and NUGT,
In 2 hour period for trading these indicators have x-over to up.
1) True Strength Indicator TSI
2) MACD (5,35,5) with ema 13 and 34
3) ADX +D1 and -D1
Once we have chart posting capability restored will post chart.
Papudi, that is great technical analysis.
US oil is bouncing back up per these MI’s. But long term it is a short just like Lara is predicting.
Once this bounce is over to other sife will dhort US oil to $20.
These MI works well.
Papudi – How do you trade oil if Lara only produces an EW oil analysis maybe once a month? I would trade oil if Lara did a daily oil EW.
Is there another expert analyst with regular analysis whom you trust for oil?
Papudi, please update us when your MI changes to down on oil. I like possible long-term short on oil. Problem is knowing when to enter that short position.
Two hours ago I bot small bite UCO at 43.02. MI’s have turn up.
Yes waiting for this bounce to be over in few days and Lara confirms completion of wave iv I will be looking for MI’s to give short signal
I will post then.
I will post US oil comments on US oil thread from now on.
Is this a 2nd wave retrace up from 11:13 peak at 1190.16 and gold is about to retrace down now at 1:10 pm?
Any counts?
Did gold just complete a 5 wave count up at 1190.16 at 11:13 am? Any wave count anyone?
I’m looking to watch for retrace targets in case I can play some intra day swings.
I am just wondering; failure to take out 1190-92 now after this latest drop would likely see Gold price down to 1175-73….
could be wrong , i got nugt in a 4th of a 5th of a 5th, will start to buy under 10.35
NUGT low was 10.33 before 10 am. Today’s low was short lived, down then up in 40 minutes, and I think wave (iv) surely ended at 10:00 am low of 1180.55. Then minuette wave (v) started.
🙂 🙂 🙂 🙂
i am wrong, bottom is in, to the moon we go
On the way to the moon I’ll sell my GDX when gold is between bearish upper maroon trend line 1240 and bullish 1246 target and buy DUST cheap. Then on the return far out and groovy trip back from the Dark Side of the Moon, I’ll scan for Lara’s analysis projection and get ready to sell DUST as we splash down in the Pacific just off the coast of Paradise Island with mucho Corona, women and a treasure chest of gold to celebrate our trip of a lifetime like heroes.
I just bought GDX at a great price.
Nice job! I bought yesterday.
Thanks, I almost bought near the Wednesday close thinking I had missed the bottom. So today I was anxious to buy when I saw gold dropping. I didn’t expect it to go so low. Now let the US dollar step down and let gold step up for some respect.
even better prices ahead!
http://schrts.co/UBTL53
i got nugt in a 5th of a 5th down, will be loading up at the bottom sometime today for the blast up!!!
Nice call!
Lara, should’ve asked yesterday, been wondering two days now…..
what if – just what if – price drops below 1178.08?
bear invalid, bull re-work. what might be the possibles then? strange 5th wave? don’t have a clue.
Thank you for your insight here.
ATM I don’t have a count for that. I’ve been looking for one… and I’ll spend more time on it today… and will publish as an extra update if I find something…
the problem is that whole move labelled minute wave b (pink circle) on the daily chart. there are only so many ways that will subdivide, only a few EW structures it will fit into
I can see a couple of ideas but they don’t have the right look at all. they look very forced.
Really do appreciate your looking into this. I guess I was thinking also perhaps by now you’ve found additional historical data for gold that would shift the wave counts a bit. (I’ve forgotten your source for historical data). Anyway, so glad you’re on the gold analysis
I know there is an overwhelming sentiment here that gold is on its way back up to the 1240 area from here. I just don’t see it. The sell volume that we’ve seen on the down days has been as large as the Jan 2015 action which kicked off the plunge from 1280 to near 1140. There is a ton of overhead resistance and the fork fit/confluence I posted a week or so ago has played out exactly as I suspected. The miners have continued to lead the metal and those charts have completely fallen apart. Good luck.
http://schrts.co/HgiBFl
Agreed Mark,
No strength here
Gold broke above the trend in January and March and can do so again starting today.
Yes at this morning’s low it looked like no strength in gold.
However that was the bottom of minuette wave (iv) where things look the worst.
However at 1180.55 at 10:00 am minuette wave (v) began gold’s and GDX’s rise from the ashes to rise above the bearish expectations and push gold to a new high for the last month.
My money is Bullish. Lara’s two wave counts are both very bullish. We’ll see in about a week how high Gold is.
When gold goes above 1201.60 we will have confidence in the bullish wave count.
A VIEW: This is going to be truly fascinating (awesome) to see how with 1184-83 holding, Gold price gets to 1232.49/1237.29…. As of now 1192-96, 1199, 1213, 100dma-200dma (1211-16) with 1227-30 on the outside is seen as curtailing…. On weekly outlook basis the trend is down playing to a bearish key reversal…. //// Understandably getting to 1232.49/1237.29 is subject to price confirmation with a new high above 1201.60…. Expect the unexpected I guess! lol
I agree with you. I have the same mind set. But lets see if gold can confirm moving above 1202 today that will be some credence to this wave otherwise it will linger longer another day.
Gold has done unexpected thing always and it may be because of EW.
Papudi
Friday 8:30 am US GDP data released. If it is bullish gold, it could make a big difference.
U.S. GDP data due Friday will give the market clues on the strength of the U.S. economy — and should drive gold until next Wednesday, said Chintan Karnani, chief market analyst at Insignia Consultants.
FRIDAY, MAY 29
8:30 am GDP revision 1Q -1.0% 0.2%
9:45 am Chicago PMI May — 52.3
10 am Consumer sentiment index May —
88.6
good call Syed.
Bit of a smack down Gold got at 1192 this am
Hi Patrick: That’s right Gold price got smacked at 1192 and needs to rise through 1190-92 all over again…. This is behaving more like a Frisbee lol…. Lets see if it can fetch past 1199-1200…
We are having technical difficulties with uploading charts to comments. ATM we don’t have a solution, but we will keep working on it and will have one shortly.
For now if you wish to share charts please upload to a drop box or similar and post a link in comments.
We apologise for the inconvenience.
Is there anything that can be done to “fix” or address the privacy concerns that you have with Disqus? With Disqus, we can all post under aliases if desired, so not sure why posters would be concerned.
I’d be willing to bet that most users find the functionality of Disquis so much better. The experience of posting and reading comments is not nearly as good with WordPress.
Lara,
i also have no livestream. The commets appear greatly delayed.
i have to reload the page and then after some hours i get it.
Will this all be reworked as it was, the nickname opportunity also?
thx
I know, wordpress is not a good solution.
The problem with Disquis is ALL comments are public. Members have zero privacy.
If you go to the EWG Disquis profile you can see all of the discussions there.
There is an expectation that this space is part of the membership, that it’s private. Because you’re all paying for it. And sometimes I upload charts into it. That’s all public too under Disquis.
We’ve contacted Disquis to ask about the privacy issue, but because it’s not a paid for service because its free I think that won’t change, it’s part of their functionality to create their community. If we make our conversations private in Disquis then we’re not contributing to the community which is what they want.
We’re looking for plugins and paid for platforms to do what we need.
Lara, thanks for all your tremendous efforts to produce this great analysis and video.
You’re welcome Richard!