Upwards movement was expected for both the bull and main bear Elliott wave counts.
Summary: Both bull and bear wave counts still expect upwards movement to continue for a few days. The bull wave count has a minimum requirement at 1,232.49 and a maximum at 1,242.91. Upwards movement for the bull count may now need to last longer than a Fibonacci five days total for minute wave v. The bear count requires upwards movement to a minimum at 1,233.82 and its maximum is the upper maroon trend line on the daily chart. It may last a further five days. I favour the bull wave count. A short term target for upwards movement for both bull and main bear wave counts is now at 1,218. If there is a new low below 1,180.36, the bear alternate may be correct because it expects a strong third wave down.
Weekly charts are updated today.
Changes to last analysis are italicised.
Weekly Bull Wave Count
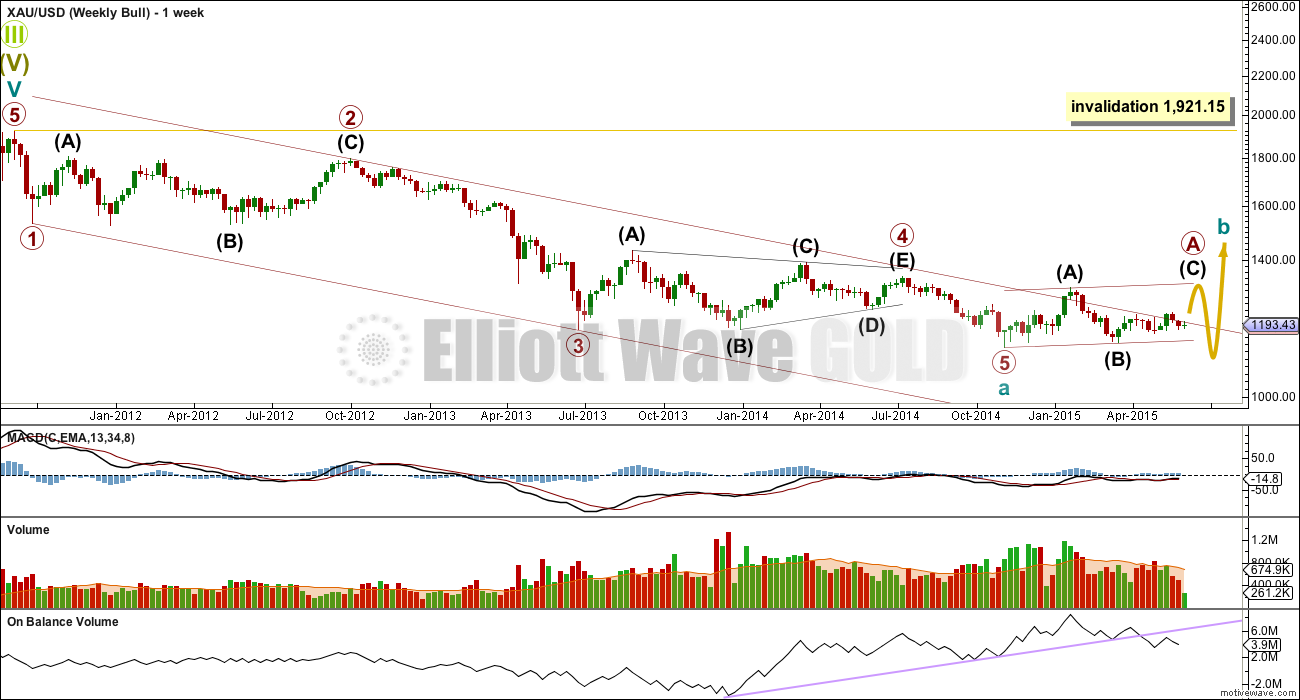
Cycle wave a may be a complete five wave impulse. Within it, primary wave 2 is a deep 0.68 running flat (the subdivisions fit and intermediate wave (C) is only slightly truncated) lasting 53 weeks, and primary wave 4 is a shallow 0.27 regular contracting triangle lasting 54 weeks. There is perfect alternation and almost perfect proportion between primary waves 2 and 4.
Primary wave 3 is 12.54 short of 1.618 the length of primary wave 1. There is no adequate Fibonacci ratio between primary wave 5 and either of 1 or 3.
Because cycle wave a subdivides as a five wave structure cycle wave b may not move beyond its start above 1,921.15.
Cycle wave b may be any one of more than 13 possible corrective structures. It should last one to several years, move price either sideways or higher, and clearly break out of the channel about cycle wave a, which would provide full confidence in a cycle degree trend change.
At this stage within cycle wave b it is possible to narrow down the options for primary wave A. A waves may subdivide as either threes or fives; the only structures they may not be are triangles. This one has the first move up labelled intermediate wave (A) as a leading expanding diagonal. I cannot see a solution where this move can subdivide as a three (with the sole exception of a very rare triple zigzag which does not have the right look) so I am 99.9% confident this movement is a five. That means primary wave A may only be a zigzag or an impulse. It also means that if intermediate wave (B) to continue sideways it may not move beyond the start of intermediate wave (A) below 1,131.09. That is why 1,131.09 is the final price point for confirmation of any bear wave count.
Draw the channel from the lows labelled primary waves 1 to 3, then place a parallel copy on the high labelled primary wave 2. There is a small breach of the channel within cycle wave b, which is the first indication that cycle wave a may be over.
Primary wave 5 does not subdivide perfectly as an impulse on the daily chart and for this reason I retain the weekly bear wave count.
On Balance Volume has breached the long held trend line which began in December 2013. At the weekly chart level this is bearish.
Daily Bull Wave Count
The bull wave count sees primary wave 5 and so cycle wave a a complete five wave impulse on the weekly chart.
Pros:
1. The size of the upwards move labelled here intermediate wave (A) looks right for a new bull trend at the weekly chart level.
2. The downwards wave labelled intermediate wave (B) looks best as a three.
3. The small breach of the channel about cycle wave a on the weekly chart would be the first indication that cycle wave a is over and cycle wave b has begun.
Cons:
1. Within intermediate wave (3) of primary wave 5 (now off to the left of this chart), to see this as a five wave impulse requires either gross disproportion and lack of alternation between minor waves 2 and 4 or a very rare running flat which does not subdivide well. I have tried to see a solution for this movement, and no matter what variation I try it always has a major problem.
2. Intermediate wave (5) of primary wave 5 (now off to the left of the chart) has a count of seven which means either minor wave 3 or 5 looks like a three on the daily chart.
3. Expanding leading diagonals (of which intermediate wave (A) or (1) is) are are not very common (the contracting variety is more common).
4. The possible leading diagonal for minor wave 1 and particularly minute wave ii within it look too large.
For volume to clearly support the bull wave count it needs to show an increase beyond 187.34 (30th April) and preferably beyond 230.3 (9th April). Only then would volume more clearly indicate a bullish breakout is more likely than a bearish breakout.
Within cycle wave b, primary wave A may be either a three or a five wave structure. So far within cycle wave b there is a 5-3 and an incomplete 5 up. This may be intermediate waves (A)-(B)-(C) for a zigzag for primary wave A, or may also be intermediate waves (1)-(2)-(3) for an impulse for primary wave A. At 1,320 intermediate wave (C) would reach equality in length with intermediate wave (A) and primary wave A would most likely be a zigzag. At 1,429 intermediate wave (3) would reach 1.618 the length of intermediate wave (1) and primary wave A would most likely be an incomplete impulse.
Intermediate wave (A) subdivides only as a five. I cannot see a solution where this movement subdivides as a three and meets all Elliott wave rules (with the sole exception of a very rare triple zigzag which does not look right). This means that intermediate wave (B) may not move beyond the start of intermediate wave (A) below 1,131.09. That is why 1,131.09 is final confirmation for the bear wave count at the daily and weekly chart level.
Intermediate wave (C) is likely to subdivide as an impulse to exhibit structural alternation with the leading diagonal of intermediate wave (A). This intermediate wave up may be intermediate wave (3) which may only subdivide as an impulse.
It is possible that the intermediate degree movement up for the bull wave count is beginning with a leading diagonal in a first wave position for minor wave 1.
A leading diagonal must have second and fourth waves which subdivide as zigzags. The first, third and fifth waves are most commonly zigzags, but sometimes they may be impulses. The fourth wave must overlap first wave price territory.
Within diagonals, the most common depth of the second and fourth waves is between 0.66 and 0.81. Minute wave ii is 0.67 of minute wave i. So far minute wave iv is 0.83 of minute wave iii, a little deeper than normal range.
Minute wave iv is now over. Within minute wave v no second wave correction nor B wave may move beyond its start below 1,180.36.
The diagonal of minor wave 1 is contracting so minute wave v may not be longer than equality in length with minute wave iii. The maximum for minute wave v is equality with minute wave iii at 1,242.91.
Second wave corrections following leading diagonals in first wave positions are commonly very deep. When this leading diagonal structure for minor wave 1 is complete, then minor wave 2 should unfold lower, may be expected to reach at least the 0.618 Fibonacci ratio of minor wave 1 or may be quite a bit deeper than that, and may not move beyond the start of minor wave 1 below 1,142.82.
Main Hourly Bull Wave Count
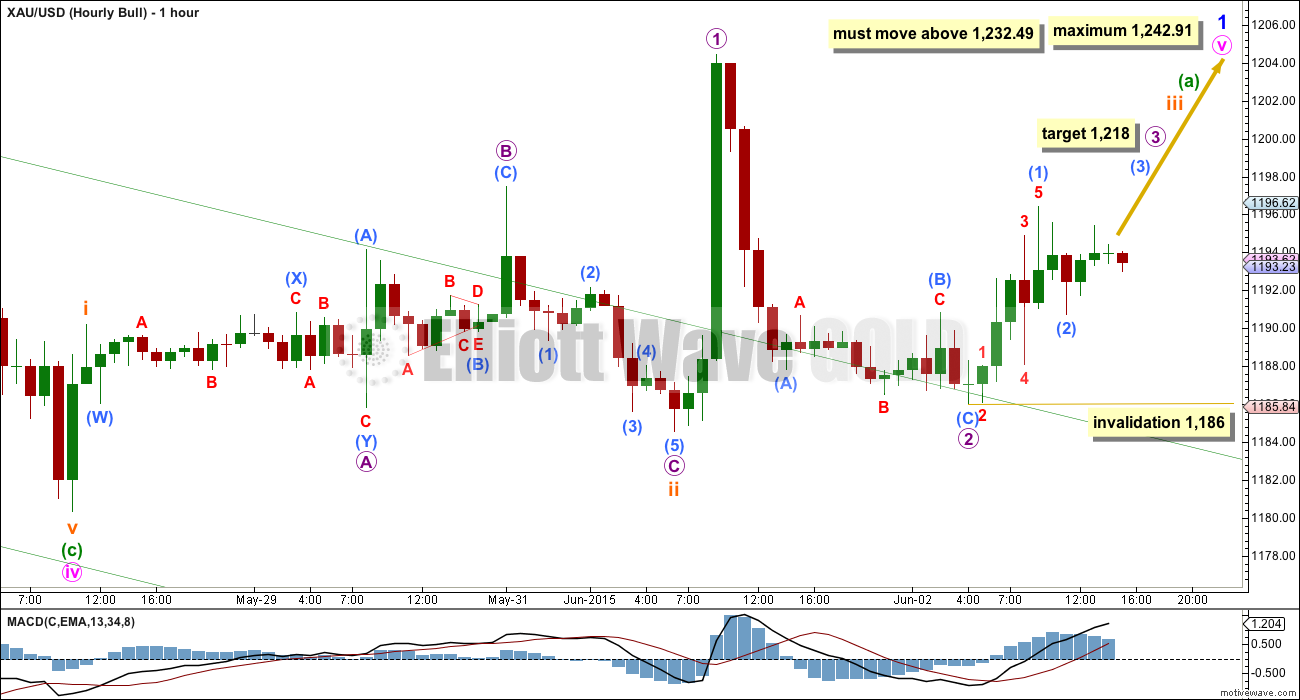
As yesterday, the bull and main bear wave counts are essentially the same at the hourly chart level.
This wave count expects minute wave v to be a zigzag, which is the most likely structure, but it may be an impulse.
Minuette wave (a) must subdivide as a five wave structure, either an impulse or a leading diagonal. An impulse is more likely. A leading diagonal is also possible, and if we see a new low below 1,184.58 within the next 24 hours that is the idea I would use. It is published below.
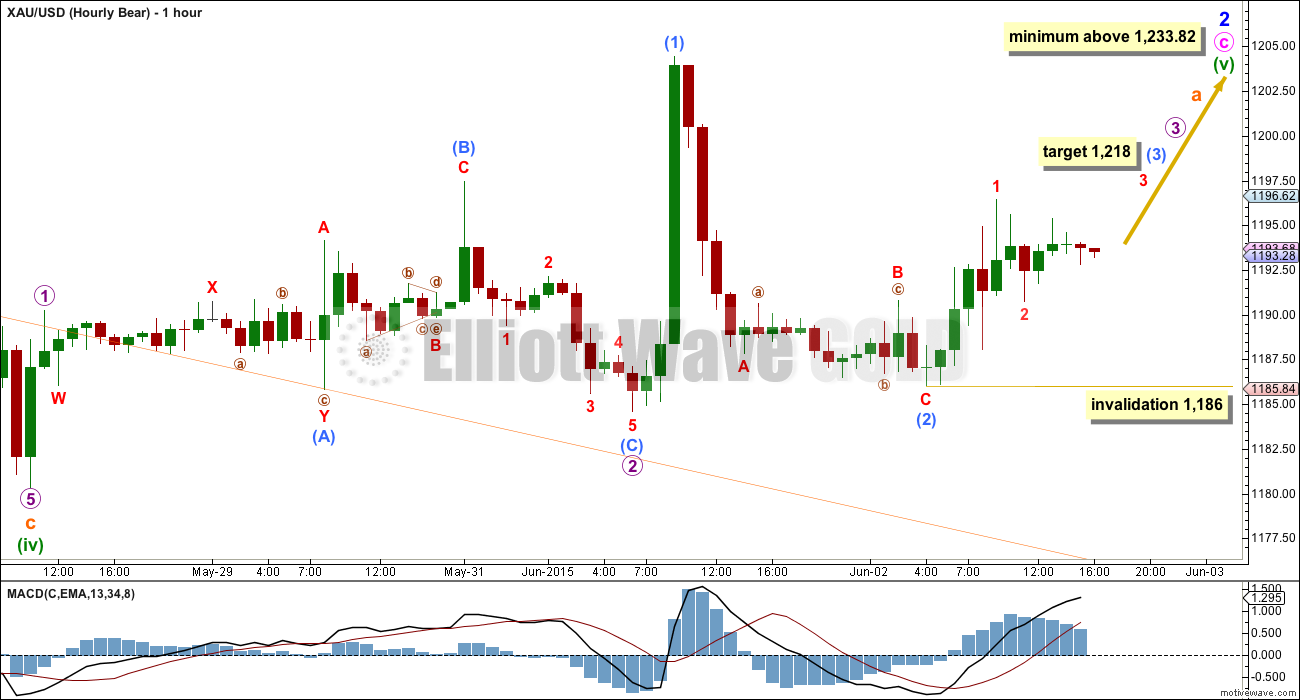
On the five minute chart, the upwards wave labelled submicro wave (1) fits perfectly as a five wave impulse. Submicro wave (2) fits as a completed zigzag, but may yet move lower as a double zigzag. Submicro wave (2) may not move beyond the start of submicro wave (1) below 1,186.
At 1,218 micro wave 3 would reach 1.618 the length of micro wave 1.
The next wave up must show a strong increase in upwards momentum. It should do that in the next 24 hours if this wave count is correct.
Leading diagonals may not have truncated fifth waves. Minute wave v must move above 1,232.49.
Alternate Hourly Bull Wave Count
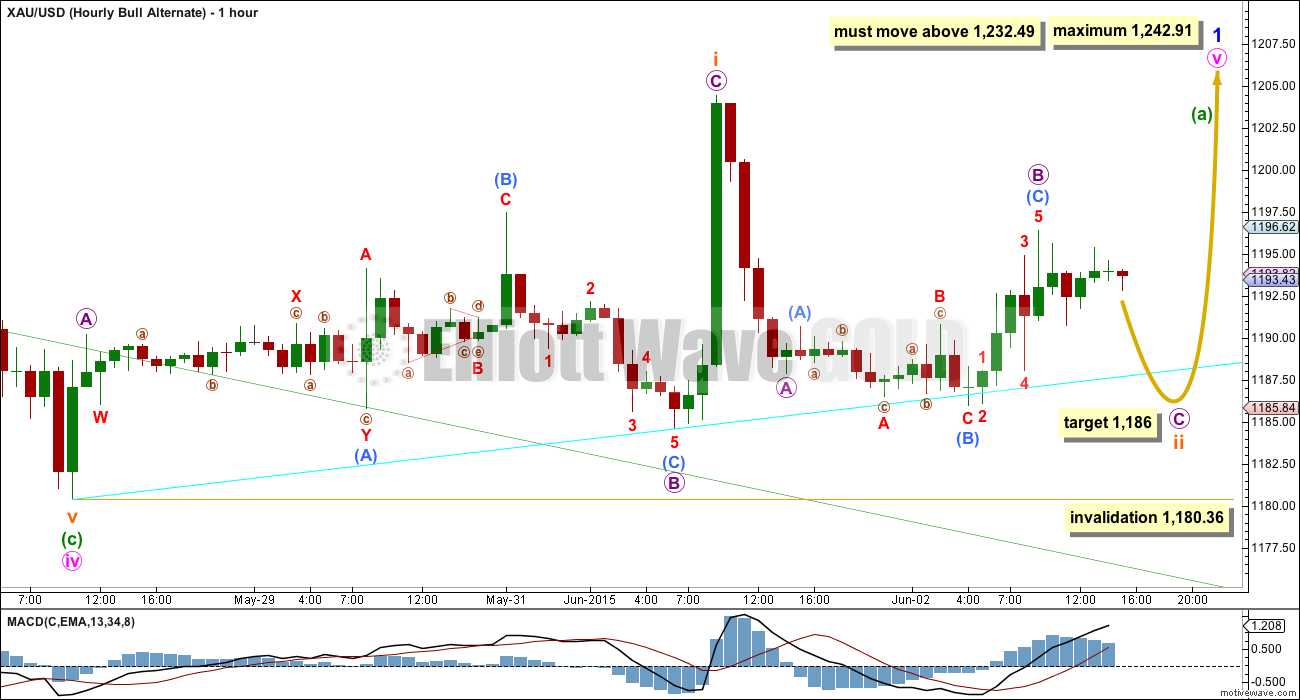
The other structural possibility for minuette wave (a) is a leading diagonal. The contracting variety is more common, so subminuette wave iii would be likely to be shorter than subminuette wave i which was 24.08 in length. Subminuette wave iii must move beyond the end of subminuette wave i above 1,204.44.
A leading diagonal has sub waves 2 and 4 which must subdivide as zigzags, and sub waves 1, 3 and 5 which are most commonly zigzags but may sometimes be impulses. Waves 2 and 4 have a common depth of between 0.66 to 0.81 the prior actionary wave.
Subminuette wave ii may move lower. At 1,186 micro wave C would reach 0.618 the length of micro wave A. This would see subminuette wave ii a 0.77 correction of subminuette wave i, right within normal range. It may not move beyond the start of subminuette wave i below 1,180.36.
This idea has a lower probability than the impulse idea for minuette wave (a). I publish it today to consider all possibilities, and to illustrate why the invalidation point on the daily chart for the main bull wave count is at 1,180.36. This idea also works for the bear wave count at the hourly chart level.
Weekly Bear Wave Count
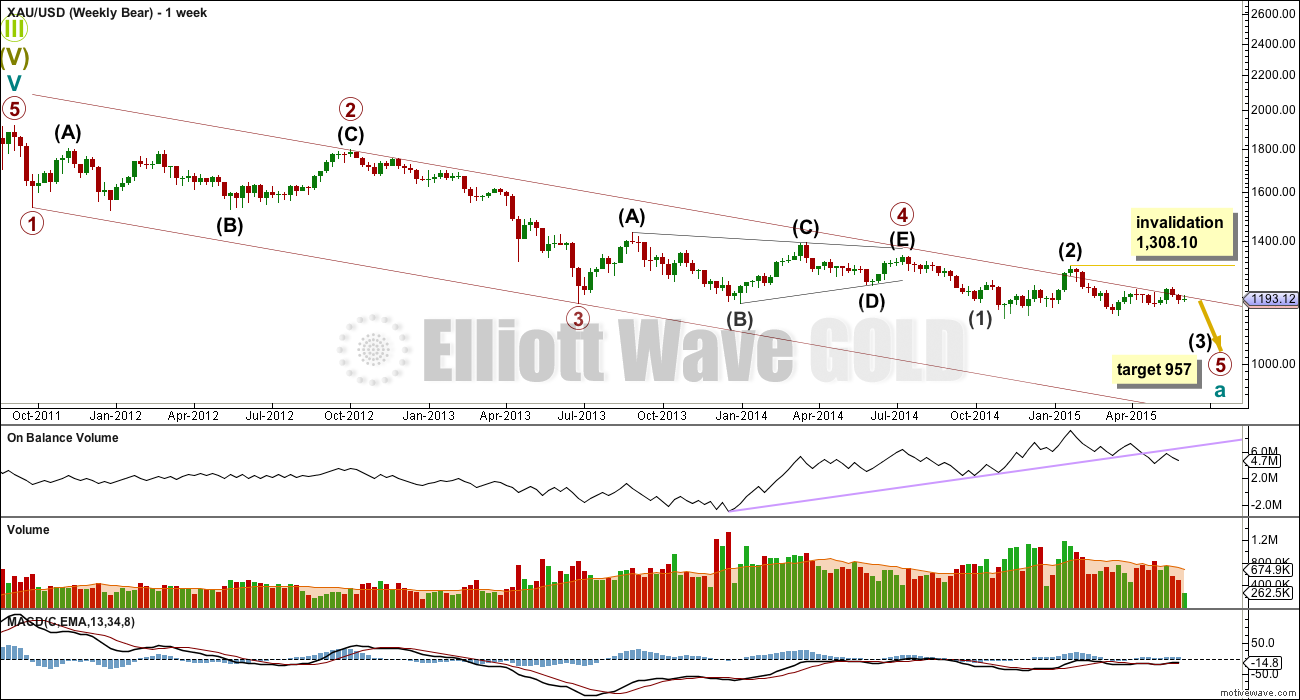
This weekly chart is identical to the first bullish weekly chart up to the end of primary wave 4. Thereafter, it looks at the possibility that primary wave 5 is incomplete. At 957 primary wave 5 would reach equality in length with primary wave 1. That would give this impulse for cycle wave a perfect Elliott wave ratios.
So far within primary wave 5, only intermediate waves (1) and (2) would be complete. Intermediate wave (2) has a small breach of the upper edge of the channel containing cycle wave a. If cycle wave a is incomplete this channel should not be breached. This is the first warning this wave count may be wrong.
Within primary wave 5, intermediate wave (1) subdivides perfectly as an impulse. Intermediate wave (2) subdivides perfectly as a very common expanded flat. Intermediate wave (2) looks too large though, further reducing the probability of this wave count.
If the maroon channel is breached again this wave count should be discarded, before price moves above 1,308.10.
The breach of the trend line on On Balance Volume is a bearish indicator and supports a bear wave count. Since the end of intermediate wave (2), strongest volume is within down weeks which is also a bearish indicator. While price is range bound, both bull and bear wave counts must be considered (both have points for and against). I am not going to try to pick a winner; I will use thorough analysis that identifies which price points will tell us which scenario is correct.
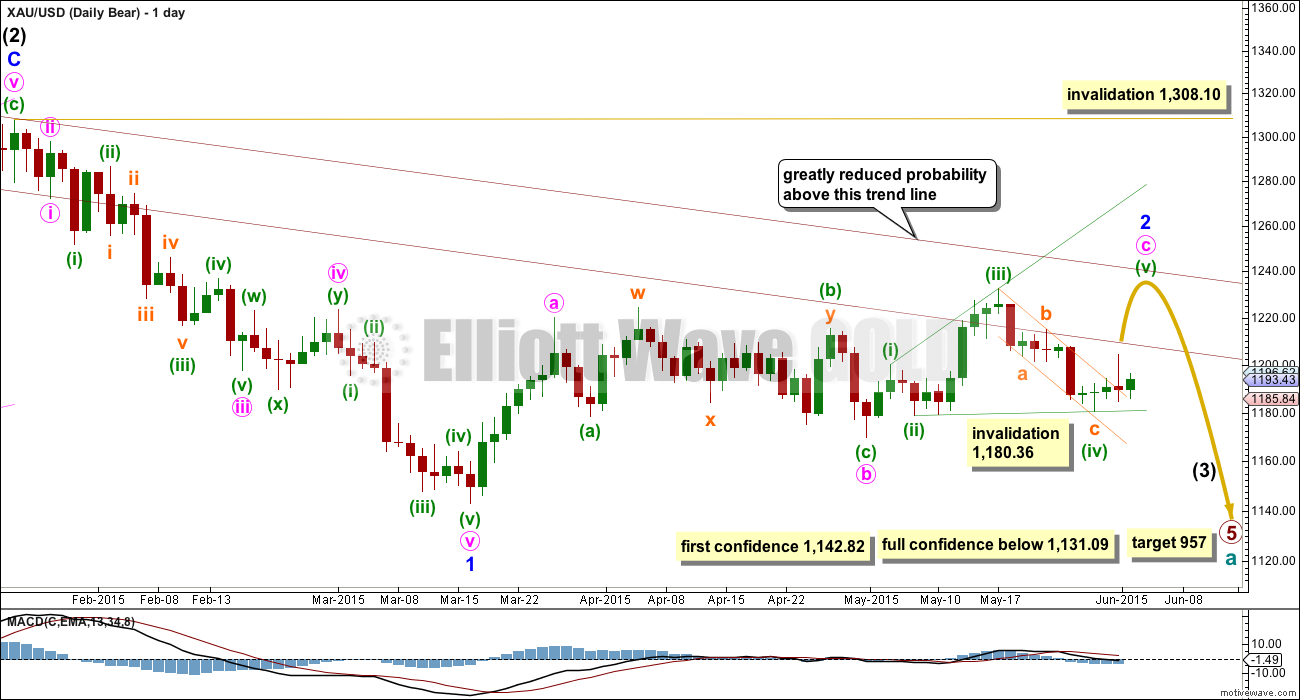
Main Daily Bear Wave Count
This wave count follows the bear weekly count which sees primary wave 5 within cycle wave a as incomplete. At 957 primary wave 5 would reach equality in length with primary wave 1.
Pros:
1. Intermediate wave (1) (to the left of this chart) subdivides perfectly as a five wave impulse with good Fibonacci ratios in price and time. There is perfect alternation and proportion between minor waves 2 and 4. For this piece of movement, the bear wave count has a much better fit than the bull wave count.
2. Intermediate wave (2) is a very common expanded flat correction. This sees minor wave C an ending expanding diagonal which is more common than a leading expanding diagonal.
3. Minor wave B within the expanded flat subdivides perfectly as a zigzag.
Cons:
1. Intermediate wave (2) looks too big on the weekly chart.
2. Intermediate wave (2) has breached the channel from the weekly chart which contains cycle wave a.
3. Minor wave 2 is much longer in duration than a minor degree correction within an intermediate impulse normally is for Gold. Normally a minor degree second wave within a third wave should last only about 20 days maximum. This one is in its 55th day and it is incomplete. It is now starting to look ridiculous; this is becoming a serious problem for this bear wave count. The bearish alternate below mostly resolves this problem.
4. Within minor wave 1 down, there is gross disproportion between minute waves iv and ii: minute wave iv is more than 13 times the duration of minute wave i, giving this downwards wave a three wave look.
This bear wave count now needs minute wave c upwards to complete as a five wave structure. At this stage, minute wave c is an ending expanding diagonal.
Minor wave 2 may not move beyond the start of minor wave 1 above 1,308.10. However, this wave count would be substantially reduced in probability well before that price point is passed. A breach of the upper maroon trend line, a parallel copy of the upper edge of the channel copied over from the weekly chart, would see the probability of this wave count reduced so much it may no longer be published before price finally invalidates it.
When the ending diagonal structure is complete, then this bear wave count expects a strong third wave down for minor wave 3 within intermediate wave (3). At that stage, a new low below 1,142.82 would provide strong indication that the bear wave count would be more likely than the bull wave count. Only a new low below 1,131.09 would provide full confidence.
Main Hourly Bear Wave Count
This hourly bear wave count is essentially the same as the hourly bull wave count.
Minute wave c is an ending expanding diagonal. Minuette wave (v) must be longer than equality in length with minuette wave (iii). It must move above 1,233.82.
The alternate hourly bull wave count also works the same way for this bear wave count. Subminuette wave a may be a leading diagonal. I’ll not publish a chart for it in order to keep the number of charts as reasonable as I can.
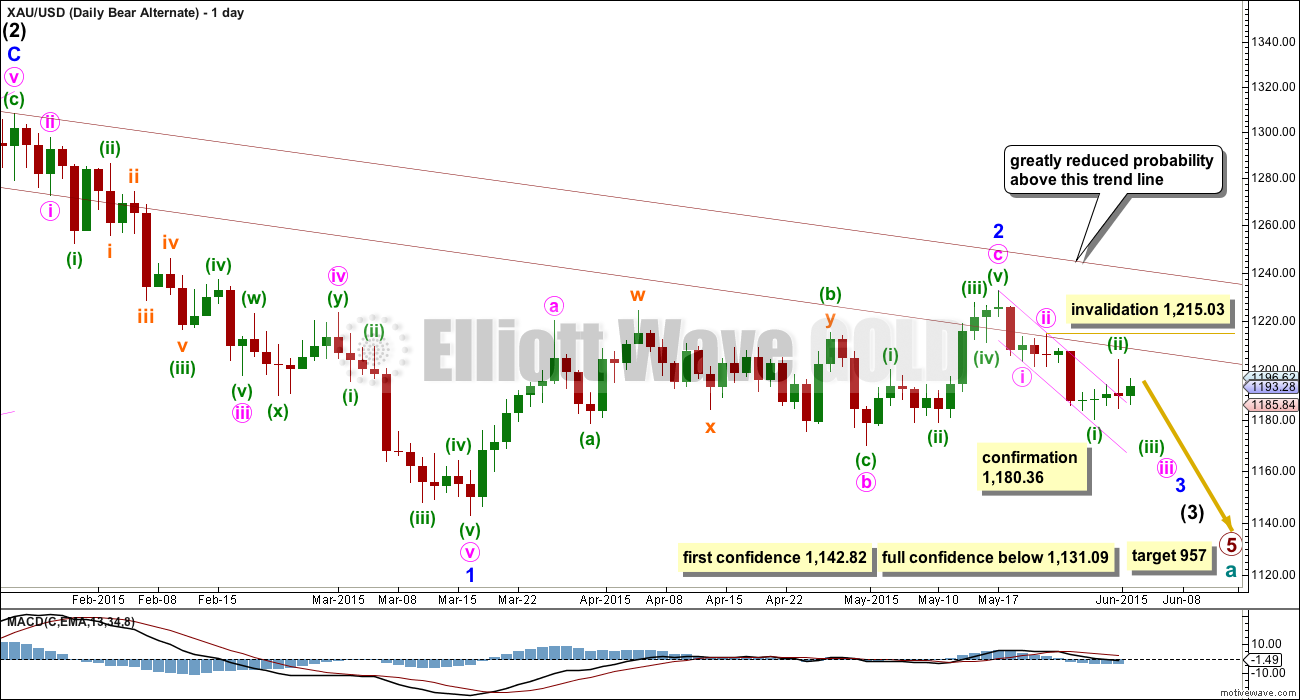
Alternate Daily Bear Wave Count
I will continue to publish this alternate bear wave count because it resolves much of the problem of minor wave 2 being too long in duration for the main bear wave count.
Here minor wave 2 is a completed zigzag which lasted 44 days, just over twice the normal duration for a minor degree correction within an intermediate degree impulse for Gold. If minor wave 3 has begun, then it may now have two overlapping first and second wave corrections.
A problem which further reduces the probability of this wave count is minuette wave (ii) has breached a base channel drawn about minute waves i and ii. Price should have found resistance at the upper edge of this small pink channel. A green candlestick mostly above this channel further reduces the probability of this wave count today.
This alternate bear wave count has a very important implication. If it is correct, then a very strong third wave down may have just begun. It requires confirmation. A new low initially below 1,180.36 would provide enough confirmation for this wave count to be taken seriously. If that happens, then this wave count would expect an imminent strong increase in downwards momentum.
For confidence in the target at 957 a new low below 1,142.82 and finally 1,131.09 is required.
Technical Analysis
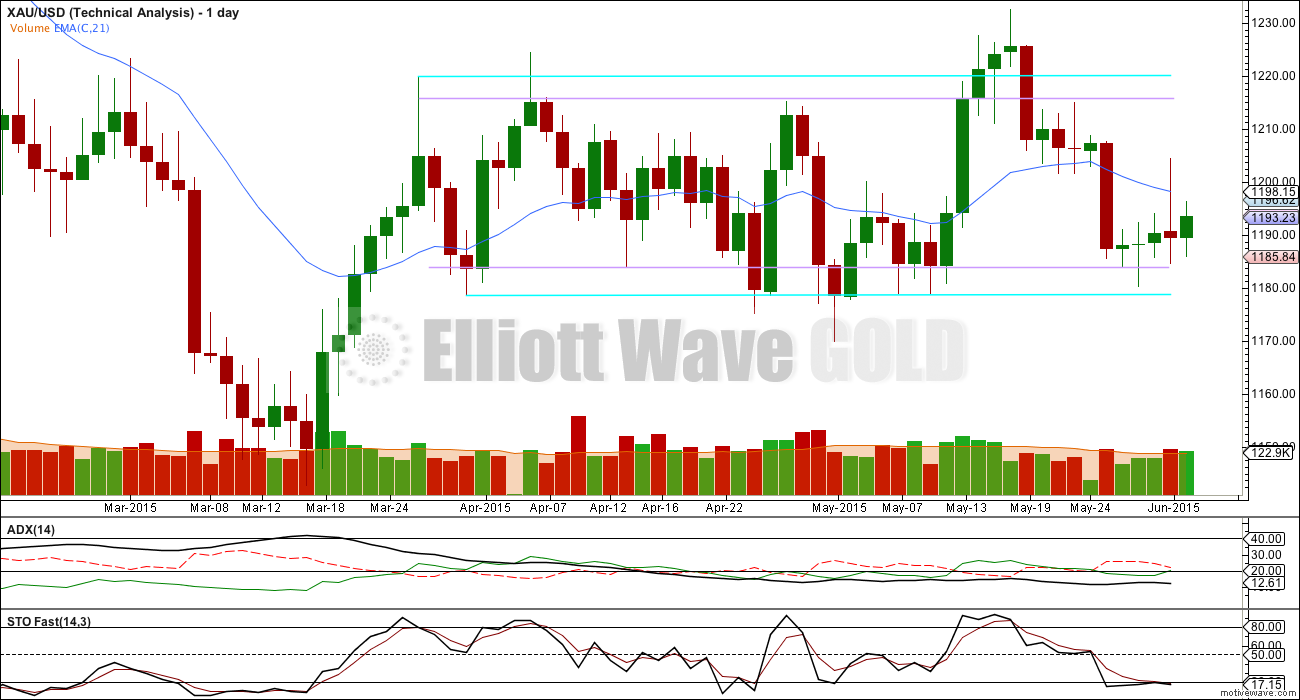
ADX is still below 15 and flat. Gold remains range bound. No clear trend is yet evident and so a range bound trading system should be used as opposed to a trend following system.
This range bound system I am outlining here uses Stochastics to indicate where each swing begins and ends. Stochastics is returning from oversold currently, and so a swing higher until Stochastics is again overbought would now be expected.
The horizontal trend lines delineate the upper and lower levels of support and resistance. The aqua blue trend lines are close to the extreme edges, the inner lilac lines are 0.5% of market value within the outer lines. These horizontal lines continue to show mostly where price is finding support and resistance.
While ADX remains below 15 this system should continue to be used. The +DX and -DX lines are not used, nor is the EMA, for this system. Only Stochastics and the trend lines are used in conjunction with the ADX line.
This analysis is published about 05:15 p.m. EST.


I’m changing the alt bear count. This wave down (from the last high at 1,232 to today’s low) will subdivide as either a three or a five. For the bear count (of which there is now only one) I’m going to see this as another complete first wave down. Which means it expects some upwards movement from here for a second wave correction. This resolves the problem of the base channel being breached. The subdivisions fit. Now all three wave counts expect upwards movement next. But it also means that the price point which now differentiates bull and bear wave counts is higher at 1,232.49.
I will have a new alternate bull wave count today. Both bull wave counts require upwards movement from here, but the new alternate sees a minor degree second wave over today. There is more room for it to move into though, if the second wave moves lower it’s invalidation point is at 1,142.82. This idea now expects a third wave up to 1,304. Leaving comments now to finish charts and write this up.
Looks good for 2 ending at today LOD
All we need now is a nice spike to launch 3 🙂
You are bullish and the 113.08 is the GLD low of the day was C of 2.
Gold Down, Hits 4-Week Low; Gets No Support from Sell-Off in USDX -By Jim Wyckoff -Wednesday June 03, 2015 13:59
http://www.kitco.com/news/2015-06-03/Gold-Down-Hits-4-Week-Low-Gets-No-Support-from-Sell-Off-in-USDX.html
Lara, what about this idea?
Patrick 47 mins agoReply
I think today low at 113.08 is C of 2 now up
0
Ben 44 mins ago
That’s what I am watching too.
0
Matthias 30 mins ago
I’m not following you. Are you saying that gold is bouncing up in another 2nd wave?
-1
Ben 5 mins ago
Up from here.
0
Ben 4 mins ago
C and 2 done, and now up.
Sorry Patrick, I’m not following the idea at all. 113.08? Golds low today is 1,179.60 so that makes no sense. I really would need a chart of the idea to understand the question. It would have to be uploaded to some kind of file sharing site so a link here can be posted.
the 113.08 is the GLD low of the day
Thanks Lara for your fabulous and timely intra-day updates!
Hoping Laura can post her projected analysis here before NYSE close as she has done last few sessions as this is key point in gold market.
working on it
The bear wave count now has only the alternate valid. It must see continued downwards movement from here, and it now needs confirmation below 1,142.82. It should be taken seriously now, but it still needs more confirmation before I’m going to be comfortable with a huge call like that. In the interim if we see a new low below 1,178.08 the bull wave count would be in very serious jeopardy. I will be looking for an alternate variation for the bull wave count which could see that happening, I can’t see one yet.
Thanks
The bull wave count is still valid if minute wave iv has just ended. The diagonal must be contracting because minute wave iii is shorter than minute wave i. So minute wave iv must be shorter than minute wave ii. It would reach it’s limit at equality with minute ii at 1,178.08. Today’s low is just slightly above this point. For the bull wave count minute wave v MUST begin upwards from here. The maximum for it would now be 1,242.15.
Lara in her video at 17:20 – 17:30 said about Daily Bear Alternate. This wave count absolutely requires confirmation. If we get a new low below 1180.36 and for this idea that should happen now in the next 24 hours. If that happens take this wave count very seriously indeed. The implications are huge. It could see an extremely strong downwards breakout from this sideways chop we’ve been in since the 27th of March.
I wouldn’t get to excited about the downside with the lower band at 1173-72 though a drop through to 1164 is possible (maybe the previous invalidation 1178 applies now?) and I would like to first see if Gold price can rise back up above 1190….
Just A View: Gold price failure now to rise above 1189, 1191, 1193 will likely keep it in a failed state…. Initial upward movement was seen towards 1195-96 to drop back and break below 1190 which probably set the tone and Gold price failure to bounce back above 1193 from a drop to 1186 probably signaled for this drop below 1180 to occur…. I wonder where Gold price goes from here, probably a break below 1179 for further downside to occur….
I sold all my GDX at 19.386 at 1:03 pm today for a slight loss as only had a small amount due to these trend less, uncertain, difficult to chart and trade times. With 5 out of 6 charts invalidated today I’ll wait for Lara’s analysis and video before getting back in.
Is the alternate bear really correct with this kind of a bounce and smaller 3rd wave?
I think today low at 113.08 is C of 2
now up
That’s what I am watching too.
I’m not following you. Are you saying that gold is bouncing up in another 2nd wave?
Up from here.
C and 2 done, and now up.
Lara tonight will issue a new daily bull, hourly bull, daily bear, hourly bear because they were all invalidated below either 1186 or 1180.36.
Daily Bear alternate is only chart still valid and it has been confirmed below 1180.36. It may become the preferred chart?
This Alternate Bear wave count has a very important implication. If it is correct, then a very strong third wave down may have just begun. It requires confirmation. A new low initially below 1,180.36 would provide enough confirmation for this wave count to be taken seriously. If that happens, then this wave count would expect an imminent strong increase in downwards momentum.
For confidence in the target at 957 a new low below 1,142.82 and finally 1,131.09 is required.
Rick Ackerman has 2 hidden pivots, one around 1183 and the other around 1176
Do we have any E.W. counters here? Because bear alternate will have to do 4th wave correction somewhere. I had asked Lara for an hourly chart on this some time back but it wasn’t given any weight. Now we could use it.
I’m wondering though, if the 1180.36 invalidation might just mean primary charts get a less-sloping diagonal (revision) and then back in-play. I have such a small position in GG right now I am waiting just a bit. 3-4-3-4-3-4
No fourth wave correction yet, it’s in the middle of a third wave which is incomplete. The alternate bear will most definitely now have an hourly chart and will be taken seriously. But it still needs more confirmation before I’m going to be comfortable with it’s implications. Look at the TA chart. Price has again touched that lower line of support which goes back to 31st March. While that line holds both scenarios, bull and bear, must be considered.
As much of a bear as I am, something is still off here. Gold has been taking it’s time moving down.
I agree. I’m approaching this mess with caution indeed. Even the traditional TA approach of buying support and selling resistance would have had a loss today (unless a position had been entered a three days ago and the stop had been moved up to eliminate risk). That’s the problem with range bound markets. They’re really risky.
I’m holding long here for a bit. Miners are hanging in there.
Only chart still valid is Daily Bear Alternate all other charts are invalidated as gold just crashed below 1180.36 at 12:46 pm down to 1179.61.
Gold has decided to become a Bear and head south. I’m selling all bullish on the next little bounce in a few minutes as a new daily bear will be needed and Daily Bear alternate is the preferred chart and that heads South.
Are all counts invalid other than Alternate Daily Bear Wave Count, Where is Tham when you need him?
Yes all invalid except Daily Bear Allternate just read them Lara can make a new daily bear as well
Hi Richard, I guess what I’m really asking is if at the end of the day Lara is going to have a revised bullish count, or is that highly improbable. Thanks
That’s exactly what I’m doing. Price is still within that range it entered on 27th March. There’s no breakout yet. Both bull and bear scenarios must be considered. See my comment above re bull wave count.
there we goooo
3 down
3rd wave down???
I just bought some more GDX at 19.556 at 11:48 am the day low.
Hourly Bull Alternate chart seems to be in play and gold dropped down to the aqua blue trend line on that chart at 1189-1190 area as bounced up as it hit 1189.38 at 11:42 am the low since the open and also almost exactly at the .618 of 1189.00, of the difference between today’s high of 1192.66 at 9:32 and today’s low of 1186.73 at 8:31 am.
US dollar dropping today and looking for gold to turn back up as seems to also have hit some lower trend lines at several time frames on http://www.pmbull.com
I believe the minor downward movement over the last few minutes is nothing more than a smaller C wave completing. Today’s low should hold.
I apologize for the error. 1180 is the crucial point.
another deep second wave correction, hurry up and end now!
Who’s job was it to light the fuse?
I think it was Mark
I saw him pouring water on it early this morning.
Looks like an inside candle day once again. Unless there is some kind of earth shattering event today, gold should remain quiet and range bound. All of the significant reports are done for the day. I guess everything is leading up to that Friday jobs report at 8:30 am EST.
….That said, I do expect tomorrow to be an up day (green candlestick).
Hourly Bull Alternat has target of 1186 and gold dropped today’s low of 1186.73 at 8:31 am EST.
There is some US news at 10 am ISM non-manufacturing, now sure how important that is. Anyways There is an invalidation point of 1186 for the Hourly Bull to watch for.
could be, i would really like to see gold pop back above 1195 to show some sign of strength
Gold is already down to 1187. Looks like a good chance the alternate hourly bull/bear is in play. Will be confirmed if we go below 1186 and then stay above 1180.36.
If 1186 is held for both Bull/bear than 3rd of 3rd of 3rd should begin soon here.
For gold times up show the card one way or the other!!!
you mean you expect a big movement up or down soon
Patrick: Lara mentions that a 2nd wave could morph into some kind of double zigzag or flat. I believe that is what happened here. She alludes to this for about 10 seconds during the video at 9:45 min into it. To answer your question, the next direction should be strongly up.