Sideways movement in a small range fits the Elliott wave count very nicely.
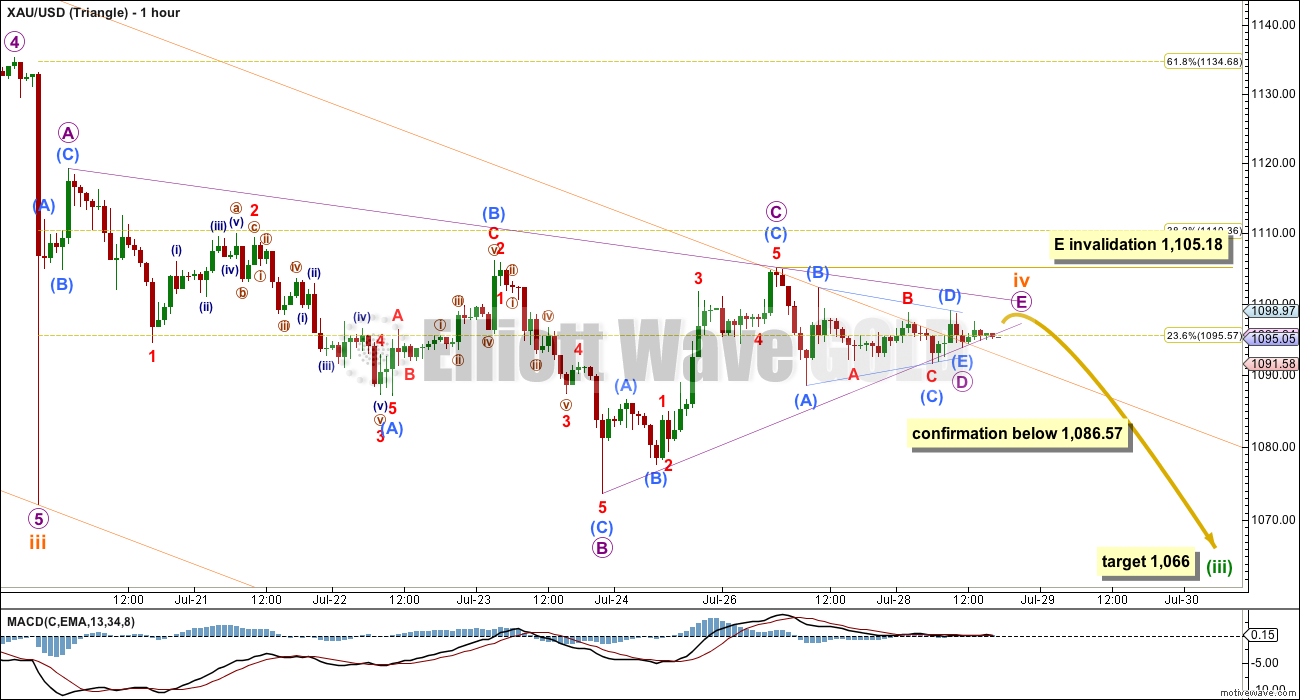
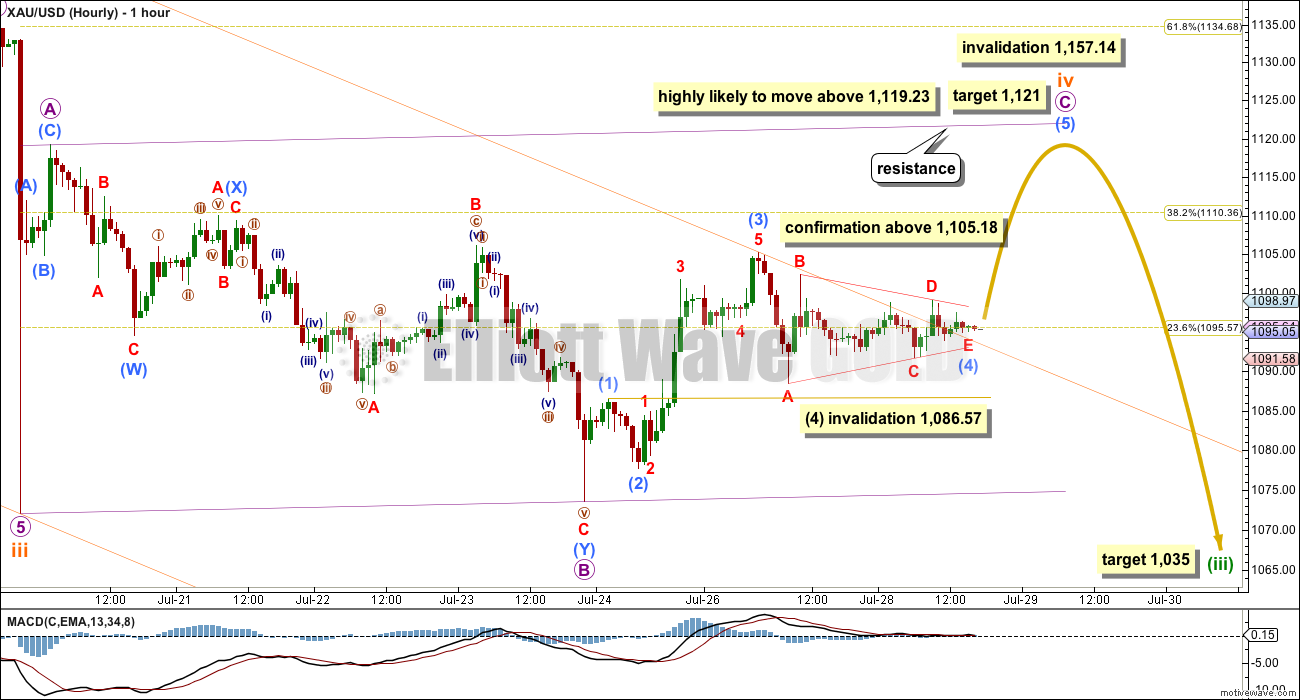
Summary: A sideways consolidation is very mature; the breakout is now very close and most likely to be downwards. A new low below 1,086.57 would confirm a downwards breakout is underway, the target for it to end would be at 1,066. A new high above 1,105.18 would confirm a short (false?) upwards breakout is underway to a short term target at 1,121, which should then be followed by a longer fifth wave down to 1,035.
To see weekly charts click here.
Changes to last analysis are bold.
MAIN ELLIOTT WAVE COUNT
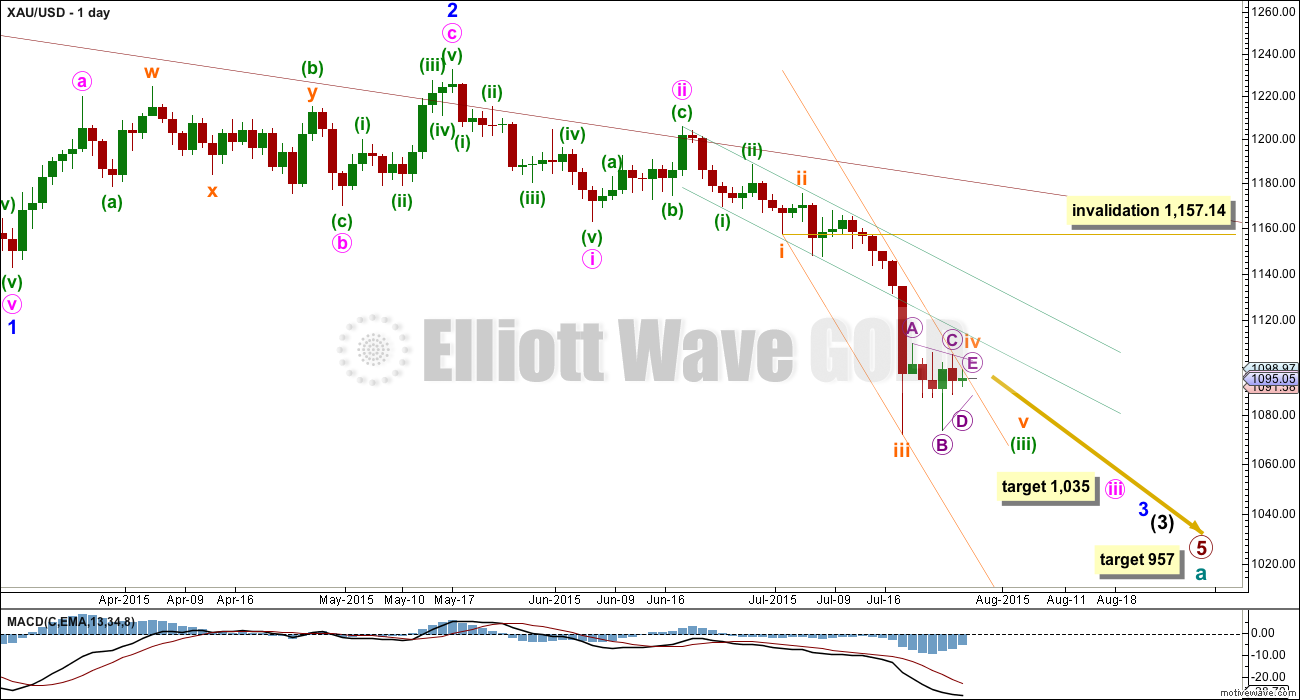
Cycle wave a is an incomplete impulse.
Within primary wave 5, the daily chart focuses on the middle of intermediate wave (3). Within intermediate wave (3), minor wave 3 now shows a slight increase in momentum beyond that seen for the end of minor wave 1 at the left of the chart. Third waves for Gold usually have clearly stronger momentum than its first waves, so I still expect to see a further increase in downwards momentum. The strongest downwards momentum may appear in a fifth wave somewhere within minor wave 3, or maybe the fifth wave to end minuette wave (iii) or minute wave iii, or that to end minor wave 3 itself.
Draw a base channel about minuette waves (i) and (ii) as shown (green trend lines). If the steeper orange channel is breached then look for the lower green trend line to provide resistance. Only if the upper green line is breached would I consider the wave count to be wrong.
Subminuette wave iii looks like it is over at the daily chart level. Subminuette wave iii has a typical curved look to it at the daily chart level and this wave count has the right look.
Subminuette wave iv may not move into subminuette wave i price territory above 1,157.14.
Draw a channel about minuette wave (iii): draw the first trend line from the ends of subminuette waves i to iii then place a parallel copy now on today’s high. Do the same on the hourly chart. The upper orange trend line is now slightly overshot at the hourly chart level. When this fourth wave is complete, then redraw the channel using Elliott’s second technique with the first trend line from the ends of the second and fourth waves and a parallel copy on the end of the third wave. This may show where the final fifth wave ends at the lower edge of that redrawn channel.
When subminuette wave iv is complete, then subminuette wave v down should unfold. It may be swift and strong, typical of Gold. At 1,035 minuette wave (iii) would reach 4.236 the length of minuette wave (i). When subminuette wave iv is complete, then I can add to this target at a second wave degree and at that point the target may change or widen to a small zone.
At 957 primary wave 5 would reach equality in length with primary wave 1.
HOURLY CHART – TRIANGLE
At this stage, it still looks like a triangle is the most likely structure for subminuette wave iv to be completing. At the daily chart level, the structure looks like a triangle (which would see a smaller overshoot of the upper edge of the orange channel) that is indicated now by MACD hovering about the zero line.
Only one of the five sub waves of a triangle may be a more complicated and time consuming wave. Sometimes this is wave D or E which unfolds itself as a triangle, which may be what is happening today. This means that wave B must be seen as a single zigzag which does not have as good a look as a double. The flat correction can see this wave down as a double zigzag, which actually has a better fit.
A new low below 1,086.57 at this stage would invalidate the flat correction idea and provide some confirmation of this triangle idea. At that stage, subminuette wave v down should be underway.
Fifth waves following triangles are often (not always) more swift and brief than expected. If subminuette wave v reaches equality in length with subminuette wave i, then it may end about 1,066. It is highly likely that submineutte wave v would move at least slightly below the end of subminuette wave iii at 1,072.09 to avoid a truncation, but it may not move too far below that point.
The final wave of the triangle for micro wave E may already be over, or it may now be over very soon indeed. It may not move beyond the end of micro wave C above 1,105.18.
HOURLY CHART – FLAT
It is still possible that subminuette wave iv is completing as a regular flat correction.
Within a flat, both waves A and B must subdivide as threes and B must retrace a minimum 90% of A. Here micro wave A is a zigzag. Micro wave B may have been a double zigzag, which has a better look than seeing this downwards movement as a single. It retraced 97% of micro wave A indicating a regular flat correction.
Regular flats have C waves which most commonly reach close to equality in length with their A waves. Micro wave C would reach equality in length with micro wave A at 1,121.
Regular flats normally fit nicely within their channels. At the target, micro wave C would come to find resistance at the upper edge of the violet channel and very likely end there.
Micro wave C must subdivide as a five wave structure, and is currently unfolding as an impulse. Within micro wave C, submicro wave (4) may be a regular contracting triangle. Submicro wave (4) may not move into submicro wave (1) price territory below 1,086.57.
A new high above 1,105.18 would invalidate the first hourly wave count and provide confirmation for this second hourly wave count.
This idea would see a reasonable overshoot of the upper edge of the orange channel. While that is entirely possible because fourth waves are not always contained within their channels, it does have a lower probability than seeing only a very small overshoot which is what the first wave count expects to see.
Within micro wave C, submicro wave (4) is now much longer in duration than submicro wave (2), 7.4 times the duration. Triangles are more time consuming structures than zigzags, so some disproportion would be expected but this is becoming extreme. When the disproportion between a second and fourth wave within an impulse is too extreme, then it causes the five wave impulse to look like a three wave movement at higher time frames; the more the disproportion causes this three wave look the less likely an impulse is unfolding.
If this second idea is confirmed, then it may look like price is breaking out of the consolidation upwards. However, this may be a false breakout before the downwards trend resumes.
At 1,035 minuette wave (iii) would reach 4.236 the length of minuette wave (i).
TECHNICAL ANALYSIS
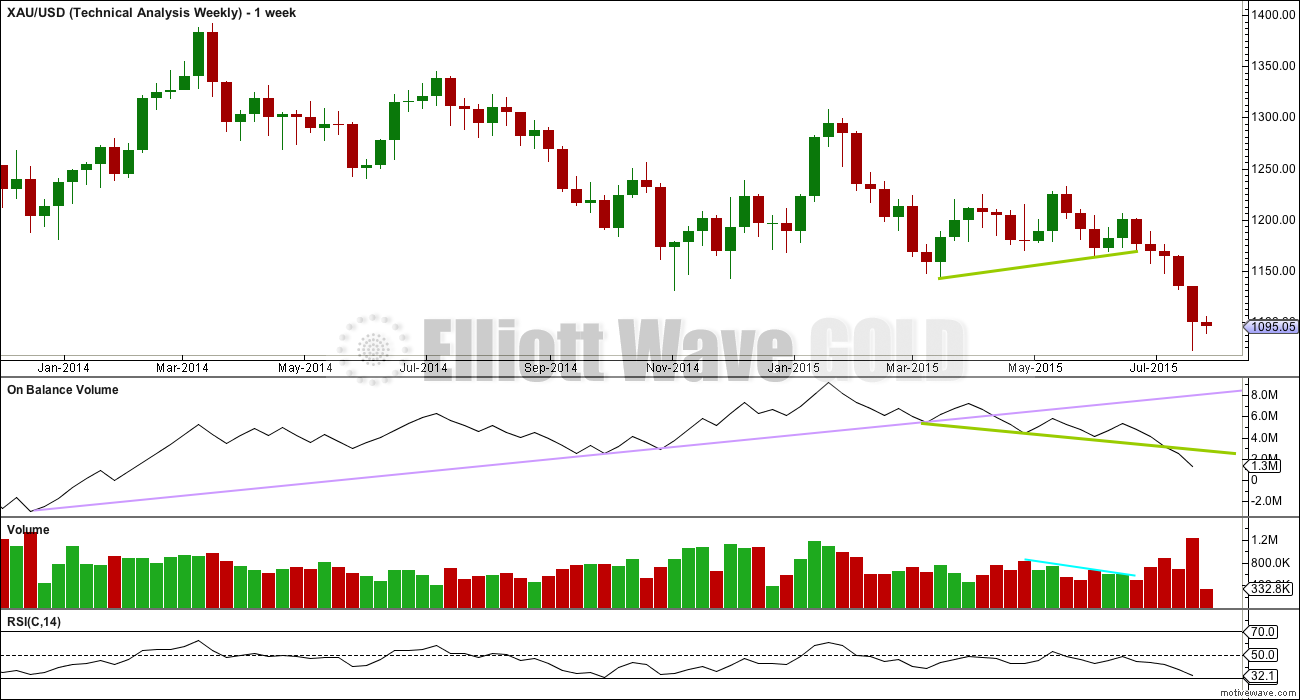
Weekly Chart: The lilac trend line on On Balance Volume has been breached, which is a longer term bearish indicator.
OBV is now breaking below the shorter green trend line, another bearish indicator.
As price falls volume is increasing and OBV is moving lower. This fall in price is supported by volume at the weekly chart level.
RSI is usually a fairly reliable indicator of lows. At the weekly chart level, RSI is still above 30 indicating there is room yet for Gold to move lower.
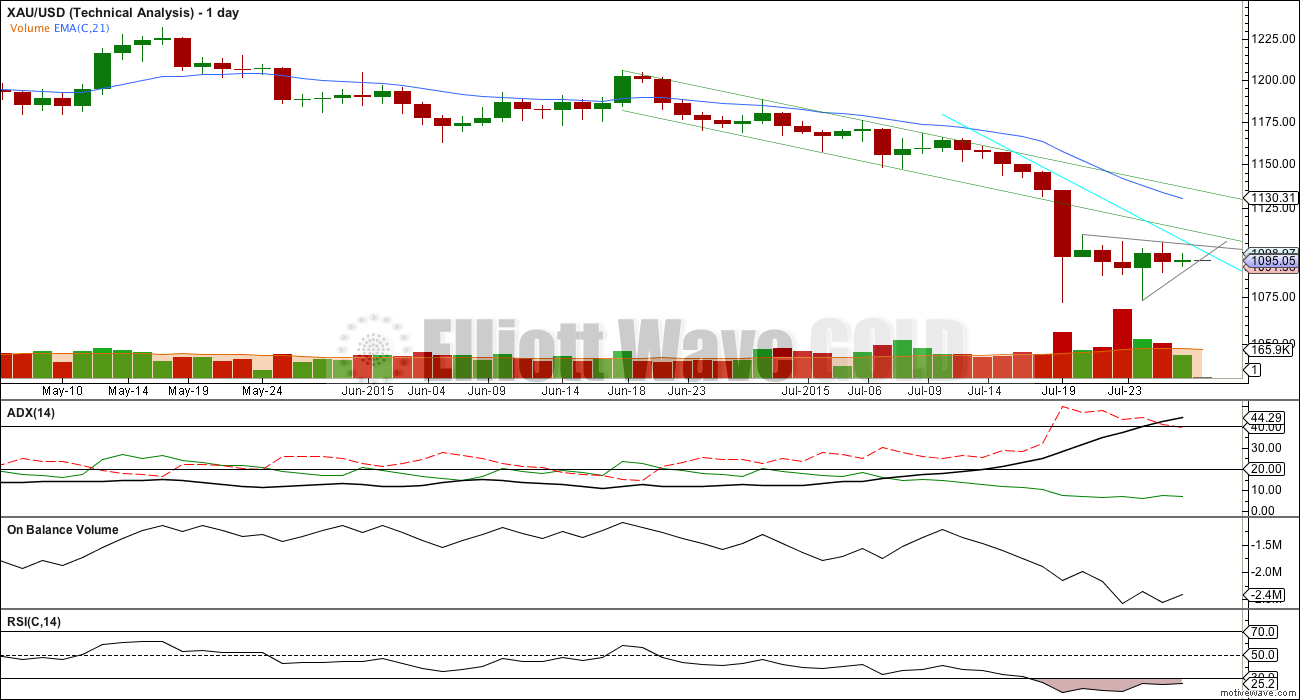
Daily Chart: Today volume is clearly declining and the trading range narrowing. This sideways movement looks like a fairly good pennant which is a reliable continuation pattern (pennants are smaller versions of triangles). 90% of pennants are characterised by a downtrend in volume, and they usually occur after a strong trend. Volume and the trend support this pattern. From Dahlquist and Kirkpatrick: “Two types of failures can occur. First, a breakout in the opposite direction from the previous trend can occur. Second, a failure can occur after the breakout. Because a flag or a pennant is usually a continuation formation, the breakout should be expected in the direction of the preceding trend, provided it is steep and sharp. When the breakout goes opposite to that trend, the failure invariably returns to the earlier trend, but only after a few heart palpitations have occurred first and a few protective stops have been triggered.” (“Technical Analysis”, second edition page 330).
Despite six days now of sideways movement, ADX continues to strengthen indicating the trend remains strong. The -DX line remains well above the +DX line indicating the trend is still down.
The simplest system for a downwards trend like this is to use resistance lines: each time price touches resistance that represents an opportunity to enter in the direction of the trend. Trades may be held until price either reaches support, a target, or if the trade is held for one day if you are a day trader. Depending upon your trading style, your risk management, and management of the equity in your account, stops as always are essential: they may be money management stops, they may be just above lines of resistance (allow for small overshoots), or they may be Elliott wave invalidation points.
The Trend Is Your Friend. Trading against the trend may be possible for very experienced professionals, but for everyone else it is strongly advised to trade only with the trend. It is relatively easy to profit in a clearly trending market, but only if you trade with the trend. Corrections against the trend offer an opportunity to join the trend at a good price.
The aqua blue trend line may show where this correction finds resistance.
This approach outlined here is just one trend following method of many.
There is a little positive bullish divergence last week: the low for 23rd July did not move below the prior low of 17th July, but On Balance Volume did make a new low. OBV moved lower while price did not. This bullish divergence indicates a correction against the trend to unfold, which is what has been happening. This correction should resolve this divergence.
The tiny doji for Tuesday indicates indecision, a balance of bulls and bears. With ADX so clear and volume during this small consolidation strongest for a down day, a downwards breakout is indicated as more likely than upwards.
This analysis is published about 06:52 p.m. EST.

A note on how comments are working: ATM it’s not possible to get comments to email you when someone replies to your comment, our comments plug in doesn’t support this feature.
Thanks for looking into it.
The triangle scenario is looking better today.
Micro wave D ended at today’s low, 1,090. It wasn’t a triangle, it was a zigzag with a complicated B wave in there.
Which means that micro wave B can be seen as a double zigzag.
Which means overall the triangle now looks better. It fits perfectly into it’s trend lines. They’re coming close to crossing over.
Micro wave E ended at 1,102. The triangle looks extremely likely now to be complete.
So the target for the fifth wave down is at 1,071, where subminuette v = subminuette i.
If this target is wrong it may possibly be too high. But I have learned (and members have watched this happen to us before) the hard way that fifth waves following fourth wave triangles are quite often shorter than we expected them to be. This target would see subminuette wave v not be truncated.
Once this fifth wave down is not truncated be aware of a swift end to it. We will then be able to use a resistance trend line, when it’s broken it’s over. While it holds expect price to keep falling.
As for the flat correction idea, it’s looking most unlikely today. Submicro wave (4) would be continuing so far sideways it is giving micro wave C a very strong three wave look, where it should be a five. It will remain technically possible so I’ll publish it as an alternate, but the probability today is greatly reduced. It’ll be invalidated below 1,086.57.
So depending upon your risk appetite you may like to have some confidence now the downwards trend is back for a final fifth wave down, or you may like to wait for price to touch below 1,086.57 before having that confidence.
I’m leaving comments now to write that up. Good luck everybody!
*edit: one more thing to add: cross the triangle trend lines over, look out for a potential trend change when they cross. this doesn’t always work, but it works often enough for it to be a tendency to look out for. sometimes that’s where the fifth wave ends, sometimes it’s just the end of a move within it.
Thanks Lara, I just bought back some DUST a few minutes before close that I sold at a higher price earlier today.
Thanks Lara, I just bought some more DUST a few minutes before close to add to the DUST I bought at too higher a price earlier today.
DUST chart flashing down trend in short term top head and shoulder.
I think wave iv is not done. But we will see tomorrow morning what unfolds?????
Lara
Did Subminuette 4 end at today’s high of 1,102.02 at 2:03 EST?
Is the triangle wave count for short, sharp, swift breakdown towards 1,066 or that area still in effect?
Yes we do still need confirmation below 10856.57 or that area.
Yes. Yes, and yes.
Gold price really needs to get back below 1093 comfort zone for the shorts…
Lara : Did wave E/iv complete at 1102? From here gold should move down????
Yes.
Wave counts that assumed the triangle ended and a down move began have been invalidated IMO.
Triangle invalidation above 1105.18.
Let see what Lara says.
I would not short gold right here
Well, I played bigger than I was supposed to, in a riskier environment, with a (still) not-up-to-par physical/emotional state, so I did a poor trade today and I got flushed out. Ok. Some people are stubborn. Darn whipsaw song!
vegetables, turmeric, vitamin C….
lol, don’t forget fruit…
tumeric? I’m not familiar with that one. What’s that do, not to digress from elliott wave…
ah, just looked it up. turmeric sounds fabulous
Anti inflammatory
Tumeric has the highest ORAC value of any food or spice in the world at 159,277 per 100 grams, Parsley, dried is 2nd at 74,349 . Both Superhealthy. Articoke 9,409 Blueberries 9,260 Ginger 6,944 ORAC. Health boosters.
I take a wide variety of mega superfoods daily so healthy to trade all day long and market research another 4 hours daily.
Nice headfake, now we down, no up, no down….
When you figure it out let me know. lol
My head is spinning time for a nap
yep.
will wait on Lara’s analysis today
Very funny, hilarious….
Today after FOMC the market was possibly most confused I’ve seen. Glad it ended up with Lara staying with triangle count with gold going down.
The miners might be making a decision ahead of gold here.
Do you plan to hold short positions through the FOMC update?
Trading a FOMC release is difficult, with a million traders trying to get it right. The people who get it right are the ones who have the information in advance (and that is not us). Some members are on the sidelines, others have positions with stops to try and protect from a move the wrong way, and others have stops set to take on positions if it moves the right way. Sometimes there is a whipsaw price movement in the first few minutes that hits the stops and the market then turns around. I expect that most players lose at FOMC release events.
Thanks Fence – Appreciated Buddy
All Gold price has done so far is take out Tuesday H 1098.70 / L 1091.10 in not a very convincing manner either side….. Takes a break above 1098-99 to possibly open up 1105, conversely needs a break below 1090-88 to open up deeper decline for a take out of 1081-80….. Let’s see what happens lol….
Alan
What is current gold wave?
I agree with Richard’s count below.
Subminuette 4 (of the triangle) ended at 1099.46.
The third wave down of subminuette 5 seems to be very slow.
Perhaps traders are dragging their feet (more like fingers) waiting for the FOMC minutes. Then we will see some interesting action. Gold price may drop sharply in this third wave, or it may decide to follow the Flat upwards. Price has fallen to a value quite close to 1094.90, submicro 4 of micro c. It may now be forming the second subwave of submicro 5 (miniscule 2).
Gold looks like it peaked at
1099.46 at 1:52 am
1090.54 at 10:01 bottom of 1st wave down
1098.94 at 11:39 top of 2nd wave up
in 3rd wave down
I posted yesterday that DUST will be correcting towards 32.96 or 27.61. Today’s low so far is 32.43, which is 0.53 below my first target.
I bought in today at 32.78, two candlesticks after the low. If I am correct, this upswing targets 41.32 (3rd wave) on the way towards 43. If I am wrong, it will drop again towards 27.61 after a short rise.
You did indeed – I need to start remember important info like this :'(
maybe a notebook beside your computer where you jot down important stuff every day?
I think that is a good trade.
We may find out at 2:00 pm
Do you have a wave count on XAU? Wondering if this am 1090ish was a new wave 1 down — with micro wave e of subminuette complete?
You may refer to Richard’s post above, or my reply to papudi. I outlined scenarios for both the triangle and the flat.
I see it, thanks.. was wondering ifyou concurred with RIchard’s count
Tham your projection yesterday of correction today towards 32.96 was impressive.
GDX chart
https://www.dropbox.com/s/5c8m167ph9hyrjf/GDX%20DAILY.png?dl=0
I sold DUST awhile ago.
Gold GDX NUGT going up the last 80 minutes.
Is gold about to drop now or is their some market shift this morning before 2 pm FOMC
Any wave counts?
Counting waves in these corrective phases is extremely difficult and none of us have a good track record. Lara has given us the two decision points. I think the market will wait until 2 pm to cross one of those points.
Is anyone considering entering DUST today for a move to a new low? Then move into jnug/nugt for wave IV?
PM sector has entered in impulse move down. I would not even consider getting on long side. Now till the Lara’s target for gold is reached stay in short or trade from short side.
Post’s after posts Lara has mentioned trade in the direction of Major trend. All surprises are in the direction of major trend.
My 2 cents. IMO.
Thanks Papudi – that is a recommendation well worth mentally logging as a cornerstone of my investment strategy having recently tried to ‘catch the bottom’
Nervous about exiting Long position today and moving short for FED to not raise rates and get a gold rally…
And to add to the “Trend Is Your Friend” also:
don’t try to pick highs and lows. Wait until a trend is clear, join it, exit when a trend line is broken.
no system ever will be reliable at picking highs and lows
I try to help with targets, sometimes they’re accurate, sometimes not.
If you miss the first part and the last part of a move, that’s okay. Get the middle. It’s easier, less risky, easier to profit.
I entered Dust pre-market. This is a new risk for me as my usual normal is to wait for confirmation between Lara’s two price points then enter.
I had a couple pre-existing shares which buffered my entry, so now that price has moved in my direction I will probably set my stop to include the gain those shares were holding.
Be careful. Happy Trading. 🙂
Sold my nugt at 3.38
Entered DUST at 35.48
Fingers crossed that bearish works today. Long has been a bugger!
Have you got a clear idea when to get off the DUST bus if it goes the wrong way or reaches its destination?
I didn’t Fencepost.
However –
$39 Out
$32 Out
Sound reasonable?
As you pay your tuition for a trading education, I doubt anyone on this discussion board will want to give specific trading buy/sell advice. However, various members will suggest methods that will help you on your journey (and which others have paid a lot of tuition to learn).
When you enter a trade, you need a clear understanding of why you entered it and how you will know to get out. I do not need to hear why you chose 32 and 39, but you ought to be able to write down for yourself why you chose those two points.
Hi Aidan,
There is a flaw in your entry and exit points, you are willing to except a 10% loss , with only the possibility of making 10% profit. You have to assume you will have several small losses for every profitable trade.
Yes already bought some DUST
Now I know you trade multiple times a day. I was appreciating your stating you bought today, then I remember – he buys everyday! smile.
Yes quick flips.
Sold and bought DUST a few times today.
I buy very small amounts for the subwaves intraday; nothing more than 0.5% of my account even if the temptation in some supposedly sure trades is strong. These are a bit better than scalping, quick in quick out guerilla style. They are for thrills, and keep me from dozing off.
I focus more on the larger degree waves: buy and hold for third waves, and swing trading for the others.
Of course, each trader will have to fit in to a style that is comfortable to him/her. Scalping is the most intensive on the concentration, and is not recommended for everyone. It also requires utmost discipline.
Yes making some extra money on small quick intraday trades is a good reason to stay awake. Since I don’t know all the wave counts I trade even smaller waves using some trend lines from TTM_LRC indicator.
Is It Time to Buy Metals? – 29 July 2015 By Avi Gilburt
– Elliott Wave charts – GDX, GLD, Silver
http://news.goldseek.com/GoldSeek/1438178580.php
First published Sat Jul 25 for members:
2:00 PM EST Wednesday FOMC US FED Big news
Gold and the US dollar react immediately in opposite directions.
I’m hoping gold drops as per Lara’s “gold surprises to the downside”.
This site also has fastest FOMC news that I’ve found.
http://www.marketwatch.com/newsviewer
1 minute live gold price here
pmbull.com
Does anyone else think there is a small inverted head and shoulders unfolding on the hourly? It looks to target the 1120-1125 range, which would fit with the false upward breakout counts…just a thought. I will be adding shorts tomorrow.
Something like this maybe? If we get above the triangle invalidation at 1,105.18, then we likely go to 1,121 or slightly higher.
Thanks for posting the chart. Yes I have been waiting for gold to cross slopping down NL around 1104 that will be a breakout. It may happen to day at 2 PM.
Bias is upward along with USD showing it wants go down.
Yes. I mentioned in a previous post. NL is from 1105 to 1103, shoulders at 1188 on right side and double bottom head around 1079.
Line in sand is 1105 for up and 1087 for down, just like Lara mentiond in the report.
If gold breaks NL it could go as high as 1131 to back test or just 1121 and reverse.
Lara, great visuals on the hourly charts–probable direction, movement, turn and validation points all very clear. Well done.
Thanks, that’s great it’s a bit clearer.
This analyst sees a back test of the trend line break coming for both Gold and GDX, but of course, a back test is not a sure thing. Theoretically, this could occur now, before Minuette 3 ends, or it could occur after Minuette 3 ends, after Minute 3 ends, or after Minor 3 ends. Each of these wave 4’s can move back up quite high. This creates many trading opportunities, but will challenge anyone trying to hold a position. Like Lara says, the trend is down, but it’s going to be choppy.
http://www.safehaven.com/article/38426/the-king-of-gold
GDX
This analyst is ALWAYS bullish on gold. No matter what happens, he will always find some reason to stay bullish. Therefore, you have/need to discriminate those analysts that have a biased position for some reason (bullish/bearish), like this guy – from those analysts whose views are neutral and let the PRICE tell the story – like Lara does. Don´t get carried away by the analysis from these false gurus that populate the web.
I agree that he is a perennial bull, along with Morris Hubbartt, and a few others. His chart just happened to show a potential back test, which I think is possible.
The more trading opportunities the merrier.
Lara, if the triangle scenario plays out and Gold hits your Minuette 3 target of 1,066, how high would you expect Minuette 4 to go? Back up to around 1,100 or higher? I realize that the invalidation point would move all the way back up to 1,162.80.
Lara mentioned in her comments, “Then minuette wave (ii) should unfold up / sideways to last about three or five days total.”
Yes possibly.
Minuette (ii) was relatively deep so minuette (iv) should be shallow. But that’s shallow agains minuette (iii) which is very long.
I do think it will probably be quite shallow, and may not get that high, because of the resistance from trend lines.