Downwards movement fits both Elliott wave counts, but with greatly reduced volume the main Elliott wave count is better supported.
Summary: The main wave count expects Gold is in a sideways consolidation which is incomplete. It may end with another three or six days of sideways movement. The alternate needs a five down to complete at the hourly chart level, and then a new low below 1,119.23 before any confidence may be had in it.
Changes to last analysis are bold.
To see weekly charts and the three different options for cycle wave b (main wave count) go here.
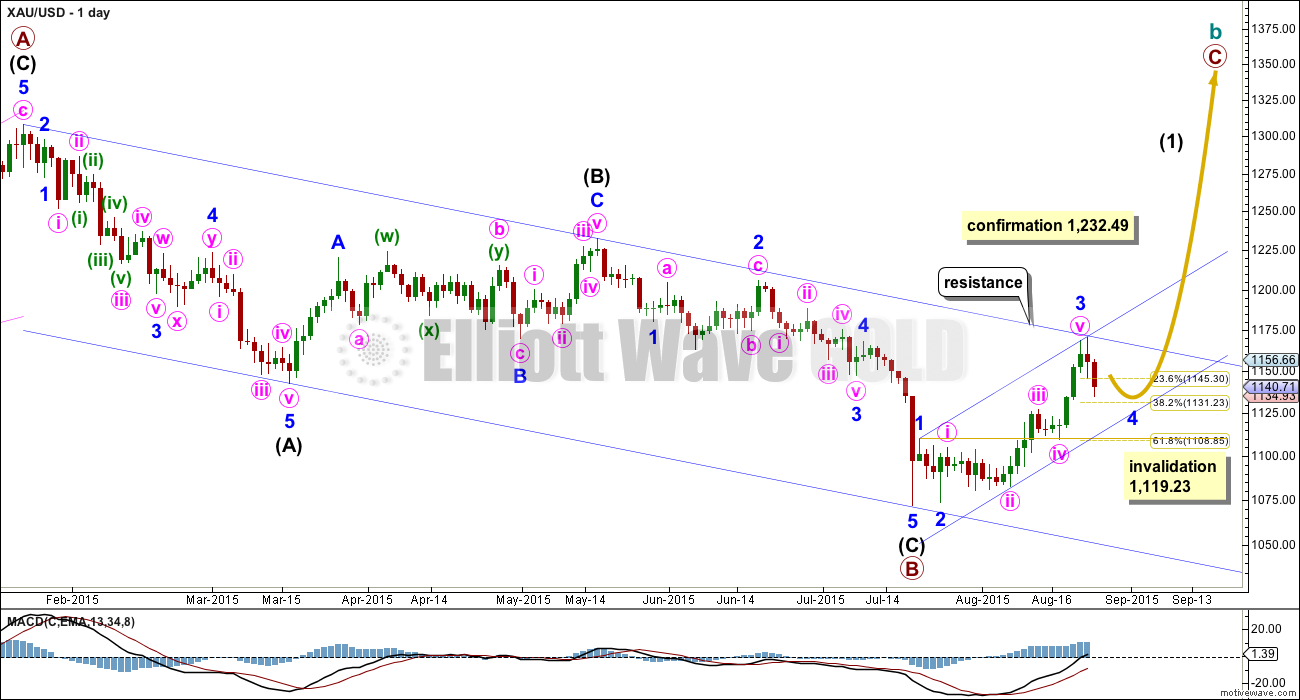
MAIN WAVE COUNT – DAILY
The bigger picture at super cycle degree is still bearish. A large zigzag is unfolding downwards. Along the way down, within the zigzag, cycle wave b must unfold as a corrective structure.
At this stage, there are three possible structures for cycle wave b: an expanded flat (50% likely), a running triangle (20% likely), or a combination (20% likely).
This daily chart works for all three ideas at the weekly chart level.
For all three ideas a five up should unfold at the daily chart level. This is so far incomplete.
Upwards movement is finding resistance at the upper edge of the blue channel and may continue to do so. Use that trend line for resistance, and if it is breached, then expect a throwback to find support there.
Minor wave 3 was 4.42 short of 2.618 the length of minor wave 1.
Minor wave 2 was a very deep double zigzag. Given the guideline of alternation minor wave 4 may be expected to be a shallow flat, combination or triangle. Minor wave 4 may now end again at the 0.382 Fibonacci ratio most likely.
Minor wave 2 lasted a Fibonacci three days. Combinations, flats and triangles are all longer lasting structures than zigzags, so minor wave 4 may likely total a Fibonacci five or eight days. So far it has lasted only two.
Minor wave 4 may not move into minor wave 1 price territory below 1,119.23 (this price point is taken from the hourly chart level).
Draw a channel about this upwards movement: draw the first trend line from the ends of minor waves 1 to 3, then place a parallel copy lower to contain all this movement. If minor wave 4 is time consuming enough, then it may find support finally at the lower edge of that channel.
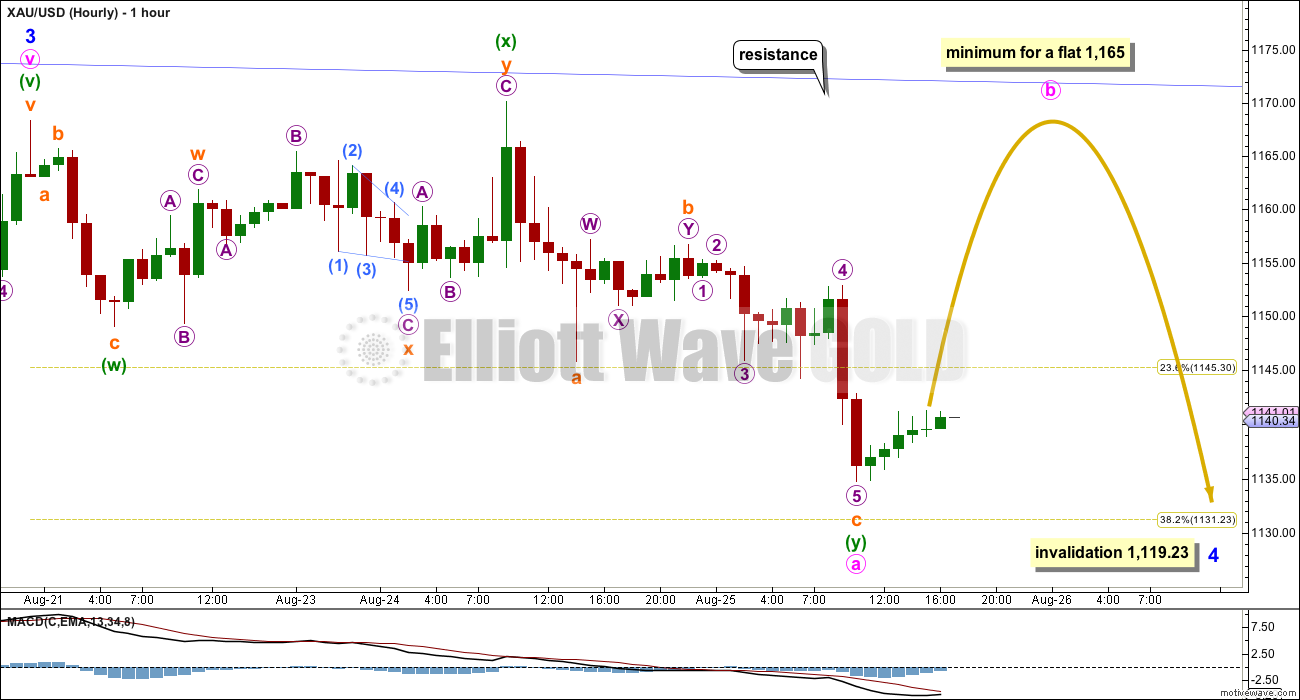
MAIN HOURLY WAVE COUNT
Downwards movement from the last high labelled minor wave 3 so far subdivides best as a double zigzag. Because minor wave 2 also fits best as a double zigzag, it is highly unlikely that minor wave 4 is over here; there would be no alternation at all in structure between the two corrective waves.
This double zigzag may be minute wave a of a larger flat correction or triangle for minor wave 4, with both structures equally as likely. Although I am showing a very deep wave for minute wave b it does not have to be this deep.
If minor wave 4 is a flat correction, then within it minute wave b must retrace a minimum 90% of minute wave a at 1,165. Minute wave b may make a new high above minute wave a at 1,168.41 if minor wave 4 is to be an expanded flat, which is a very common structure.
If minor wave 4 is a triangle, then there is no minimum requirement for minute wave b to move upwards. Minor wave 4 may be a running triangle, so minute wave b may make a new high above minute wave a at 1,168.41.
This first idea expects choppy overlapping movement to continue for minor wave 4 probably for another two or six days in total.
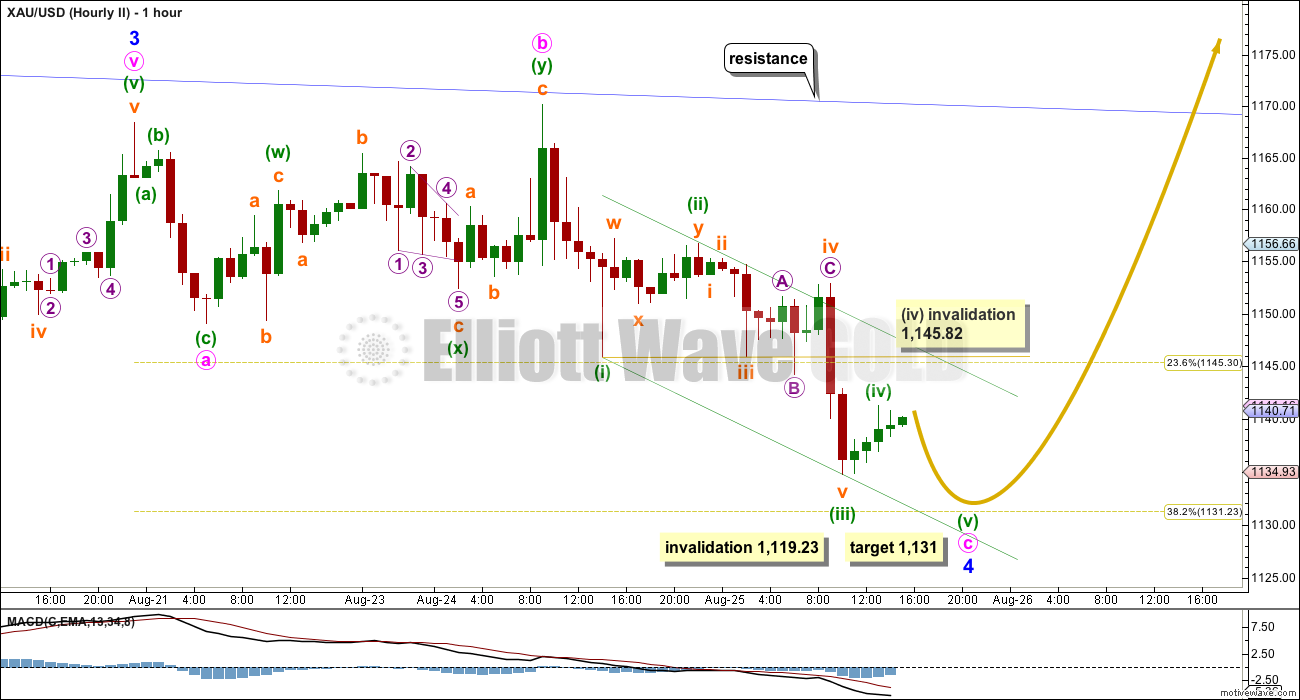
MAIN HOURLY WAVE COUNT II
By moving the degree of labelling within minor wave 4 all up one degree, it is possible that it is an almost complete flat correction. It may end close to the 0.382 Fibonacci ratio at 1,131. This would provide perfect alternation with the deep double zigzag of minor wave 2.
Within the flat correction, minute wave c must be a five wave structure. Minuette wave (iv) may not move into minuette wave (i) price territory above 1,145.82.
If price manages to make a new low and remain below 1,145.82, then this wave count may be correct. That may see an earlier end to minor wave 4, which could be over in just four days total. A subsequent new high above 1,170.19 would invalidate the alternate hourly wave count and provide confidence in the main wave count.
ALTERNATE ELLIOTT WAVE COUNT
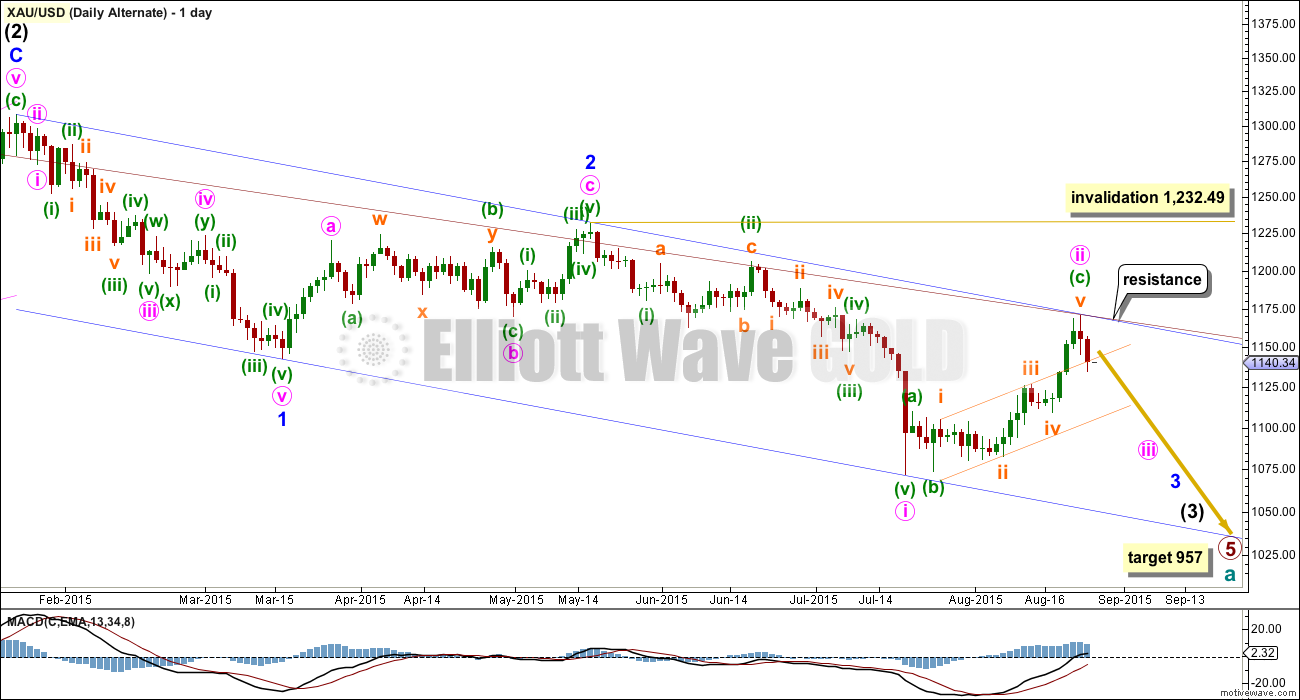
I would judge this alternate wave count to have about a 10% probability at this stage.
This wave count now sees a series of three overlapping first and second waves: intermediate waves (1) and (2), minor waves 1 and 2, and now minute waves i and ii.
The blue channel is drawn in the same way on both wave counts. The upper edge will be critical. Both wave counts expect some downwards movement from here to bounce down from resistance about the upper blue trend line. Here the blue channel is a base channel drawn about minor waves 1 and 2. A lower degree second wave correction for minute wave ii should not breach a base channel drawn about a first and second wave one or more degrees higher. If this blue line is breached by one full daily candlestick above it and not touching it, then this alternate wave count will substantially reduce in probability.
Minute wave ii may not move beyond the start of minute wave i above 1,232.49.
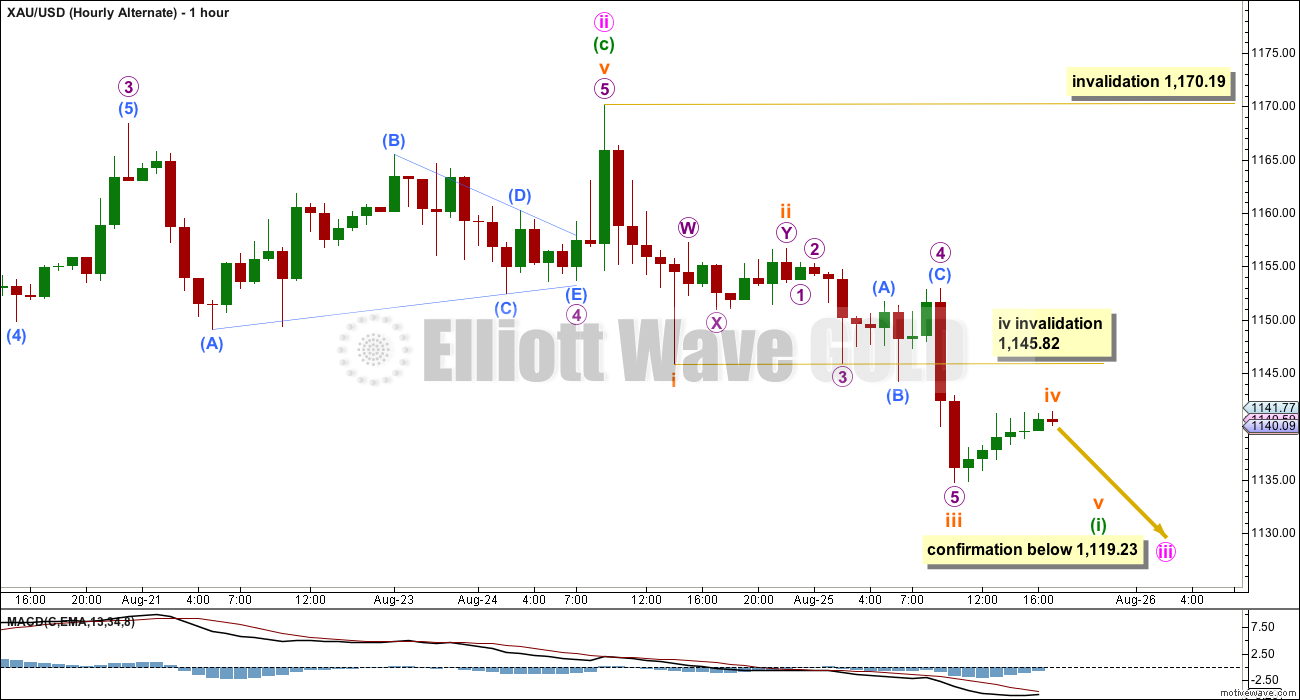
A new low below 1,119.23 in the short term would confirm this wave count. Full and final confirmation would come with a new low below 1,072.09.
If primary wave 5 reaches equality with primary wave 1, then it would end at 957.
ALTERNATE HOURLY WAVE COUNT
A third wave may only subdivide as an impulse, and the first wave within it must be a five wave structure, most likely a simple impulse also. So far there may be an incomplete impulse downwards. Subminuette wave iv may not move into subminuette wave i price territory above 1,145.82.
If price moves above 1,145.82 before making a new low to complete an impulse, then minuette wave (i) may be a leading diagonal. Within a leading diagonal, the first, third and fifth waves are most commonly zigzags. However, leading diagonals while not rare are not very common either. This would reduce the probability of this alternate further.
This downwards movement is now too deep and time consuming to be a continuation of minute wave ii. It should be the start of a third wave for this idea.
This wave count absolutely requires a new low below 1,119.23 before I would have confidence in it.
TECHNICAL ANALYSIS
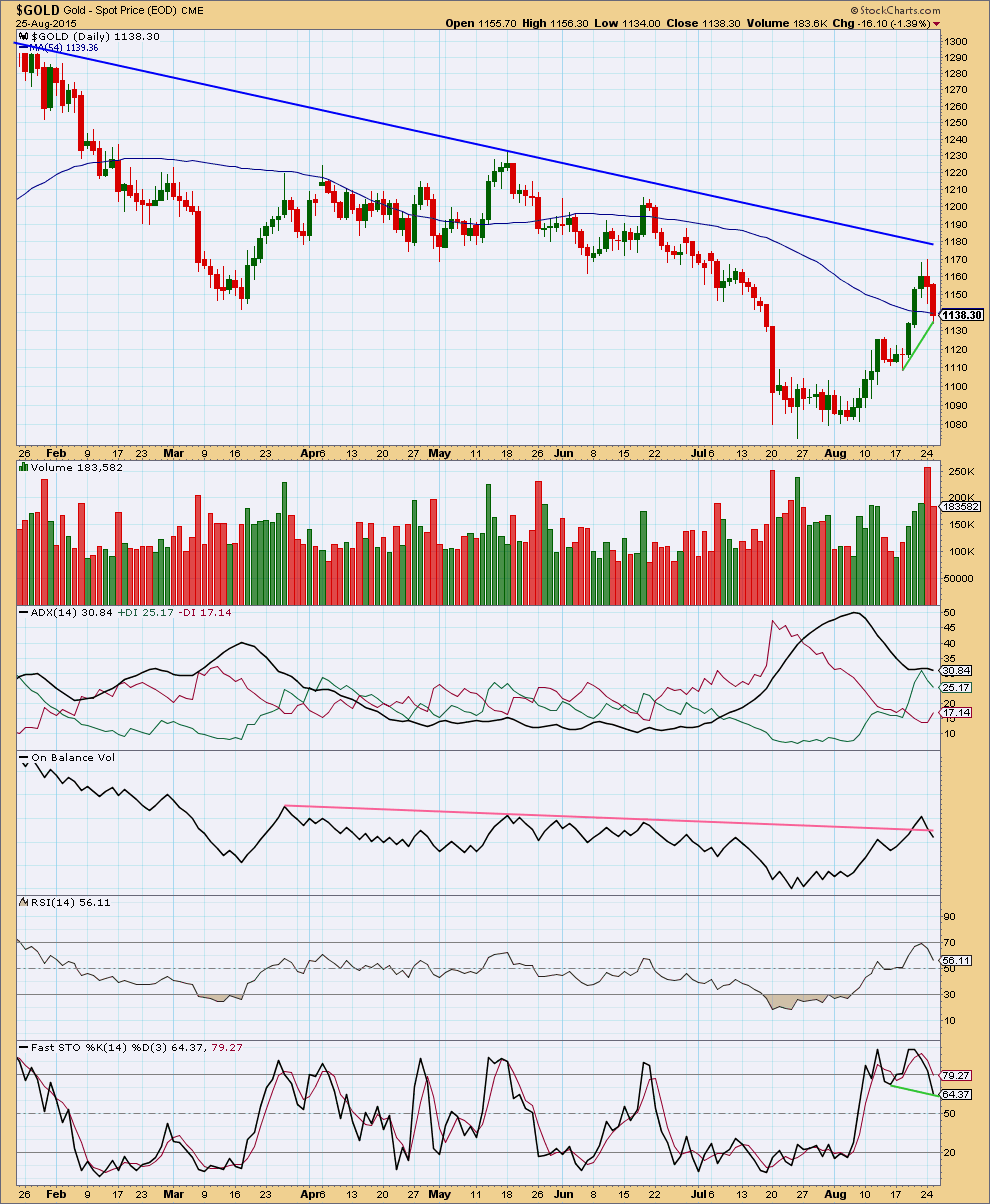
Click chart to enlarge. Chart courtesy of StockCharts.com.
Concerns I had yesterday over the volume spike for a downwards day are now alleviated. Today’s stronger downwards move in price comes on lighter volume. Importantly, volume for Tuesday at 183,582 is lower than the prior upwards day two days ago which was 189,582. This fall in price for Tuesday is not supported by volume. Monday’s volume spike may have been a volume spike for the final high which sometimes occurs at the end of movements for commodities. The volume profile today supports the main wave count slightly more than the alternate.
ADX is again turning downwards. No clear trend again is indicated.
On Balance Volume has breached its short pink trend line. This is fairly bearish and supports the alternate wave count.
Stochastics has returned from overbought. There is some positive bullish divergence between Stochastics and price for the last two short swing lows. This supports the main wave count. This divergence indicates underlying strength for price.
Overall the regular technical analysis favours the main wave count, but with OBV providing a bearish indicator the picture is unclear.
This analysis is published about 06:20 p.m. EST.

Comments section in August 26 Technical Analysis is not working.
However comments section is working at
GOLD Elliott Wave Technical Analysis – Video – 26th August, 2015
August 26 analysis out at 8:37 pm
Lara, we have a final confirmation on silver with low below 14.077 for bear daily. Can you update us on silver please after you get done with the other stuff? Smile.
I have a question for anyone who can answer it. How does an ABC flat correction unfold? That is, how many waves does each leg of such a correction have? Is it 5–3–5? I am starting to think that an A wave may have completed at the recent high and that gold is now headed down for an expanded flat B wave.
ABC is same as 123. 5-3-5. But an expanded flat is not ABC. it would be WXY, and would need to be 3-3-5
Thanks. Just had a mental lapse. 🙂
The last move up was a clear 5. So down may be a 3 if corrective.
Depends. In general, a trend can end with a 5 wave up for a fifth wave, followed by a trend change with a 5 wave down for a first wave. If it’s ABC, which is the same as 123, sometimes you don’t know if what looks like a 3 will turn into a 5 until later on.
A flat should always be labelled A-B-C.
W-X-Y is a multiple, either a combination, double zigzag or double flat. The subdivisions are different. Multiples subdivide 3-3-3.
A flat unfolds 3-3-5.
A zigzag unfolds 5-3-5.
Within a flat the A wave is a three, the B wave is a three and must be minimum 90% of the A wave.
There is a good video on the education page which explains it with pictures.
Thanks. Then my idea is wrong.
For those who care, a break of the uptrend line and gold’s movement above and now below the upper Bolinger band (without touching it) are clear signs that the downtrend has resumed. I have total confidence in my conviction.
Though, as I stated below, I believe this current swing will be very brief in duration and may only make it to the mid-1000s before more sideways/upwards movement.
Matt, would you clarify “mid-1000s”. Thanks
1050 area
The only scenario for the bull wave count now will be a leading diagonal unfolding upwards for intermediate (1). Their first, third and fifth waves are most commonly zigzags so minor 1 would be a complete zigzag and this downwards wave would now be minor 2 for a deep zigzag. It should move deeper. The common depth for a second wave within a diagonal is 0.66 to 0.81 of the first wave, that gives a range of 1,105 to 1,091.
The bear wave count now expects a five to unfold lower for a middle of a big third wave.
So at least short term more downwards movement for both wave counts.
The price point which will differentiate the two is 1,072.09. That would be final invalidation of the bull and so confirmation of the bear.
And a note on members advice given to me: when I have only a bull count or bear count I am told I should / must have both at all times. When I have both I am accused of not being clear and told I should pick one. I will never be able to please everyone and so I will continue to present analysis based on my knowledge, experience and what I see in the market. It’s fine to disagree with me but it must be done in a polite and constructive manner.
Everytime we have deep corrections I have a clamouring of people telling me it’s a new trend. It’s incredibly hard to resist the noise of that. I am going to be firmer in moderating tone in comments, and any nasty personal communications will see that member immediately removed and blacklisted. I have no tolerance for the usual nastiness which permeates the internet. It will not happen here.
Thank you to all members for keeping this a polite and professional space.
And to the upside it is that blue trend line which differentiates the two counts: for the bull that trend line must be properly breached. That would increase the probability of the count.
Any plans to post an updated US Oil EW Analysis? WTI is still trading in the descending channel so most likely nothing has changed since 32.7 target was posted.
Nothing has changed for Oil, I’m still holding a short position there, and the analysis will only be updated if the channel is breached to the upside.
No change means publishing it again would just be a copy and paste. Not much point in that really.
You know what they say about leading diagonals….every time you think it’s a leading diagonal, it isn’t. Now where did I hear that….
Probably from me.
Which is why I’ll reduce the probability of the bull wave count today to about even with the bear.
And again, I’ll sit uncomfortably on the fence until price tells us which one is correct.
A slight increase in volume today gives some support to this downwards move in price.
I know it was you, just messing around.
No worries 🙂
Will anyone be buying GDX at it’s low today to hold for gold retrace up to 1,150 area.
not me.
Me neither. There will be one more drop, and then it is possible to buy. I won’t get overboard though. If we correctly analysed this as a bear market, any rise will be corrective and prices will not get far.
Thank you.
Dust might get to 36 tommorow
Gold Price And Silver Price: Is this Rally For Real? – Avi Gilburt August 26, 2015
http://www.gold-eagle.com/article/gold-price-and-silver-price-rally-real
Richard: ” Invalidation of daily and hourly bull wave counts below 1,119.23 at 10:22 am,
when gold dropped to 1,118.49 .”
Lara’s alt hour bear chart states states “confirmation”.
What is the difference between the two technically???
actually, i think the second two counts were first invalidated last night, then confirmed this morning (although that’s not technically possible), while the main count was invalidated this morning. So really there needs to be all new counts, because all of them were invalidated i believe.
The Daily alternate wave count was the only chart not invalidated of the 5 charts.
The other 4 charts were invalidated.
It’s hourly alternate chart was first invalidated overnight with gold reaching 1,146.58 at 7:59 pm then confirmed below 1119.23 at 10:22.
Yes, you are correct
I can think of a linguistic/mathematical difference.
These two entities cannot co-exist in specific mathematical spaces. What it means is that in that particular region, only one of them can exist. So, if one is confirmed, the other must necessarily cease to exist. The converse is not necessarily true however. If one is invalidated, then the other may or may not be existent in a particular solution space. A case of simple logic.
Thanks all. Alan I thought u sleep.
1150 target is 61.8% of which wave prices please???
I was bought over that we are still in submicro 4 of subminuette 1. After reworking my prices, I have it now very roughly as 1147-1148 for subminuette 2 to end. A more precise target can only be worked out when subminuette 1 ends. Subminuette 1 should end in the low 111x, somewhere below the low of 1117.80.
All this assumes the bear count. I’ll wait for Lara to consider whether the bull is still alive.
I think gold is in a smaller 4th wave as long as it remains under 1133.55 (or thereabouts depending on your data).
This smaller 4th wave is a complete zigzag, so it could be over now.
Thanks everyone.
I’ll be waiting out the rest of the week or so watching my DUST hourly chart. (and EWG updates)
Planning for patience to pay out.
Congrats on all who caught the $19+- to $33 +- move. (I did not catch this one. Did close a prior position without loss– wooppee– sold too soon.)
Patience pays.
I got dust in a final fifth wave up.
Hopefully, if i got this right this fifth wave will end this monstrous 1st wave up for dust that started around 18!
I believe subminuette wave v of minuette wave (i) of hourly alternate (bearish) ended at a low of $1,117.80 at 10:27 am EST and gold is now in minuette wave (ii) up.
Tham comment below,
“Alan Tham August 26, 2015 at 10:31 am
For the bear count, this is getting to be very near the end of the first wave.
I will get in after the rebound.”
I agree. We are now in subminuette 2, rising in micro a.
How far up can we go?
Best guess at the moment is 1150. I have posted this in detail earlier.
I saw it below. Thanks.
not possible we are in 4 of subminuette 1?
That’s my thought too.
That’s what I am thinking here too. Subminuette 1 may finish today/tonight/morning, then i’d expect correction into about labor day weekend. This seems to line up well with GDX, which either finished wave 1 down or will finish it when gold does. Should be a great shorting opportunity!
What’s your est. target up for correction? Submit 1 shouldn’t go down much more
I see your point. Looks like you are right. The last up wave was too small and too gentle, so it had to be submicro 4 and not a larger degree wave.
The Minute II deep correction is real. We are in Minute III down, based on current hourly charts.
Any EW’ers able to identify the current minuette (green) and smuette(gold) waves?
Like Tham below, I’d like to enter a position for this Minute III wave down at end of
minuette (2).
Is the 1117.xx low minuette (1)?
Hopefully Lara will post us some smaller time-frame targets for this monster.
** Lara, any chance you’ll be considering sleeping split shifts for a while within this b wave and the US Sept Fomc upcoming? Thought not! lol **
I see where you’re at there now. Thanks , so you see a drop coming after this short rise. I’m keeping my long position open for now and keep a close eye on it.
I reckon 1117.80 was subminuette 1 of bear count.
If subminuette 2 retraces the normal 0.618, then it should end at 1150 thereabouts. It would take a while though. It is currently slowly making its way up its micro a wave. And it comprises 3 waves. Probably end sometime next week. A fibonacci 5 days perhaps, may be 8 though. I’m not good at time forecasts.
You could also watch the dead cat bounce in S&P 500. I envisage it would end about the same time as gold’s subminuette 2. Both would then drop in tandem.
Tham, yes looks like both gold and SP 500 should move up. Seems logical that GDX (being both equity and gold) would move up also. What do you think? Maybe EW tells a different story for GDX ?
Davey. That is my thinking too, until proven wrong. Only thing is that I am of the opinion that this move up is a correction against the main trend (which is downwards). But this is probably my own observation, and that of a few others here in this forum. Many gurus out there still (strongly) insist on both S&P and gold being in a bull market. Whether they put their money where their mouth is I don’t know. That will be the ultimate proof of their dogged stand. Anything else is just empty talk, and not worth our time listening to.
GDX made a new 52 week low today and RSI is not oversold yet. MACD signal line cross-over is a breath away. The move down has been very strong this week and I don’t see it slowing down. Once 13.00 breaks decisively it could be a swift and hard fall followed by a period of consolidation.
I’m curious to see how this plays out for the rest of the week. Does anyone know if there is any support below $13.00 for GDX?
Hit 20 day and 50 day moving average on daily chart. Closed my short now My £100 I bet on is now £420 in 2-3 days.
I’ve now gone long with tight stop to test the bounce off moving averages. haven’t a clue how this fits into Elliott’s wave. Lara will help me there.
Invalidation of daily and hourly bull wave counts below 1,119.23 at 10:22 am,
when gold dropped to 1,118.49 .
Gold then dropped to low of day so far of 1,117.80 at 10:27
Bear daily and hourly wave count has been confirmed.
Bottom target is $957 in about 30 weeks.
Isn’t this exciting? Bear to bull to bear. Just as in a tightly contested match.
I can see the bears awakening from their stupor and starting to lick their chops. Very soon, they will emerge from their caves foraging for sustenance. Most likely, a cocksure bull.
I was bamboozled by this move. I had thought I was pretty sure that DUST would have topped at 30.36. Now, this fifth wave is extended, probably overextended. My next (unlikely) target of 38.00 now seems to be within striking distance. I have a weak target of 34.95-34.97 (counted on two different degrees) though. These are encroaching upon bear territory, that was why I had dismissed them.
Personally, never ate that bull new scenario. A short five wave after a triangle wave 4? Please!! At 1,170 gold have much resistance. I overly respect Lara’s ability and dedication, but simply my common sense didn’t consider the main bull scenario by a minute. Gladly, i began loading DUST soon and keep adding on any rebound.
It takes a lot of confidence to act on our own convictions. Oftentimes, ours is the only voice crying in the wilderness. Everyone is touting one scenario but we may think differently. Do we follow the herd, or be adamant in our own analysis? That is the dilemma I sometimes have to grapple with. It just depends on how much confidence we have in our skillset. If you have been following my posts, you would have noticed that not once have I posted anything that is not my own thinking. I don’t look at what other gurus post. Their chances of being right or wrong are sometimes 50-50. Lara is the only one who has a much better track record.
netdania.com has 1119.150 which is lower than the invalidation point. Anyone initiating shorts here?
No. For the bear count, this is getting to be very near the end of the first wave. I will get in after the rebound.
Having said that, my DUST count doesn’t resonate with gold’s current movement. So, just watching by the sidelines and trying to make intelligent sense of it.
Thanks for your comment, Tham.
On close examination, this could also be the start of the third wave down. Will have to rework the gold wave count for clarity. In this scenario, it would tie in with my DUST analysis.
I’m not the best at counting short term waves, but I am thinking that from the top we saw 1-2, 1-2 and are in 3 now. Specifically, gold could be in a smaller 4th wave within that 3 down.
Shouldnt the invalidation on the daily be closer to 1109 rather than 1119?
I agree. Would a more experienced member please comment? Thanks.
It does look like that is the case.
Thanks MTLSD. So main wave count is still valid?
Correction: Minor wave 1 ended on same day as previous wave ended (intermediate wace (C)), so does not show up on the daily chart. On the 4 hour chart it can be seen as ending at the level Lara stated, 1119.23. So I believe the main wave count *has* been invalidated. Sorry if I caused any confusion.
GDX just made a new low. Last leg up looks like a 3 and this leg down looks impulsive.
Gold needs to turn here.
Unless your short….in that case, enjoy!
I opened a short position when the price was 1163.
Very good. Hold on to it – gold has much more to drop. My target is 1050 area, then perhaps a prolonged sideways/upwards movement.
I should add that I personally believe this is going to be a rather quick drop, with a hard bounce up. September is usually such a positive month for gold + this September, in particular, will be host to the most anticipated FOMC meeting in a decade.
Expect gold to be erratic here. Down hard, then strong reversal up, some hard gyrations in Oct/Nov and then eventually back down.
Sold my last 10% position in Dust this morning at $30.75. GDX looks like it may be finishing a c wave in a b wave, but it might also be heading to deeper new lows. Going to watch for a bit.
I no longer believe this is a c-wave in a b-wave, those new lows look more like the $12.12 target is in front of us.
My opinion: I have serious doubts now that this is a 4th wave. It is just too deep. Yes, it is still above the invalidation point….but only by $4. I could believe a 2nd wave correction, but not a 4th. Bear count looking healthier by the minute.
I should not have covered my short yesterday. Real bummer
Thd is wave 2. A bit deeper to go
Then 3 up!!
Update on Pendulum swing trading DUST/NUGT.
Dust is now in long swing up and NUGT is in down wave. Below is an explanation how it works. Simple Really yest>
DUST Wave 1 has already hit 60% up so it’s getting mature. I try to study the moves and try to be reasonable .. I concentrate on the losing etf which is at this time NUGT. Below is all of what I refer to as Pendulum Swings since the 3xers came out. A new swing starts when the current winner drops over 21% .. So far NUGT has already been down 43% from it’s last high. As you look over the historical moves notice that some full swings can stop around there but it happens over weeks, not days. That makes me believe this might be a pretty large move. That said, a WAVE 1 DOWN is when the leading etf (DUST at this time) drops over 11%. So if DUST goes below 26.50 we will be in a DUST WAVE 1 DOWN. From that point we either stay above the 21% down (23.51) and take out the old high of 29.95 or we don’t hold 23.51 and we would be in a WAVE 1 UP NUGT. Very seldom does new pendulum swing ends with only a WAVE 1 UP.
Big move up for GDX?
http://www.gold-eagle.com/article/update-stock-market-and-gold-mining-shares
Rambus still seeing the move up in GLD and $HUI as just a back test.
http://rambus1.com/?p=43311
Gold since the close started by invalidating 2 hourly wave counts above 1145.82 then quickly drops to within $2 of the lower target 1,131.23
Now I don’t know if gold can just drop to 1131.23 then up above upper trend line or has to go up to 1,165 – 1,170 then down to 1,131.23.
Not sure if the China and US market corrections are mixing gold up or just those darn b wave amusement ride patterns that have to play out before we get of the fence.
Lara,
I emailed you EWI’s gold chart but I’m not sure it was sent to the right email address.
Thanks, yes, I received it.
Their wave count is the same as Danerics. I sure would love to know how they resolved their (A) up as a three. They’ve labelled it a single zigzag. But within that A may only be a leading contracting diagonal, and the third wave within it is the longest violating the rule for wave lengths within a diagonal.
Maybe their data is substantially different from my FXCM data, and it works for them but not me?
I don’t know.
Maybe they’re rewriting rules for diagonals?
Curiouser and curiouser…
You’re welcome.
I think they get their data from Comex. It’s interesting to note that this specific publication didn’t expect gold to go below 1100, unlike other analysts at EWI.
If you have a specific question, I might be able to pass it to them.
New low
What are we making of the current movement? Expanding diagonal down for bear count?
Any chance for an update, Lara, with these quick invalidations?
Thanks.
Matt, I see a 100.0% retrace, no idea what wave it could be
It’s only a fraction above the low, more like 99.9% retrace….which usually means that it will continue. Is there any other option than a diagonal down?
Ok 1134.18 retrace of 1134.20, you’re right, wave 2?
It could be wave 2 of a diagonal up too. This is certainly extreme.
Leading diag down to 1142 for first wave A
B up to 1144
5 wave impulse down to 1136 makes larger A
Expanded flat in progress?
Expect same explosive move in the other direction?
I expect explosive movement in either direction.
at the same time!
looks like 3rd will hit 1141.5
According to PMBull, gold made a new low.
Dreamer, Can you down load that data as a csv?
I don’t see where you can download from PMBull, but if you want daily data for Gold in .csv format, you can follow the directions here:
http://www.historicaldatadirectory.com/2013/04/Gold-historical-data-back-until-1793.html
Thanks
It is probably a B wave within this fourth wave correction. There are 23 possible structures it may be, several of those possibilities may include a new price extreme beyond it’s start.
Thanks, Lara. The slow movement makes this probable. Still looks very corrective.
Yes indeed it does.
From the last high labelled minute ii on the hourly alternate wave count this downwards wave will not subdivide as a completed five so far; it will fit as neither an impulse (too much overlapping) nor a diagonal (the wave lengths don’t work, iii would be shorter than i and v shorter than iii, but iv would be longer than ii).
My conclusion is it is most likely corrective. And part of a larger incomplete correction.
For the bear alternate it would be an overlapping series of first and second waves which must resolve itself by a third wave down beginning.
That’s the risk here for sure, corrective, or a series of 1-2’s. GDX looks like it is finishing an impulse down, possibly a c wave in a b wave this morning.
Gold daily fork. 3rd reversal from top rail.
I must say I agree with Alex, I’ve become accustomed to monthly profits of 100%, I’m only up 65% this month!! Please pick up the slack Lara!!
P.S. Please don’t refund my last payment
lol….Since becoming a member here, my account looks like a leading diagonal, with a deep second wave zig zag, and now in the beginning of a third wave impulse up.
Lol, That’s was a good one!
I may have exaggerated for effect, but actually not much. I bought DUST at $12.17 doubled up at $17.37 and held to $37.30. I looked at DUST and asked myself how many times had DUST traded 6 days outside the bands, answer never, I sold and moved into NUGT at $2.92 sold to soon at $4.65, poor me. Bought DUST to soon at 21.55 and sold today at $29.20. I hope this doesn’t jinx my next trade, I alway’s seem to have bad luck when I reveal trades?
Great job!
It looks like Gold may be finishing a 5 wave impulse soon, hoping GDX completes one in the morning as well. I’m looking to start a NUGT buy around $3.
Robert, wow, cha-ching$.
May I ask how? Did you bravely pick either DUST/JDST or NUGT/JNUG and let it ride and your choice turned out to be correct?
LOL
working on it Richard
Invalidated: Main Hourly wave and Alternate Hourly wave above 1,145.82
Gold 1,146.58 at 7:59 pm on http://www.pmbull.com
Think you meant to say main hourly wave count II and alternate hourly.
Yes
Did we just invalidate the 2nd and 3rd hourly counts?….According to PM Bull, it looks like we did, barely.
MTLSD thanks for noticing.
Looks like my last edit didn’t make it….the leading diagonal is still possible, just with reduced probability.