Today’s Elliott wave analysis will answer the question of whether or not the correction is over, and also what to look out for with regards to confirmation.
Summary: The downwards trend should resume, which would be confirmed with a clear breach of the best fit bright aqua blue channel on the hourly charts AND a five down at the hourly chart level. Use the lower trend line to see if it provides support to price on the way down, then look for a throwback to that line after it is breached, which is at that time where there may be a nice entry point.
Changes to last analysis are bold.
To see weekly charts and the three different options for cycle wave b (main wave count) click here.
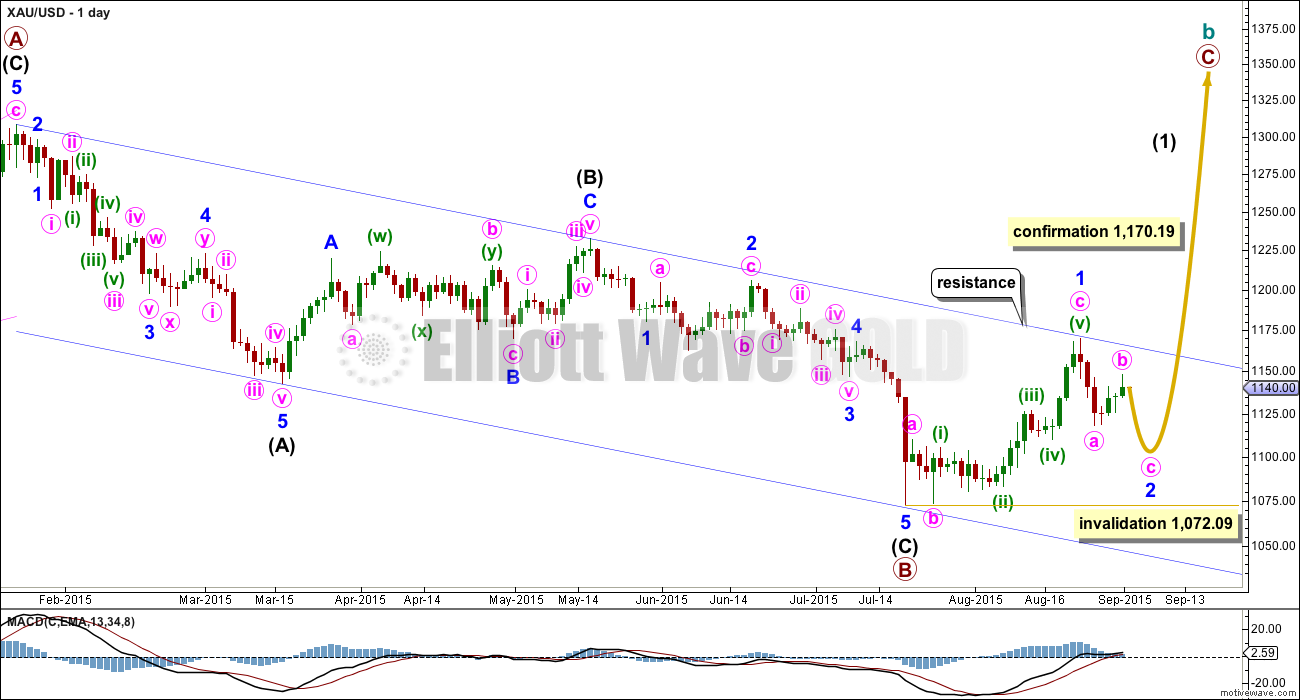
BULL WAVE COUNT – DAILY
The bigger picture at super cycle degree is still bearish. A large zigzag is unfolding downwards. Along the way down, within the zigzag, cycle wave b must unfold as a corrective structure.
At this stage, there are three possible structures for cycle wave b: an expanded flat, a running triangle, or a combination.
This daily chart works for all three ideas at the weekly chart level.
For all three ideas, a five up should unfold at the daily chart level. This is so far incomplete. With the first wave up being a complete zigzag the only structure left now for intermediate wave (1) would be a leading diagonal. While leading diagonals are not rare they are not very common either. This reduces the probability of this bull wave count now to about even with the bear wave count.
A leading diagonal requires the second and fourth waves to subdivide as zigzags. The first, third and fifth waves are most commonly zigzags, the but sometimes may appear to be impulses. So far minor wave 1 fits well as a zigzag.
Minor wave 2 may not move beyond the start of minor wave 1 below 1,072.09. If this invalidation point is breached, then it would be very difficult to see how primary wave B could continue yet lower. It would still be technically possible that primary wave B could be continuing as a double zigzag, but it is already 1.88 times the length of primary wave A (longer than the maximum common length of 1.38 times), so if it were to continue to be even deeper, then that idea has a very low probability. If 1,072.09 is breached, then I may cease to publish any bullish wave count because it would be fairly clear that Gold would be in a bear market for cycle wave a to complete.
To the upside, a new high above 1,170.19 would invalidate the bear wave count below and provide strong confirmation for this bull wave count.
Upwards movement is finding resistance at the upper edge of the blue channel and may continue to do so. Use that trend line for resistance, and if it is breached, then expect a throwback to find support there.
The structure of minute wave b now looks again to be possibly complete as a double combination: flat – X – zigzag. This is a slightly atypical combination in that it has some slope against the prior trend, but the second structure does not end substantially beyond the end of the first, so this is acceptable.
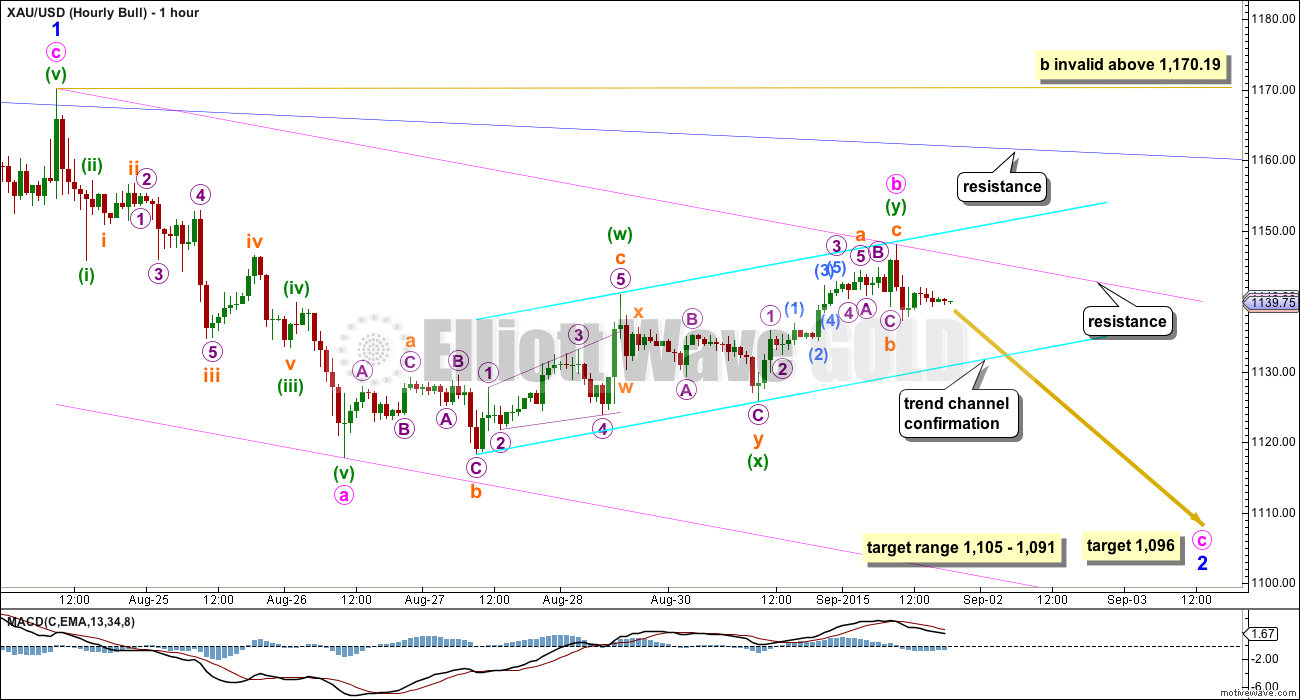
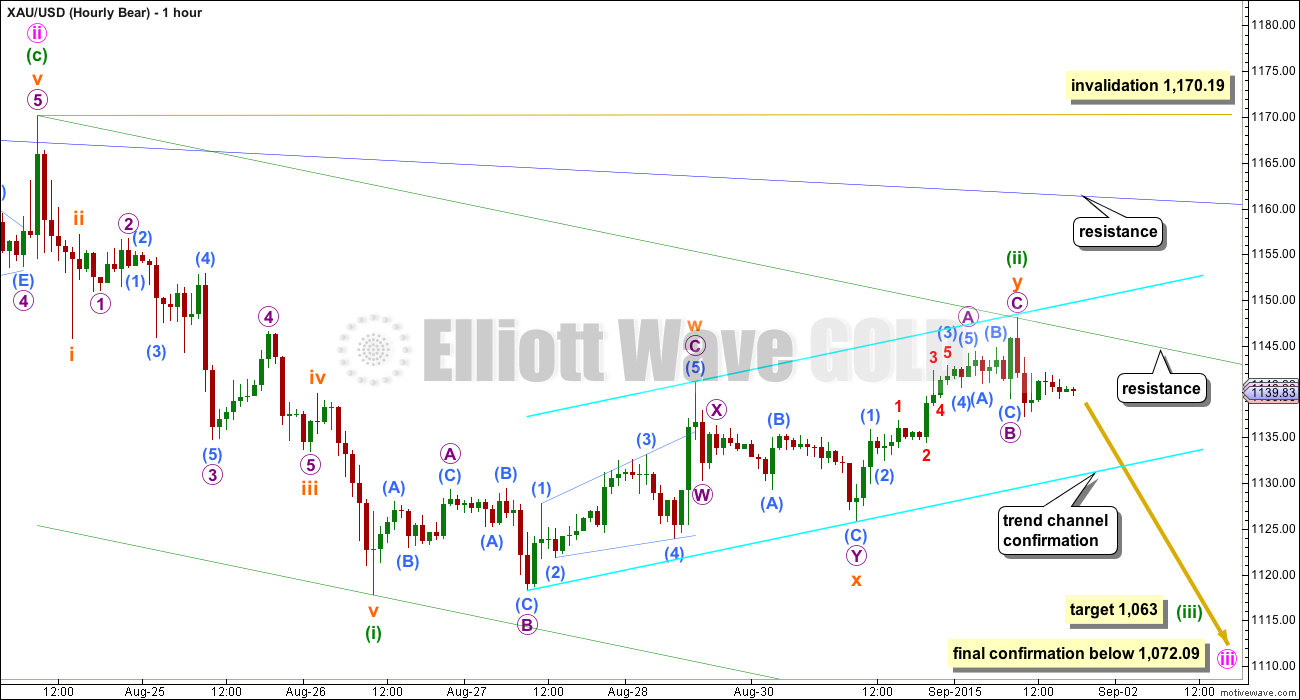
Minute wave b fits nicely in a parallel channel. This is not an Elliott channel, but the fit is good which may provide indication of where price may find support and resistance before the channel is breached. On the way down, if price does find some support at the lower bright aqua blue trend line, then once that line is breached to the downside look for a throwback to it. If that happens, then at that stage there may be a nice entry point.
When the best fit channel is breached then that shall be earliest confirmation of the resumption of the downwards trend. But a clear five down on the hourly chart is absolutely required for confidence that the downwards trend has resumed. While there is no five down it will remain possible that minute wave b may yet move higher.
If minute wave b moves higher, then it may not move beyond the start of minute wave a above 1,170.19.
The common depth of second and fourth waves within diagonals is between 0.66 to 0.81 the prior wave. This gives a target range for minor wave 2 from 1,105 to 1,091. At 1,096 minute wave c would reach equality in length with minute wave a. This target is nicely within the range.
Minute wave c may take about two to four days to unfold.
Draw a channel about the zigzag of minor wave 2. Look for minute wave c to end if price finds support at the lower pink trend line.
BEAR ELLIOTT WAVE COUNT
At this stage, the reduction of probability for the bull wave count sees this bear wave count about even now in probability.
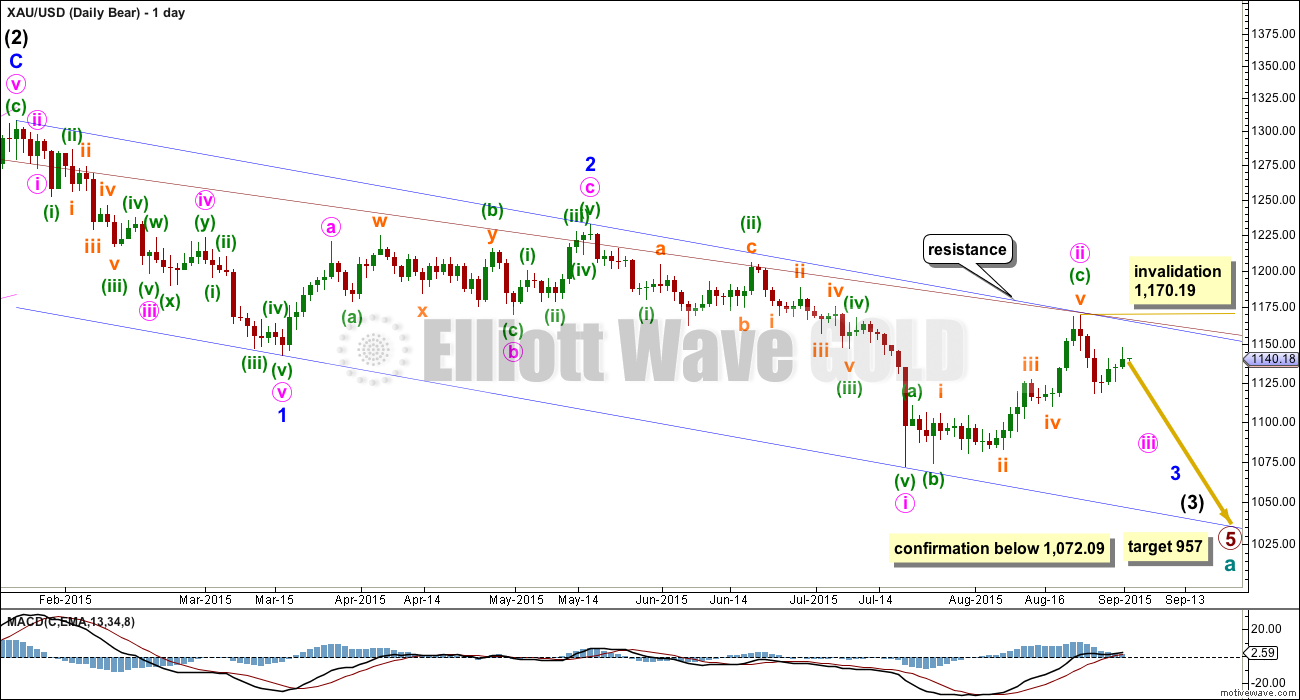
This wave count now sees a series of four overlapping first and second waves: intermediate waves (1) and (2), minor waves 1 and 2, minute waves i and ii, and now minuette waves (i) and (ii). Minute wave iii should show a strong increase in downwards momentum beyond that seen for minute wave i. If price moves higher, then it should find very strong resistance at the blue trend line. If that line is breached, then a bear wave count should be discarded.
The blue channel is drawn in the same way on both wave counts. The upper edge will be critical. Here the blue channel is a base channel drawn about minor waves 1 and 2. A lower degree second wave correction for minute wave ii should not breach a base channel drawn about a first and second wave one or more degrees higher. If this blue line is breached by one full daily candlestick above it and not touching it, then this wave count will substantially reduce in probability.
Within minute wave iii, no second wave correction may move beyond the start of its first wave above 1,170.19. A breach of that price point should see this wave count discarded as it would also now necessitate a clear breach of the blue channel and the maroon channel from the weekly chart.
Full and final confirmation of this wave count would come with a new low below 1,072.09.
If primary wave 5 reaches equality with primary wave 1, then it would end at 957. With three big overlapping first and second waves, now this target may not be low enough.
This wave count expects an impulse to be beginning downwards. An impulse subdivides 5-3-5-3-5. So far the first 5 down is complete.
The beginning of an impulse and the whole of a zigzag have exactly the same subdivisions.
The subdivisions are again seen in the same way for both wave counts at the hourly chart level. The channels are also the same.
Here the channel about minuette waves (i) and (ii) (green) is correctly termed a base channel. Along the way down, upwards corrections should find resistance at the upper edge of the channel. Minuette wave (iii) should have the power to break through support at the lower edge of the channel.
At 1,063 minuette wave (iii) would reach 1.618 the length of minuette wave (i). Minuette wave (iii) should show an increase in downwards momentum beyond that seen for minuette wave (i).
TECHNICAL ANALYSIS
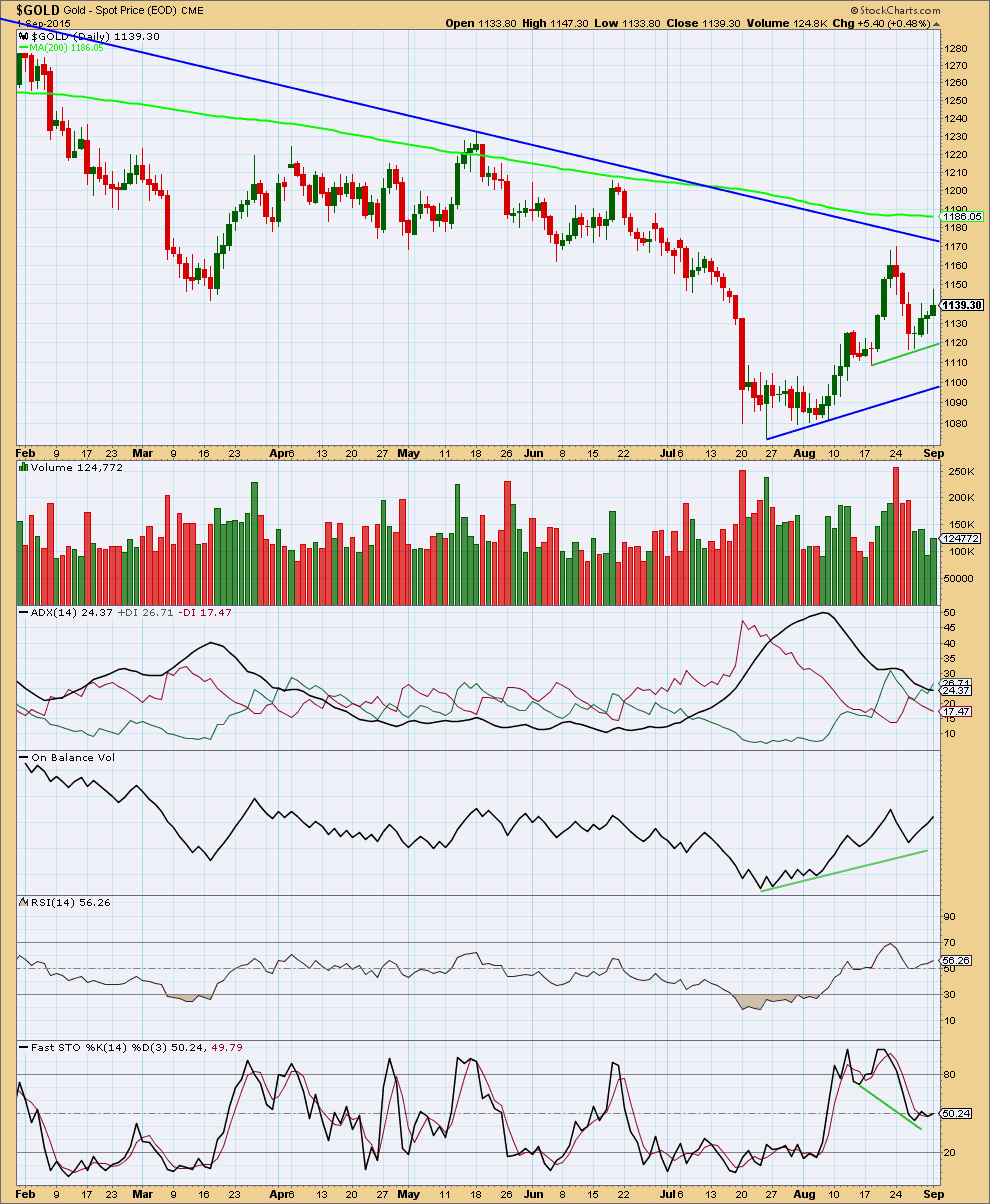
Click chart to enlarge. Chart courtesy of StockCharts.com.
Today’s green candlestick has increased volume over the prior day, but volume is still lower than the first two days of this four day movement. Volume during the last four days is declining, which indicates this movement is more likely a correction than a new trend and more downwards movement for the short term at least.
As price reached the last swing high volume rose. Thereafter, the fall in price came on declining volume. This volume profile indicates there may be a new upwards trend developing and supports the bull wave count better than the bear. However, while price remains below the blue trend line and the 200 day SMA a trend change from bear to bull is not confirmed.
The black ADX line continues to point downwards indicating there is no clear trend to the market. A range bound trading system should be used as opposed to a trend following system.
This analysis is published about 07:33 p.m. EST.

Text analysis is published now. Video uploading.
Lara, price is stopped at the Aqua blue trend line. Any EW guidence on direction from here? Tempted to go short-term long.
Advice given in analysis just published.
anyone thinking of going long?
Won’t trade bullish gold however I’ll trade the DUST low to highs intra-day though.
it doesn’t want to go down. But I’m unsure of it. I’m taking a very small position to satisfy the urge to be in the market
I concluded at the last minute that many miners had just completed their 5 down C wave and so I shifted more towards long. I note silver and gold went in different directions today. With gold crawling along that aqua support line, I’d be nervous no matter what position I had.
Gold And Silver: Dealing With Market Inconsistencies
Avi Gilburt September 1, 2015
http://www.gold-eagle.com/article/gold-and-silver-dealing-market-inconsistencies
got stopped out of my short. I think I’ll sit and watch for a bit. Have no idea what’s going on
I think DUST may be in the process of completing the last part 5th wave of the first five wave down on hourly count. However no trend channel confirmation so may not be correct count.
Any counts? Or guess on where could retrace to today?
Would you agree that price is near that trend channel line and we are seeing the support Lara told us to watch for?
Yes appears to be bouncing on the lower aqua blue trend line on hourly charts.
” On the way down, if price does find some support at the lower bright aqua blue trend line, then once that line is breached to the downside look for a throwback to it. If that happens, then at that stage there may be a nice entry point.”
DUST high so far today is $30.15.
Tham’s short term DUST target is 30.63 (third wave) followed by 31.28 – 31.78 (fifth wave).
Shahab short term target is 30.50, longer term is 48+.
DUST is bullish on multiple time frames today since the open.
Tham, what are your thoughts on dust?
Lots of overlapping occuring!
Sorry, Shahab. Had some errand to run. Just signed in.
For the short term, my DUST target is 30.63 (third wave) followed by 31.28 – 31.78 (fifth wave).
For the longer term, I have two counts, a bullish and a bearish one. I have to see what happens before deciding between the two. They would correspond to the bear and bull scenarios for gold respectively.
Thanks Tham,
I had a target of 30.5.
just wanted to confirm.
hopefully it is the bear, which would take us to 48+!
Silver moving up. Doesn’t seem like gold wants to move down.
Could be me but I have not seen any impulsive looking declines off yesterday’s highs yet.
What about yesterday (Tuesday) morning 9-11 am NY time? Then it could have been a flat until this morning around 5 am NY time.
I have been trying to fit something. Even in Lara’s bull case, this should be a wave C decline. I am not the best chartist but this is what I have so far since yesterday top
Looks to me that the end of your B,2 wave is higher than the start of your A,1 wave which means the downwave sequence has to start at the point you labeled B,2. That should simplify things.
I’d also assume Lara is right an we are in a C wave decline. A C wave divides as a 5, so use 1,2,3,4,5. I think wave 1 was yesterday morning and we are in wave 3 down now. My concern at the moment with my count is that volume (on pmbull.com) is not (yet) higher than yesterday’s wave 1. However spread is larger than yesterday.
I watch the miners for confirmation and they are delivering an unambiguous “going down” message today.
Interesting: Gold price appears to be finding support at 1135-34 (5dma) and really need to see Gold price at least down below 1130-29 (50dma) before a rising 20dma (1127-26) crosses above 50dma (bullish)…. Can the bears get it done?
Lara…are there any rules or guidelines about turning points?
Not quite sure how to define the question but…
For example…when a W5 up is complete and it’s time for the reverse waves to start,
1 – is there always an ABC correction or some variation thereof first?…and
2 – can there be an ABC correction which actually takes us higher than the top of W5 first?…or
3 – do we always go straight to an impulse or a diagonal down?…with the end of W5 always being the highest point?
In other words do wave counts always start and end at the highest/lowest price point on the chart?
Or is it sometimes this and sometimes that and that’s why the short term traders earn the big bucks?
You are pondering important questions for a trader. Here is how I deal with this topic:
1) in real time, you can never be absolutely sure when wave 5 is over.
2) in retrospect, a wave 1 always starts at the highest/lowest price point and wave 5 always ends at the lowest/highest price point.
Fencepost has a good reply. I’ll add my 2 cents worth:
It depends on what’s happening one degree higher. Which is why with EW analysis it’s essential to fit what you’re seeing into a higher time frame.
If the fifth wave ends a five wave structure for an A wave, then the next wave would be a B wave.
If that B wave unfolds as an expanded flat (they’re really common structures) then the next move for the start of the B wave would be a three, not a five, and then it would have another three to make a new price extreme beyond the end of your fifth wave.
If your fifth wave ends a fifth wave one degree higher then you would expect a new trend to begin with a five in the opposite direction and as part of that no new price extreme beyond the end of your fifth wave should be expected.
So the structure one (and also two) degrees higher, the bigger picture, answers your question with “sometimes”. Which I know is not a good answer because it involves ambiguity, but that’s how markets behave.
WEDNESDAY, SEPT. 2 8:15 am ADP employment
US NEWS that may effect gold
Hi Lara…thanks for posting the daily update…
I noticed you recorded the video @ 7:05pm EST…
It is now 9:43pm but no email notification has shown up for either video or printed version.
Has there been a change to the email notification process?
No big deal but ditto that for me, both Monday and today. So I re-subscribed to Notifications, but haven’t yet received an e-mail ack for that. Maybe a server is offline?
I received Monday’s analysis Email at 4:52 and 5:42 pm EST but have not received today’s Email.
I am sorry for this delay everybody. I’ll pass it onto Cesar and see if he can find a reason, and a solution.
We had problems with our server this morning. That may have been the cause of the delay today.
Please let me know how it goes tomorrow. I’ll make a comment in today’s comment section when tomorrow’s analysis is published in case anyone misses their email.
The analysis arrived 4:02 am and 5:07 am EST today.
$890 is the Gold Price Forecast for the Final Bottom in Gold
P. Radomski – August 24, 2015
http://www.gold-eagle.com/article/gold-price-forecast-final-bottom-gold
Great 15 year gold chart with major lows and trend lines that apply now.